By Steve Roth, a Seattle-based serial entrepreneur, a student of economics and evolution, and the publisher of Evonomics. He blogs at Asymptosis, Angry Bear, and Seeking Alpha. Twitter: @asymptosis. Originally published at Evonomics
It’s the American dream. A third of Americans think they’ll be rich someday. More than half of 18–29 year olds think they will be.
Less than 5% actually make it.* And many of those do it the old-fashioned way: they inherit it. About 60% of U.S. household wealth is inherited. Between a quarter and a third of Forbes 400 billionaires got rich that way. It may not be the most common way to get there, but it’s widespread, and it’s surely the easiest way.
That aspiration to wealth is deeply understandable. Getting high income from a good job is all well and good, but because wealth begets more wealth — people are compensated simply for owning things — wealth is, potentially, forever. It persists, and spreads through families and dynasties. Wealth can, and often does, endure for generations.
So it’s worth asking: how do Americans accumulate wealth? And how does that vary across income and wealth classes? How do the bottom 50% accumulate wealth, for instance, compared to the top 1%?
The Distributional National Accounts
A huge aid to answering that question arrived last month. Gabriel Zucman, Emmanuel Saez, and Thomas Piketty (PSZ) released one of the most important pieces of economic research in the last century. Their Distributional National Accounts (DINAs) reveal the distribution of national income to different income classes, wealth classes, age groups, and genders (and potentially different races, etc. etc.). This has been unavailable in the national accounts, and as a result it’s absent in most macroeconomic empirical work.
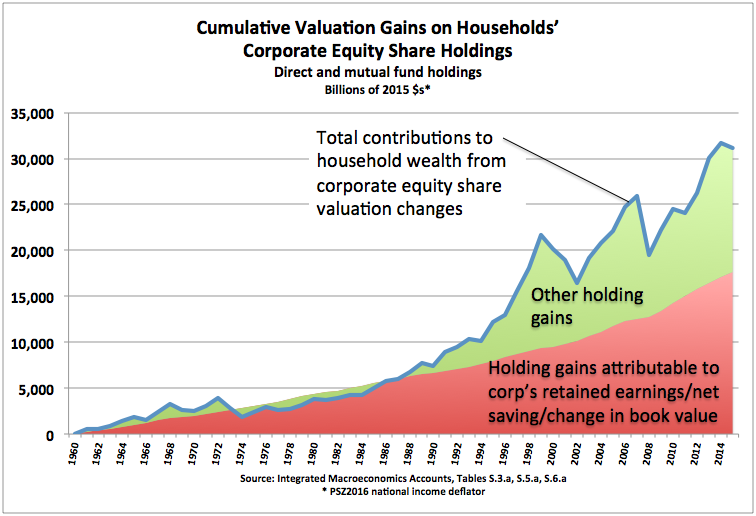
Here’s one poster exhibit:
Collect the whole set.
Zucman and company explicitly hope this distributional data “will be adopted by government agencies down the road” (see Conclusion slide). Here’s to it. The DINAs are a magisterial achievement, a treasure trove for empirical economists that merits easy access and prominent, front-and-center presentation in each release of the national accounts.
Income versus Wealth Accrual
But impressive as they are, the DINAs don’t fully answer the question of how Americans accumulate wealth. Because the DINAs only tally income, and income doesn’t include households’ holding (or “capital”) gains on stock portfolios, real estate, etc. Income does include much “property income” — dividends, interest, etc. That’s income from owning things. But it’s not everything that households receive from ownership. Holding gains figure large in that picture.
Any investor will tell you: cap gains are a big part of their wealth accumulation. Total return — dividends plus capital gains — is the measure that most savvy stock-market investors care about, long-term (and that fund managers like to tout, loudly). And much of Americans’ retirement saving — especially middle-class Americans — is accrued through capital gains on their homes.
The DINAs’ central goal is to match income as presented in the national accounts, and to reveal a multidimensional pyramid of distributional data underneath that income measure. A deeply worthy goal. But as a result, the DINAs can’t and don’t reveal the whole picture of household wealth accumulation (change in assets and net worth), or its distribution.
Here’s a rough picture of that disparity, showing a wealth-accrual measure compared to the PSZ income share, for the top one percent:**
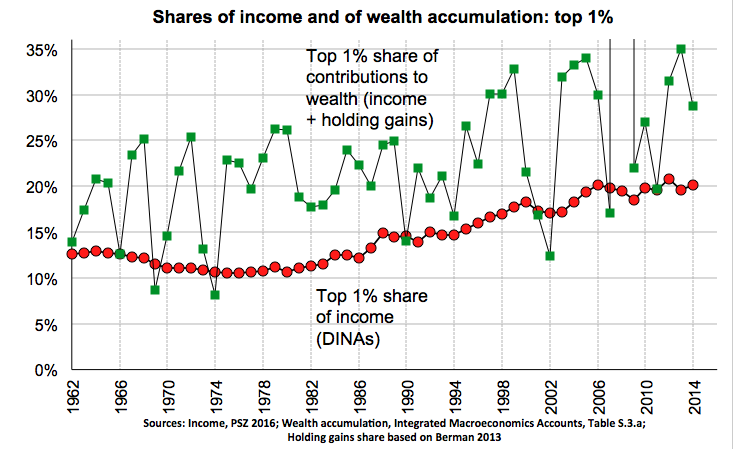
Clearly, holding gains are much more volatile that income. But this kind of graph can still tell a long-term, secular story — and even give important insights into shorter-term trends and business cycles.
To get a feel for this: Of $22 trillion in contributions to household wealth in 2013 (income plus holding gains), the top 1% captured $8 trillion, or 35%, compared to 21% of income. That measure has exceeded 30% in eight of the last seventeen years; in the three and a half decades before 1997, it never went above 26%. (2008 is an arithmetic anomaly here, by the way. Household wealth accrual was negative that year, but one-percenters’ wealth accrual, the numerator, was even more negative.)
Concentration of total wealth accrual is almost always far higher, and has been rising faster, than concentration of income alone. The rich are getting richer, faster. It’s an inequality picture more dire even than that depicted in the DINAs. And because wealth begets more wealth, it’s a self-perpetuating picture.
We pay people for doing things, and we pay people for owning things. Increasingly, the latter.
Before expanding and detailing this picture, it’s important to say that Zucman, Piketty, and Saez are deeply aware of this reality — have discussed it many times — even though footnote 10 in their DINA working paper serves rather to obscure than reveal that understanding:
In the long-run, a large fraction of capital gains arises from the fact that corporations retain part of their earning, which leads to share price appreciation. Since retained earnings are part of national income, these capital gains are in effect included in our series on an accrual basis. In the short run, however, most capital gains are pure asset price effects. These short-term capital gains are excluded from national income and from our series.
Gabriel Zucman has given me permission to share his understanding of the issue, sent in private correspondence:
You are correct that there can be pure asset valuation effects in the long run (i.e., capital gains in excess of those mechanically caused by retained earnings). These pure valuation effects are not part of national income, hence not included in our measure of income and our distributional series. However, they could be included down the road by computing income as delta wealth + consumption (i.e., Haig-Simon income). We have wealth in our database so we’re not far from being able to do this.
Such an effort would be very welcome. (Doing so properly would require producing a reconstructed, alternate version of the DINAs calculated based on wealth accrual rather than income, from the ground up — far beyond the rough and ready estimate of one measure provided above.)
That effort would be welcome because: capital gains/losses are not just short-term fluctuations in household wealth, oscillating around some ideal book value determined by income and saving. Wealth accumulation greatly exceeds saving from income, pretty much always and everywhere, over very long periods. And holding gains are not a small part of wealth accumulation, especially for already-wealthy households.
Building the Wealth of a Nation
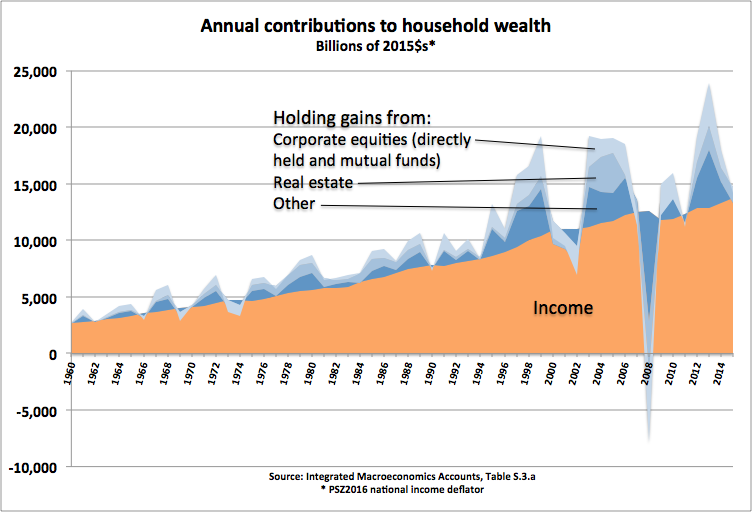
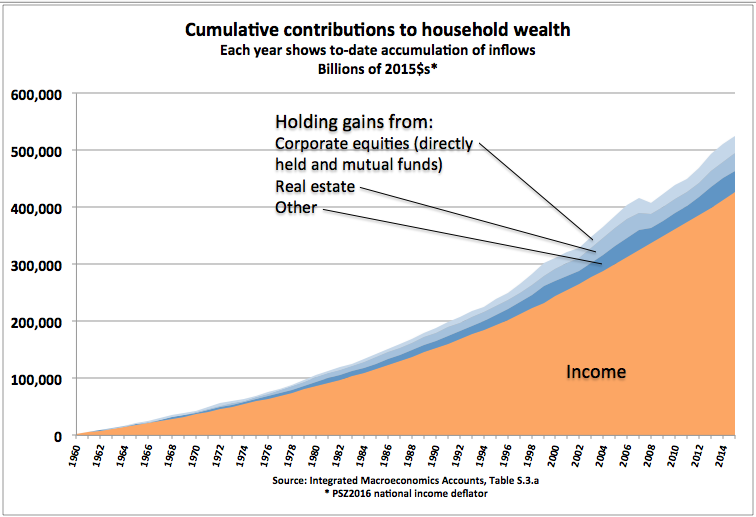
Below are some more pictures to get a feel for that disparity, based on the Integrated Macroeconomics Accounts (IMAs). They just show contributions to household wealth — additions to the asset side of household balance sheets. They don’t show outflows, deductions from the asset side (the primary one being consumption). Likewise, they only show “market” income — in IMA terms, “balance of primary incomes.” They don’t show nonmarket in- and outflows (mostly government taxes and transfers) that are outside of primary income.*** Holding gains are depicting the IMAs’ accrual-based, mark-to-market accounting for asset values.
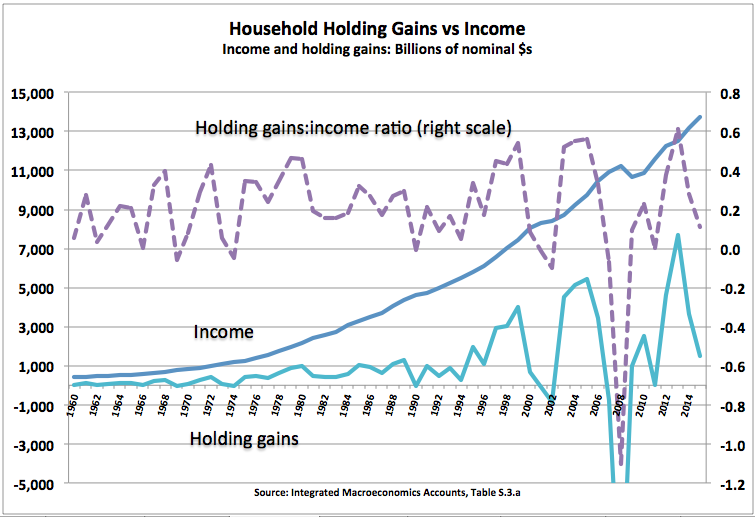
2013 is is a recent anomaly here that may surprise people, worth pointing out. Households saw nominal holding gains of $8 trillion that year — equivalent to 60% of income — mostly from gains on equity shares ($3.8 trillion) and real estate ($2.2 trillion).
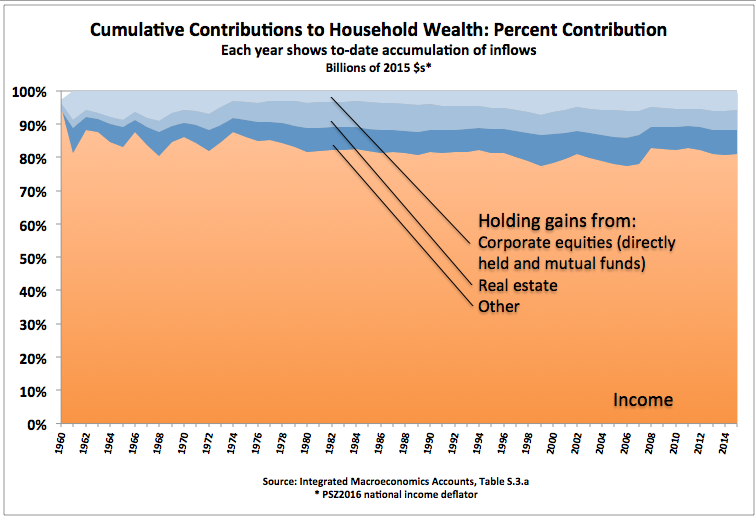
The share of accumulated, accrued wealth contributions attributable to previous years’ holding gains hit a high of 20% on the eve of The Great Whatever, after creeping up for decades. It dropped precipitously to 15%, and has started slowly climbing since. Absent a far more complete accounting, it’s not clear how that percentage has changed for different income and wealth classes.
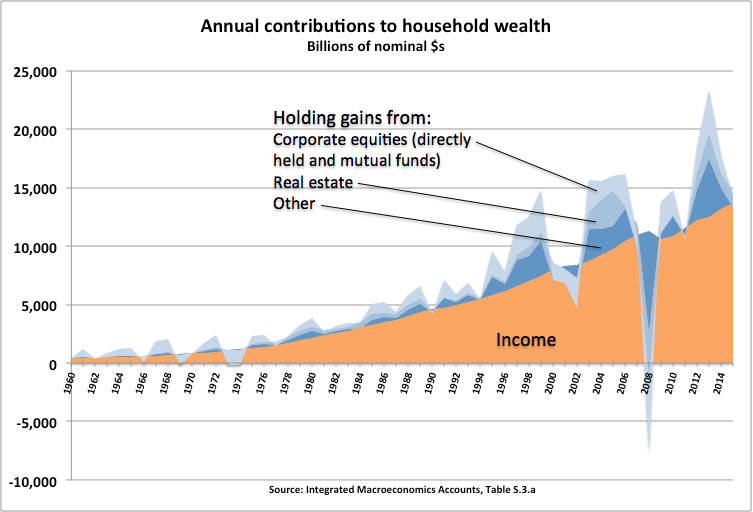
Here’s the previous graph with income removed, zooming in on the proportion of holding gains received from different asset classes:
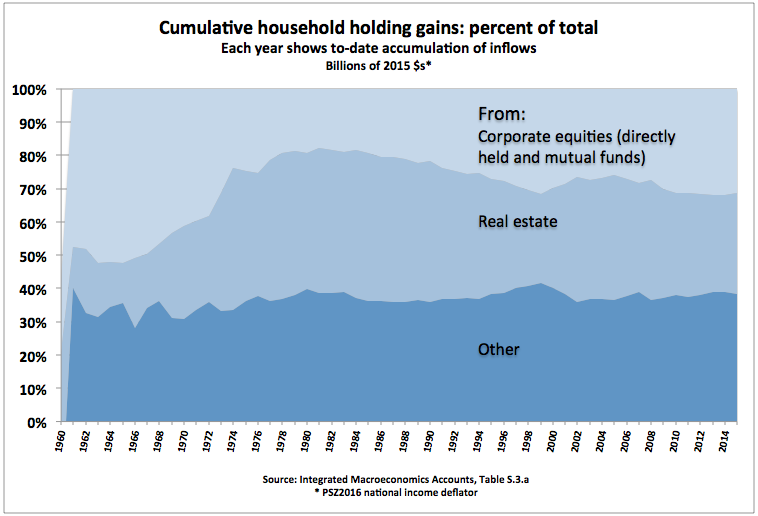
Holding gains from equities deserve some special discussion, because they’re something of a hybrid:
When firms retain earnings (profits) rather than distributing them to shareholders, the firms’ book value goes up. That increase is the firms’ net saving — think of it as firms saving on behalf of their shareholders. Stock markets certainly consider that increased book value when bidding up shares, so some portion of households’ gains on equities is arguably attributable to firms’ saving. But that portion isn’t delivered as income; households receive it as holding gains. The retained-earnings portion is hidden in those gains.
So is that portion saving from income (by firms), or holding gains (by households)? The answer is yes. It’s a floor wax and a dessert topping.
The key point here is that household holding gains on corporate equities far outstrip corporate saving, and not just over the short term. Over the last several decades those gains have delivered 31 trillion (2015) dollars onto the asset side of household balance sheets — $13 trillion more than corporations saved on households’ behalf.
So What Does it All Mean?
What’s the end result of all this wealth accumulation? I’ll point you to a somewhat outdated picture that puts across today’s massive scale of wealth inequality — far, far exceeding income inequality. Here. Be prepared to scroll.
Looking at all these pictures, you might be tempted to ask: are we just seeing a huge, many-decade, asset-price bubble? (Starting, if the nominal-dollar picture holds any meaning, with the demise of Bretton-Woods in ’71?) It’s possible that this will all revert, rather catastrophically. But I’d suggest otherwise: that we’ve actually been underestimating GDP for decades.
Coming back to our question, how Americans get and stay rich: holding gains are only one way that they get rich. But they may be the primary way that households, families, and dynasties stay rich. Because the wealthier a household is, the more it’s compensated for simply…being wealthy — for owning things, “holding” assets. (Maybe that’s why they call them households.)
That’s the kind of issue that might be well-explored with a DINA-style accounting based on wealth accrual, that includes holding gains. Here’s hoping that messieurs Piketty, Saez, and Zucman think it would be a useful effort.
On that subject, returning to one line of Gabriel Zucman’s:
[Holding gains] could be included down the road by computing income as delta wealth + consumption (i.e., Haig-Simon income).
I’ll just offer one piece of advice based on years proposing and presenting exactly that: think twice about calling it “income” — even with the Haig-Simons tag attached. I’ve received almost-universal pushback on the “comprehensive income” label, even from the most enlightened (and progressive) accounting-based economists, even the proudly heterodox. (Including some at extraordinary length, and occasionally even borderline hysterical in their negativity.) PSZ may have the professional moxie to bruit the label and make it stick. But for whatever reasons — maybe just tradition and convention, but maybe the vested interests of incumbent wealthholders — people are deeply averse to any definition of “income” that includes holding gains.
Instead, call it wealth (or asset, or net worth) accumulation, or accrual, or similar. Those are arguably better labels anyway, easier for most people to understand at a glance.
———————————
* If you were in the top 5% of wealthholders in 2013, you had north of $1.9 million in net worth — not terribly rich, though you could lead a comfortable middle-class life without working (or even better than that, if you don’t have many years left to live and spend).
** This is based on 65% of capital gains going to the top 1% of income recipients — a somewhat conservative estimate according to a 2013 study (Figure 14) based on IRS data, which estimated that measure for 2010 at 85%. This percentage undoubtedly changes over time, but an authoritative time series is not available. It’s also possible, though, that 65% percent is a big overestimate. According to Edward Wolff (in private correspondence), who has studied wealth and asset shares for decades, in 2013 the top 1% of income recipients owned about 24% of household assets. If they only receive 24% of capital gains, in proportion to those holdings (a pretty big assumption), you can stop reading this article entirely; income and wealth accumulation (and change in those measures) are roughly the same. Note that the “% of assets held by” measure seems to be completely unavailable — much less a time series. Professor Wolff was only able to provide that one-year spot estimate for total assets, and PSZ have no such measure — only percent of wealth (net worth).
Bottom line: the distribution of household assets, and especially the distribution of holding gains (relative to the IMAs’ annual mark-to-market revaluation estimates), are in need of further study.


Since there are less people making income in the lower 50% after 1994 they will therefore have less wealth, and so the separation of wealth starts to grow exponentially.
The only reason society and the economy has held on for this long is because we have released them from the “burden” of the gold standard. This has given people money, but not wealth. The end of the gold standard, and the subsequent increase in debt, was a last ditch effort, the last deep breath, of the ponzi scheme known as capitalism.
From Cold Moutain
January 6, 2017 at 7:53 am
Looking at all these pictures, you might be tempted to ask: are we just seeing a huge, many-decade, asset-price bubble? (Starting, if the nominal-dollar picture holds any meaning, with the demise of Bretton-Woods in ’71?) It’s possible that this will all revert, rather catastrophically. But I’d suggest otherwise: that we’ve actually been underestimating GDP for decades.
===================================================
“But I’d suggest otherwise: that we’ve actually been underestimating GDP for decades.”
I am not so sanguine…..
What an excellent encapsulation of the issue! We need this article sent to policy makers, immediately.
You missed the first paragraph: most Americans think they’ll be rich one day. Why would they vote against their future imaginary wealthy selves?
The solution doesnt even seem that hard. Let everyone hold all investments in tax free retirement accounts up to $X. Passive investment income is taxed aggressively beyond that level and redistributed downwards.
The US is way, way too deep in the swamps to ever make major reforms without collapse.
In fact, the first paragraph says that only one third of Americans think they’ll be rich today, but for the 18-29 year old cohort the number rises to over half. So by the time most people get a more realistic handle on both how the world works and what their own prospects really amount to the number of optimists drops dramatically. I would imagine that by the time most people get to fifty the percentage of optimists gets vanishingly small.
The real problem with these numbers is that it’s very easy to say, “I’m gonna get mine, some day”, but this comforting illusion would probably not stand up to a minute’s scrutiny. A thought experiment: if you offered all these optimists the proposition that in return for say, $10,000 they would have to give up their dreams of wealth. How many would take the money and give up the dream. I suspect quite a few. Granted that the system is rigged, but it is still true that the acquisition of sizable wealth from a modest base line rarely happens without a lot of luck, a lot of discipline, a lot hard work, and a big appetite for risk. How many people who think their ships are going to come in are really committed to the discipline, work and risk part of the proposition. Very few I guess, and even fewer who have any kind a plan that involve more than buying lottery tickets.
“the first paragraph says that only one third of Americans think they’ll be rich today, but for the 18-29 year old cohort the number rises to over half. So by the time most people get a more realistic handle on both how the world works and what their own prospects really amount to the number of optimists drops dramatically.”
+1 that’s how I interpreted it as well
18 year olds usually know little about how the world works, 29 year olds might, but only if they have spent more of their 20s working than in school.
There are no poor people in the US, just temporarily embarrassed millionaires.
“Le secret des grandes fortunes sans cause apparente est un crime oublié, parce qu’il a été proprement fait.”
– the secret of the great fortunes is an equally great crime…
Balzac
To get the nuance:
“The secret of great fortunes without apparent cause is a forgotten crime, because it has been well carried out.”
“Pour l’oligarchie, la solution est la guillotine.” – me
http://www.politico.com/magazine/story/2014/06/the-pitchforks-are-coming-for-us-plutocrats-108014#.U62q-LFqeWV
1789 seems far away until it doesn’t.
The key point here is that household holding gains on corporate equities far outstrip corporate saving, and not just over the short term. Over the last several decades those gains have delivered 31 trillion (2015) dollars onto the asset side of household balance sheets — $13 trillion more than corporations saved on households’ behalf.
Without even a superficial look at the tax system, it appears that getting and staying rich is as natural as the sun coming up tomorrow, just buy stawks. Consider that labor income is taxed mercilessly, and “capital gain” get’s the light touch and it is an artificial rigged system, rigged by the very rich that get the most out of it.
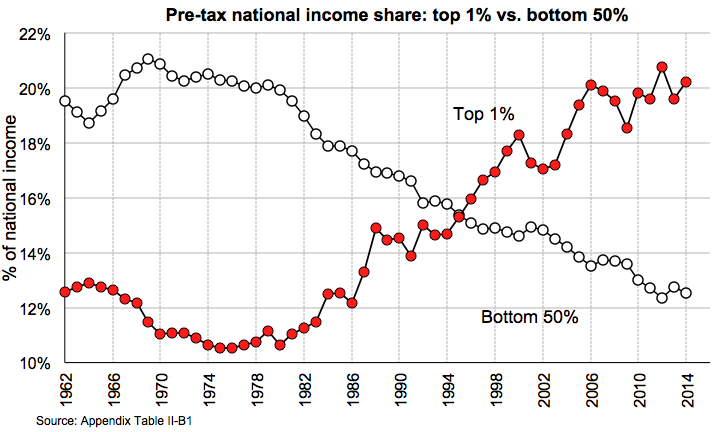
The very first graph, Pre Tax National Income Share: top 1% versus bottom 50% reflects accumulated weakness of labor bargaining power due to globalization. The negative aspects of globalization went to the bottom of the income scale and the positive aspects were harvested by the rich, again the system is rigged by and for the rich.
Without an estate tax that taxes the estate of a deceased rich person at greater than 50%, these estates end up growing to gargantuan size, again the system is rigged by and for the rich.
With all this rigging going on, how does a peasant survive, never mind prosper?
That $13 trillion “capital gain” difference between corporate equities and corporate savings represents $43,000 for every man, woman and child in the US, and it becomes even more of a figment of imagination when you realize that the big publicly traded corporations are liquidating themselves.
When peasants buy stawks, they think they are going along for the ride without realizing they are the ride.
Can you elaborate a little? What chance do peasents like us have then?
Peasants are the marginal buyer that supports the price of stawks that benefit the rich, and by the time they figure out that that crapola has been sold to them, it’s too late and they eat the losses.
There is negative chance for peasants in a rigged market.
None.
“We pay people for doing things, and we pay people for owning things. Increasingly, the latter.”
That sentence perfectly captures the post-industrial economic shift to a rentier economy.
Oh my. Yes, indeed. Wow. Good chart about a bad set of facts.
Basically this is a system of economic rent seeking for the very rich.
The average person works hard, but gets none of their productivity in the form of higher compensation. The rich take it all in the form of “holding gains”. Hence, the wage productivity gap combined with rising inequality.
In theory, this could be halted by:
– Steeply progressive capital gains (at the highest brackets, it should be a lot higher than labor)
– Steeply progressive inheritance taxes (seeing that 60% inherited their wealth)
– Very harsh penalties for tax evasion and aggressive tax planning
The large percentage that inherited their wealth discredits any claim that the US could be a meritocracy.
None of this will happen, barring a revolution though.
Many young people do not think about accumulating wealth or even earning money. Wanting wealth is a learned response to societal pressures or maybe to social reality. To pursue money for its own sake seems to me to be the height of foolishness which some people never realize and which others revel in. Successfully living without having to worry about, or desiring, monetary accumulation is perhaps the ultimate success story. It is a difficult goal in any case.
Consumer indebtedness informs the lust for sudden, unearned wealth. When I play the lottery, my first thought isn’t that motorcycle or Hummel figurine set that I’ve been pining after – it’s the prospect of paying down all my debt in one fell stroke. Then the pressure will be lifted, and I can live a decent life at last.
Why value a honest day’s pay for an honest day’s work, when a substantial chunk of that pay goes to Sallie Mae, my credit card company, and my title pawn?
Health insurance has made it impossible to live a frugal life. We’re all on the hamster wheel now.
Oh! Arrow to heart.
How does this play out in a deflationary environment? Would not an analysis of debt and a comparison of “holding losses” and holding gains be of great inteterest? (Sometimes I susect that governments like inflation primarily because of capital gains taxes – essentially getting something for nothing.)
Don’t forget stepped-up basis. It’s a major factor in propagating wealth across generations. And it is enhanced if you buy low-yielding stocks and hold them until death.
So, the bottom line here is “Them what has, gets.” No kidding.
Back when capital was less favorably taxed, there was less of it available. I remember when people had to take back a second mortgage in order to sell their houses. Or when years went by with very few IPOs. If society wants the benefit of capital, it must treat capital well.
According to Rob Arnott of Research Affiliates, in his essay, ‘The Myth of Dynastic Wealth,’ wealth in the US tends to dissipate at about 5% per year. Families in Europe are much more likely than Americans to retain their wealth through generations.
https://object.cato.org/sites/cato.org/files/serials/files/cato-journal/2015/9/cj-v35n3-1_0.pdf
The American Interest wrote a piece recently exploring questions of economic inequality. They discuss Piketty’s and Saez’s income measures and find them wanting because they do not consider government transfers and other factors, such as changing household size across income quintiles:
http://www.the-american-interest.com/2017/01/03/the-inequality-hype/
Roth presents an interesting critique of national accounting (especially as done by economists and how it influences his thinking). However his critique does not include environmental assets and debits.