By Joe Firestone, Ph.D., Managing Director, CEO of the Knowledge Management Consortium International (KMCI), and Director of KMCI’s CKIM Certificate program. He taught political science as the graduate and undergraduate level and blogs regularly at Corrente, Firedoglake and Daily Kos as letsgetitdone. Cross posted from New Economic Perspectives
The New York Times and Dave Leonhardt’s Upshot section made a big splash a few days ago by reporting on a study showing that the Canadian middle class had caught the US middle class in median income and likely surpassed it since. The study is based on an effort to measure median income per capita after taxes, and its results are presented as something truly significant.
However, I think the study is biased in that in median income per capita after taxes, it selected the wrong measure. What is needed is a measure of income or affluence that takes account of the value of cross-national variations in Government benefits delivered to the middle classes. Since the United States has lower taxes than most comparable nations, but delivers much less in safety net and entitlement benefits, it’s pretty clear that the measure used in the study reported on by The Times overestimates the real median income of the US middle class in comparison with the middle classes of other comparable nations and provides a misleading impression of the relative affluence of the American middle class.
In fact, it is likely that if real median income or median wealth per capita were measured in a more valid way that the study would have found that the US has lost its lead over other nations in Net Median Income Per Capita (median income per capita after taxes minus the cost per capita of benefits the State does NOT provide relative to the nation with the most generous safety net benefits), or per adult long before 2010. This is suggested by an earlier post of mine which I’ll now reproduce in full and then briefly discuss to conclude this one.
We’re No. 24! We’re No. 24! (As of July 2012)
We keep hearing bad news about where the US stands on various social and economic indicators. The US’s ranking in math capability is 27th in the world. Our health care system is ranked 37th. Our 2011 life expectancy is 51st in the world. Our estimated 2012 infant mortality rate is 49th in the world. So we’re pretty far down in a number of international statistical comparisons of performance. Some here point to better performance on economic indicators. For example, GDP per capita is often cited as an area where the US performs much better. But even here the latest CIA world handbook estimate shows the US ranked 19th on this measure at $48,400.
It gets even worse if you take a look at the recent Credit Suisse Global Wealth Databook 2011. Dylan Matthews, writing on Ezra Klein’s Wonkblog, did that on July 18th in a blog entitled “Are Canadians Richer Than Americans?” Matthews says yes, based on the Credit Suisse data on 2011 Median Wealth per Adult, and he goes on to also point out that:
”So not only does Canada beat the United States on median net worth. Just about every developed country save Sweden and Denmark does. The UK, Japan, Italy (!) and Australia more than double the U.S. Median.”
This important conclusion of Matthews gets a bit lost in the post’s central focus on a US/Canada comparison and his attempt to answer his lede question. A few days later, wigwam posted at MyFDL blogging on the Matthews piece, and presenting a table wigwam developed from the graphic used in the Matthews piece.
Wigwam’s numbers are approximate because he developed his table, from Matthews’s graphic, but his emphasis on the context of where the US stands relative to other nations is much greater than in Matthews’s post, and he also ties it into other issues such as foreign aid to Israel, the 99% vs. the 1%, and rising poverty in the United States. Wigwam’s money lines are:
“This is a chart that I’m going to show when Mitt Romney fans talk about “what makes American exceptional.” It vividly documents how badly America’s 99% are being screwed by its 1%. We’re a wealthy nation only when you count the trillions controlled by the 1% but not so wealthy when you look at the net worth of the median household.”
So, that’s what got me looking at the Credit Suisse Report. When I did, I found that Matthews had truncated the Credit Suisse data, and that in doing so he had missed some important aspects of US economic performance compared to other nations when viewed from the perspective of a “middle” US economic position. Wigwam, as well, in basing his post on Matthews’s, also reflects the same problems.
Specifically, Matthews and wigwam both included only 19 nations in their analyses, and ranked the US 17th out of 19th. In addition, in approximating the numbers in his table he departed a good bit from the actual median wealth per adult numbers in a number of cases. Here’s a chart that includes the first 36 ranks in the Credit Suisse data.
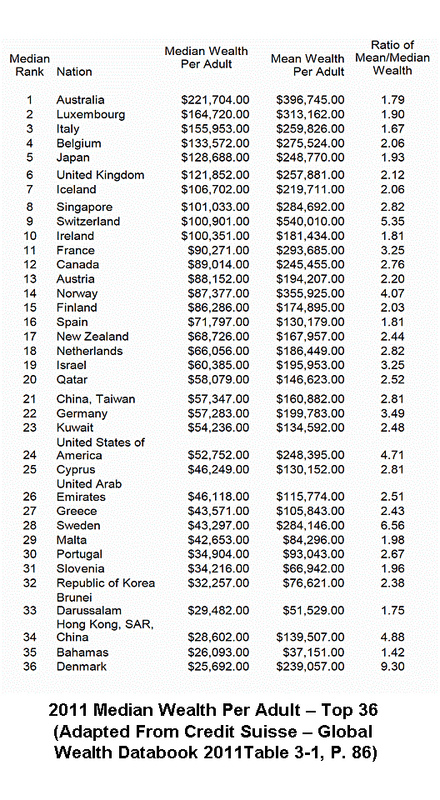
Looking at the results, you can see that the United States isn’t 17th on Median Wealth per Adult, it’s 24th. Now Luxembourg, Belgium, Iceland, Singapore, Austria, Qatar, and Kuwait, are all also ahead of the US in median Wealth. The “median person” is more than three times as wealthy in Luxembourg, more than two-and-a-half times as wealthy in Belgium, and more than twice as wealthy in Iceland and Singapore than in the US. Among nations that were included in the original WaPo and MyFDL comparisons, the “median Australian” is nearly 4.5 times as wealthy as the “median American; the “median Italian” is three times as wealthy. Japan and the UK have medians in the neighborhood of 2.5 times the US median, while Switzerland and Ireland have medians in the range of double the US number.
In short, the comparison with 36 nations included, shows that the US stands even worse, relatively speaking, than in the 19 nation comparison. The numbers show that many nations with recent and current severe banking/financial problems still have median wealth numbers that greatly exceed ours.
These include: Italy, Belgium, Iceland, Ireland, and Spain. The first four show more than double the median wealth of US adults and the last has a 40% greater median wealth figure. The US Fed is being called upon to use US nominal financial resources “created out of thin air” to bail out the financial systems of these nations, and will probably continue to provide such backing to “save the financial system.” The irony of our doing that when we refuse to use vigorous fiscal policy to help our own middle and working class people to remain employed, get new jobs, and work for a living wage, is another of those outrages to our democracy we experience every day.
The mean-to-median ratio numbers are also interesting to say the least. Nations with a ratio under 2.00 include Australia, Luxembourg, Italy, Japan, Ireland, Spain, Malta, Slovenia, Brunei, and the Bahamas. A majority of nations have ratios between 2.00 and 3.00. Nations over 3.00 include: Switzerland (5.35), France (3.25), Norway (4.07), Israel (3.25), Germany (3.49), the US (4.71), Sweden (6.56), China (4.88), and Denmark (9.30). So, the US is among the most unequal nations in the world on this measure. Among the nations that exceed it in inequality, the numbers for Sweden and Denmark may be statistical artifacts. The World Bank Gini number for Denmark is 24.9 and for Sweden is right behind at 25 with Norway coming in at 26, while the Gini is 41 for both the US and China, and 34 for Switzerland. This suggests that there may be something about the way welfare state transfer payments are accounted for that doesn’t get into the Credit Suisse Median Wealth per Adult statistics. Wigwam suggests:
“One of the anomalies in this data is that personal retirement plans (e.g., IRAs) usually count toward “net worth,” while general retirement plans (e.g., a public employee’s defined-benefit plan and/or Social Security) don’t. I’m told that Sweden and Denmark have excellent plans that take care of the elderly. Not only don’t those plans count toward their citizens’ “net worth,” but the excellent quality of those plans encourage their citizens not to save. If you had super-excellent government coverage to care for you in your elder years, would you set aside as much as the typical American? My point is that the median American is really at the bottom of this graph.”
Finally, I think the Credit Suisse Report gives the best picture yet of the failure of the US political/economic system to progress as rapidly as the systems in other modern nations. The jingoistic beating of our chests, insisting that the US is “the richest nation in the world”, with an unequaled political/economic system, just doesn’t square with reality. It may make a great many Americans feel good. But it’s not true and it doesn’t help us to face and adapt to our circumstances. In the end “all life is problem solving;” and you can’t keep on living well if you won’t recognize and then solve your problems.
Our system hasn’t produced the advantages for most Americans that other systems have produced for the citizens of their nations. How long will we continue to deny this in the face of mountains of cross-national data, and instead insist that our way is best? It may be best for 1% of us, but for the overwhelming majority, it is close to the worst among advanced modern industrial nations. Other nations produce better health for their citizens, healthier children and seniors, better education for their citizens, better work lives, less stress, more happiness, low cost universities. You name it; they’ve got it!
What we’ve got, instead, is an ideology about the free market that works for very few of us and makes the rest us less free, less wealthy, less secure, and less happy, as time goes on. Our economic system isn’t delivering for us. Our political system isn’t delivering for us either, it’s corrupt through and through, and our leaders won’t prosecute the rampant control fraud in the financial sector. And, finally, all we get from our representatives is excuses and rationalizations about why we can’t adapt to the changes, we, ourselves, had a great part in bringing to the world.
So, what can we do about it? I’m afraid this post isn’t about that. But, I think what we have to do is to create a new web-based Information Technology platform we can use to create a meta-layer of political activity that will take control of the major parties and either make our representatives accountable to the 99%, or replace them with new people who will be responsive to them. I’ve written about this a number of times previously. See here, here, and here, for example; and yes, it can’t be done in time for the 2012 election. Sorry about that, but what we have to do can’t be done in three months, and we should have started doing it three years ago if we wanted to be ready now.
That ends the previous post. Here’s the conclusion.
The Significance of Variations in Median Wealth Per Adult for Net Median Income Per Capita
Median Wealth Per Adult isn’t a direct measure of Net Median Income Per Capita. In fact, if we had a better measure of Net Median Income Per Capita, than Median Income Per Capita after taxes, we’d probably want to use it to test to see whether stagnant Net Median Incomes Per Capita after taxes lead to rapid declines in Median Wealth Per Capita. That is, to see whether trends in the flow of income impact stocks of wealth.
Lacking such a measure, however, and assuming that where the US stands on the stock of Median Affluence is more important in the first instance than where it stands on the flow of Median Income, it’s hard to avoid the conclusion that Median Wealth Per Adult is a better indicator of relative affluence of the middle class than Median Income Per Capita after taxes. Since that’s the case, it’s hard to justify all the attention this study is getting from the MSM and a good part of the blogosphere.
It’s now old news that the United States has been surpassed by other nations in Median Wealth Per Adult, and as my post shows, its Median Wealth Per Capita was less than 25% of Australia’s while the distribution of wealth in the US is far more unequal than the distribution in that and many other (including other English-speaking) nations as measured by the ratio of the Mean Wealth Per Adult to Median Wealth Per Adults.
So, one question which immediately comes to mind is if that’s old news, then would we not expect that such a result could only have happened if the United States had long since lost its lead in what I’ve been calling Net Median Income after Taxes, since that kind of result in Median Wealth Per Capita could have come about only primarily through an accumulation of Higher Net Median Incomes Per Capita over a period of years? If so, then the real news from the Times Report is that Median Income Per Capita is just a poor measure of affluence and has propped up the notion that the US middle class is especially affluent long past the time when this ceased to be the case.
In other words, the Times Report says more about the shortcomings of The Times when it comes to economic analysis, than it says about the real changing position of the US Middle Class when it comes to affluence. Oh, and to underline the point, the above table suggests that Canada hasn’t just passed the US relative affluence of its middle class, but that this happened some time ago, since in 2011 Canada’s Median Wealth Per Adult exceeded the US’s by nearly $36,000 per adult, or by roughly 69%, a change in relative affluence that had to be developing over a relatively long period of time, long before The Times decided to proclaim this as “news.”


Excellent analysis. Fits with what I see here in Canada.
Universal health care and low cost for post-secondary education make a big difference to the reality of middle class life. People are at lower risk to fall through the cracks because of medical expenses, for example. Universal health care also improves labor force mobility [people are not locked into their jobs to retain health care, though they may still be to retain private drug coverage].
Home mortgage interest is not tax-deductible in Canada, meaning that the internal rate of return on paying off your mortgage is better than any other low risk investment, with the result that at least some of the population pay off their mortgages as fast as they can. The result is quite a large pool of people who have little or no mortgage debt, and whose lives are therefore more stable and lower risk.
“Universal health care and low cost for post-secondary education make a big difference to the reality of middle class life.”
Not anymore.
http://healthcoalition.ca/budget-2014-triggers-harpers-plan-to-dismantle-national-health-care/
http://www.leadnow.ca/defend-health-care/
So can someone claim self-defense if they kill Harper?
Canadians are really worried that the US with all its pressure will succeed in destroying Canada’s health care like it has with so many others.
For example, look at what they are trying to do to Japan right now.:
As Obama Visits TPP Countries, New Obama Administration Report Targets Their Public Interest Policies as “Trade Barriers” to be Eliminated
The percentage of households with no mortgage is equal to the US, about 35% in both countries. Mortgage debt in Canada has surpassed 1.2 trillion which has come from something like 800B in 2008. At 10X population, that comes to 12 trillion, which is quite close to US levels.
Our government used real estate and our national and personal balance sheets to protect the GDP so they could get their majority. And the population fell for it.
What we are witnessing now is the calm before the storm.
Yea, and Canada is 10th on the list of honest political systems. Payola! The US is 24th. NEITHER is 1st!!! 2014 and 100% 3rd parties is the ONLY answer!
See http://www.transparency.org/cpi2011/results/
Canadian debt to personal disposable income is 145% compared to the US at 105%. At the peak of the US housing bubble, the US figure was at 125%.
More from Dr. Housing bubble:
“The young in Canada seem to be facing similar predicaments to those in the United States:
“Incredibly, almost 45% of all young people between 20 and 29 live at home. The jobless rate for the cohort is about 14%. Student debt averages $37,000 after a four-year degree. Underemployment is endemic.
And this is the big hope for so many Boomers – that the ‘next generation’ will pony up and bail them out? Good luck with that.”
Living at home and massive student debt! A story near and dear to our hearts. As much as some Canadians would like to believe they are different from their neighbors to the south we are very much alike in our addiction to debt. We also apparently have a large portion of youth living at home.”
http://www.doctorhousingbubble.com/canadian-housing-bubble-canada-real-estate-prices-generational-gaps-in-wealth/
Inter-generational households are normative in many cultures and throughout history. It can be a difficult adaptation for the unaccustomed but we’re finding that with time and effort, after the sting of our various disappointments has faded and numerous conflicts resolved, that it is both economically and emotionally advantageous. Admittedly, a year ago I was singing a very different tune and no one knows what the future may hold.
On the opposite end of the age divide, I’ve never understood the desire of seniors to flee to some retirement community, whether in their own town or someplace in the sunbelt. I can’t think of anything worse than being ghettoized as an elderly person–who wants to live around nothing but seniors?
As a senior, I’d much prefer a variety of different generations, etc., rather than being isolated someplace.
Of course decades ago, seniors as a “profit center” in retirement homes, nursing homes, or whatever, didn’t exist. As you imply elderly parents lived with their kids and grandkids, most likely in the old family home.
I’m with you, pushing 70 (and it pushing back). I’m living with my 28 year old son and three other twenty-somethings. It takes me back to my own twenties when I lived in a lefty commune in Berkeley. Not always conflict-free but certainly lively. The thought of living in sterile, suburban homogeneity chills me to the bone.
I’m Gen-X and have been preparing myself for such an outcome mentally and financially. I talked about this a decade ago with my parents and in-laws, boomers, and they laughed at me. Now close to 70, they kind of nodded a few weeks ago when I alluded to the fact we were still bracing ourselves for such an outcome.
Only cold hard reality will force individualism out of their worldview.
“Only cold hard reality will force individualism out of their worldview.”
Warmheartedness it turns out can be eminently practical, particularly when its getting so goddamned cold outside.
I recently read Bruce Levine’s The Fall of the House of Dixie. One of the many interesting and moving things I learned from this book was that one of the highest priorities of recently emancipated slaves was to locate and reunite with family members who had been sold away hither and yon. A lack of familial cohesion goes back several generations in my bloodline. I’m glad of the opportunity to break that tradition.
Still their college loan debt is smaller than many Americans, plus they get free healthcare that would cost a family more than $50k a year in the USA.
Health care expenses while insured are the #1 cause of bankruptcy in the USA.
That will get worse with Obamacare.
“Health care expenses while insured are the #1 cause of bankruptcy in the USA.
“That will get worse with Obamacare.”
American innumeracy — how do you get worse than number one? — combined with a solid dose of Republican Kool Aid.
What we have here is a generation of Americans unable to reason with both numbers and words.
-dlj.
The basic issue that makes the USA social problem intractable is that the federal gov’t is the most powerful State machinery that has ever existed and so its top aparatchiks are too much into themselves, intoxicated in their own self-righteousness and their overwhelming feelings of importance. So this machinery cannot be content just caring for the populace they control and harvest, just minding its own business. This gigantic coercive machinery has to preach and patronize, coerce and plot, on a planetary scale.
Most commentators are misled by focusing on the evils of the 1% or the 0.1% or the 0,01%. These people are just taking advantage of the gov’t carelessness for the internal situation. Thus social indicators decline as a consequence of the passivity of the gov’t related to the well-being of the populace, its focus being on planetary preaching, patronizing and coercion.
A vibrant community of free people that leads in science and technology is declining because they have let themselves be led by egomaniacs, idle mediocre but ambitious fools that spend their tax funded allowances playing regime change here and there, walking the red carpet to meet with the “our-man-yats” of the minute of whichever place they feel called upon by History to interfere and meddle in the name of half-baked principles they feel vital to defend.
yeah, they’re just minding their own business, “taking advantage of of the govt carelessness.
never mind the (revolving door) lobbyists essentially writing (unwriting?) the regs, the bills (obamacare, banking “reform,” TARP, environmental, farm), never mind Wall Street/ finance’s (global) influence (and again, that revolving door), never mind who really cashed in on the wars “playing regime change here and there.”
Yeah, those top aparatchiks eliminated a progressive tax code, deregulated banking, push fracking, keystone, TARP, privatization of anything and everything public, destroy/eliminate unions, the social safety net, etc., .. ALL ON THEIR OWN.
What planet are you on? Those 1% or the 0.1% or the 0,01% (or 5% or whatever) run the government, are the government… at least the “top aparatchiks.”
How the hell did Australia get to the top of this ridiculous table?
One reason only – we are selling off our non-renewable resources at a ridiculous rate.
What can’t be sustained will eventually fall flat on its face. Listen for the screams of agony from the well-to-do then.
By the way,call the measure an average or a median,there are a hell of a lot of Australians who don’t earn anywhere near the figure quoted and a lot of them are living in poverty.
‘How the hell did Australia get to the top of this ridiculous table?’
Two words: housing bubble.
House prices, in relation to median income, remain quite high in Australia and Canada (see Moneta’s post below). That was true of U.S. house prices in 2005-2007, but not any more.
These figures are a 2011 snapshot. Volatile asset prices mean that year to year, there is quite a bit of volatility in national net worth figures.
Thus the answer to the question in the penultimate paragraph about whether ‘[high] Median Wealth Per Capita could have come about only primarily through an accumulation of Higher Net Median Incomes Per Capita over a period of years?’ is no — changes in asset prices don’t show up in household income.
“I think the study is biased in that in median income per capita after taxes, it selected the wrong measure.” Quite so. I go further: every study that I’ve ever seen reported that does international comparisons does so in an inadequate way, and often the inadequacy has seemed to be deliberately chosen to suit the studiers’ interests.
I live in Nova Scotia Canada. There is a decline in population and economic activity. Part of the scam here is that there are lots of social programs and big corporate giveaways while the Province keeps going more and more into debt so the politicians can change seats at the Legislature and keep filling their pockets. I became convinced after Greece and Cyprus that Nova Scotia will go the same way, sell off/giveaway of Government assets and activity to satisfy the Creditors. And I believe it is all designed that way by the 1%. Nova Scotia is a Debt Junkie and, eventually, the Drug Dealer wants Payment.
(Americans think we have “free” healthcare. Think again, it is all paid for with taxes and most of that money goes to Big Pharma and their sickcare ilk. Universal Healthcare to me would mean that the care was also universally effective not just designed to fill the pockets of the 1%.)
RE: USA Middle class rankings
Looking at the list of nations ranked above us, I am struck by the fact that these nations all have restrictions on immigration to protect their jobs and social services. The US does not. I wonder how much better off we would be if we did not have 10’s of millions of illegals sloshing around competing for jobs and resources.
Immigration is not the problem, allowing companies to engage in activities which undermine wages is the problem.
Cognitive dissonance much?
This is about the 2013 version of the report but I suspect the earlier version worked the same way. And if so that data is junk as it uses NET WORTH.
http://blogs.reuters.com/felix-salmon/2014/04/04/stop-adding-up-the-wealth-of-the-poor/
“we’re talking about net worth, here: assets minus debts. And if you add up the net worth of the world’s bottom decile, it comes to minus a trillion dollars. The poorest people in the world, using the Credit Suisse methodology, aren’t in India or Pakistan or Bangladesh: they’re people like Jérôme Kerviel, who has a negative net worth of something in the region of $6 billion.”
It all sounds very promising however slightly misleading in Canada’s case because our trend is also the wrong way. Our social safety net has been under assault for the past 20 years, with each major political party taking their shots. That means voters have no option to reverse this trend. The ubiquituous neo-liberal argument that “this is how things work now and there’s no other choice”. Even the NDP continues to support major corporate tax breaks – fashioning itself after Blair’s New Labour. I suppose the neo-liberals are correct for a change: we have no choice but to keep paying higher taxes for less service. The New World Order! There goes the Canadian middle class’ strength in this survey.
Next throw in an economy that relies on its export market to the USA plus a construction industry(with the country sitting on its largest real estate bubble in its history). Lest we forget all our government debt. Deficit spending is a Canadian specialty as our politicians love to spend money they don’t have as much as the Fed loves to create money out of thin air.
Anyway thanks for the survey. It’s nice to know we’re #1, Nero was too when he took up his fiddle. Now back to Richard Dawson for the next survey…
Canada seems to be on the wrong trajectory. Yes, it is better than the US– but how much is the growth in median wages due to a bubble effect? There was growth in median wages in the 90’s in the US, but was this fueled by a bubble? There was a mild reversal of inequality trends but there were also policies put in place that set the stage for a return to more inequality. Under Bush, even with an enormous real estate bubble and deficit spending, it seemed like for average citizens, we were just hanging on.
Now, this is not to say that Canada is just like the US circa 2007 US. Obviously they have more measures in place to protect their citizens– but it appears that the Harper government is doing their best to neoliberalize the country. You would think that Great Britain and the US would serve as a stern warning (especially Great Britain– they had more to lose, and lost it with more speed.)
Canada seems to be on the wrong trajectory
but it appears that the Harper government is doing their best to neoliberalize the country
I agree with both statements.
A little history is helpful here. In the 90’s the Liberal government at the time put in place campaign finance reform whereby the political parties were funded from taxes and campaign contributions were severely curtailed. Yes, one could still contribute to a political party but the amounts were relatively small and no one could realistically purchase politicians as is done in the US. From my viewpoint this worked and Canadians owe the Liberals of that era a bit of recognition for their foresight.
Today, Herr Harper wants to undo that, commodify himself and stick a big “for sale to the highest bidder” sign on his forehead. Handing him a majority was collective mistake.
What helps Canadians is the fact that our population is more concentrated than in the US, most of the population lives in a few large metro areas. And our universal health care really makes life much less stressful.
Apart from health care, I am not sure Cdn entitlements are that better than in the US across the board. For example, the average Canadian retiring at age 65 collects about 6000$ in CPP and 6500$ in OAS for a total of 12500$. A housewife would only get OAS… so a lot of boomer women are going to get hit. They can supplement that with their own savings and if they have none, they can get a puny supplement based on poverty minimums. If they retire at 60, they’ll get CPP cut 30% and no OAS until 65.
Maternity benefits are much better here but I am not sure EI benefits are much better than in the US.
I am always amazed by how much more expensive everything is in Canada. Right now houses in Canada are double those in the US. There can be a price difference of 30% between the same car models. When I go to the US, I am always amazed by the amount of choice and the amount of stuff the lower classes can buy relative to Canada’s higher classes. Americans really do not appreciate to what extent they are bathing in material excess.
Inequality in Canada is currently close to US levels but masked by the bubble real estate where people are using their equity. When it bursts, many Canadians will be in shock.
Looking at net income says nothing. They should be looking at purchasing power or comparing people doing the same jobs
Canadian here, but raised in the US. I moved up here, it turns out, just when the tide turned and America’s middle class and regulatory environment began its long descent, around 1976. At that time there were already differences, though mostly in national mood and a default towards generosity in public policies, immigration and so on.
These days I would not move back to the US for any reason. Oh, Obamacare would clear up the health insurance problem, the single biggest obstacle financially, and I would need at least a part time job to make ends meet. Still, I could manage that.
But worse than the financial gulf is the gulf of sanity, goodwill, reasonableness and charity. Moving to the US would be like voluntarily moving into an asylum of dangerous lunatics.
Most Americans, most of the time, are perfectly amiable, kindly and sensible. Many are noble and admirable. But my God! every now and then some hot button issue or situation flips them into an irrational, often hateful mindset that cannot be discussed with any kind of clarity. I find myself suddenly sitting in a room of delusional warmongers, or people so determined to deny benefits to a few people they don’t even know, that they deny benefits for themselves, their friends and family too. And then there is the lack of shame as a force in public life.
And now, US-trained Canadian politicians are busy using the ideas and methods that have so weakened America to pull down the social structures that make Canada a better, if not perfect, country. Americans believe they lead the world, and in many ways this is true. I wish they would stop.
Noni
Having worked with Cdn bankers, I can tell you that they have been salivating at US banker compensation packages… so it’s not just politicians.
But 70% of Canadian households are just too happy to take on huge mortgage debt so these guys can keep on getting richer.
Good piece Joe.
As you suggest, it is very hard to do these measurements because it is very hard to measure informal claims on national wealth. Some countries have a public pension system in which worker contributions consist in the purchase of a kind of government bond. The value of these bonds counts an accounting liability of the national government, and an accounting asset of the individual who possesses it. That’s why a country like Japan has a very high public debt to GDP ratio. All of its pension obligations to its citizens are officially part of the national debt. And by the same token, all of those commitments are officially part of the wealth of Japanese citizens. I believe the same is true of Italy. In the US we don’t count the government’s Social Security commitments as part of the national debt or personal wealth.
Other important factors in the above: Australia has had double digit household savings rates over the past six years, and national income is much more evenly distributed, enabling households to accumulate wealth at a very high clip.
Excellent point, Dan. And one which bears further thought. Why does the U.S. refuse to guarantee its social benefit programs, treating them as potentially dischargeable off-balance sheet liabilities? Why does it refuse to bring these programs into compliance with ERISA best practices, including full funding and imposing a fiduciary obligation on the trustees?
U.S. debt is reported on both bases, gross (including debt held by trust funds) and net (debt held by the public). But overshadowing acknowledged debt is the large underfunding of promised benefits in all of the rich countries, a subject covered in a BIS working paper titled ‘The Future of Public Debt.’ (Hint: it ain’t bright).
http://www.bis.org/publ/work300.htm
Dan Kervick:In the US we don’t count the government’s Social Security commitments as part of the national debt or personal wealth.
That’s not really true. We pretend to pay SS out of the SS trust fund, and that is usually counted as part of the national debt, although it really shouldn’t be. Not counted as personal wealth though.
Jim Haygood:Why does the U.S. refuse to guarantee its social benefit programs, treating them as potentially dischargeable off-balance sheet liabilities? Why does it refuse to bring these programs into compliance with ERISA best practices, including full funding and imposing a fiduciary obligation on the trustees?
Because these practices make no sense whatsoever naively applied to the government, the country as a whole. The US government cannot guarantee its social benefit programs by financial means. It is logically impossible. (OK, it could save up foreign currency and use it to import wheelchairs in the future. That is just silly, but it makes more economic accounting sense than the suggestions above, which are exactly in the wrong direction. The only way the USA can guarantee any benefit programs is by sound economic management of the economy as a whole. And there is no way that the government can avoid managing the economy.
U.S. debt is reported on both bases, gross (including debt held by trust funds) and net (debt held by the public). But overshadowing acknowledged debt is the large underfunding of promised benefits in all of the rich countries, a subject covered in a BIS working paper titled ‘The Future of Public Debt.’ (Hint: it ain’t bright).
The implicit assumptions of such papers are gibberish, gibberish that insults the intelligence once their stupidity is understood – but unfortunately outside Kansas City and a few other monasteries preserving ancient science against a massive onslaught of modern nescience, correctly combining accounting and economics is a forgotten art. Everybody used to understand that public debt is money – that currency is public debt, but no more.
The trust fund is a government account that holds special-issue treasury liabilities, Calgacus. They are counted as liabilities of the treasury and assets of trust fund, and thus it nets out to zero and does not contribute to the national debt.
Yes, that is the way it should be done, but most of the time it isn’t.
There is something about the chart in the post that is troubling, which is how does Australia get there? A four fold multiple of the US middle class.
How is wealth defined? We have read that the housing market in Oz is quite bubbly. Are housing prices inflated by low interest rates and lending standards counted as wealth? It seems the answer is yes.
There is one huge difference between the US and every other country, that may account for the relative decline in wealth of the US middle class.
The US military, with it’s globe spanning bases, out of control techno fetishes and general resource destroying might has to be paid for by someone.
Glad you mentioned that. The U.S. economic model of spending 5% of GDP annually on world domination is broken. Britain, the former hegemonic power, used this model in the 19th century. The former USSR gave it a go until 1991. Both of these former world powers ended up shedding all their satellites.
Meanwhile the U.S. has been recruiting new satellites into NATO as fast as it can, and is in a snit over Russian interference with its latest candidate, Ukraine. Like the former USSR, the US presents a bristling facade of military might to the world. But back home, its domestic economy is a squalid shambles.
Since changing this paradigm isn’t even on the radar screen of the ruling Depublicrat party, we can assume that the U.S. will have to hit the wall and then implode chaotically, as the British and Soviet empires did.
Donkeys and yankees — you just have to crack their thick skulls with a 2 x 4 to teach ’em any damned thing.
You’re right. Americans are asked to shoulder this huge burdn of “protecting the global supply chain”.
Here is a pie chart on US military spending compared to other nations, and as a percentage of the Federal budget.
what we have to do can’t be done in three months, and we should have started doing it three years ago if we wanted to be ready now.
How about 30 years ago?
Imho, poverty (measured in xyz way, often summarily, shoddily, note it doesn’t necessarily correlate with well-being, education, etc.) is a fair indicator – particularly *child poverty.*
A tell-tale marker of how well a ‘society’ is doing.
OECD stats shows poverty rates, defined by income that is below half the median. The US is 32 (out of 35) with 17%, surpassed only by Mexico, Israel, Turkey.
Poverty rate overall has increased since mid 1980s, to end 2000s, but only a tiny tad, as measured in this way:
http://tinyurl.com/mrp599y
Of course this tells us nothing about the worsening conditions of those below the cut off. Or even those above.. (Purchasing power, cost of education, health care, working conditions, etc.)
Income growth and reduction of the poverty rate are not related, again, as tallied in this specific, peculiar, way. For example, Ireland had the most income growth in that time span, and at the same time the largest increase in its poverty rate.
http://tinyurl.com/n7rhj6v
Obviously, the Gini coefficient OECD-all (an indicator that is not terribly useful on its own) has jumped up:
http://www.oecd.org/social/inequality.htm
UNICEF ranking of 21 rich countries on child + adolescent poverty and well-being (as measured by several dimensions) puts the US at rank 20, with only UK a smidgen ‘worse.’
Note that being at risk for violence, as perp, victim, or observer, is not taken into account (mentioned in the paper), nor is ‘food’ (only ‘material’ well being), though both are crucial. Living in a stress-free, non-violent, safe environment and eating ‘properly’ (define as one wishes…) are the *sine qua non* of any child-teen development hopes, aims, etc. even before the ‘quality of schooling,’ ‘income’, ‘medical’ etc.
PDF:
http://www.unicef.org/media/files/ChildPovertyReport.pdf
NY Times reports US middle class falling behind world * — didn’t even take note that it works more hours (more hours per year, see graph **; more family members; more years) for its low pay!
* http://www.nytimes.com/2014/04/23/upshot/the-american-middle-class-is-no-longer-the-worlds-richest.html?_r=0
** http://economix.blogs.nytimes.com/2010/05/12/s-koreans-put-in-most-hours/?_php=true&_type=blogs&_r=0
This is caused by healthcare more than anything else. Perhaps somebody here can figure out the current “total lifetime cost of healthcare” in the US from this 2004 paper, which used 2000 figures.
http://www.ncbi.nlm.nih.gov/pmc/articles/PMC1361028/ It was $316,000 in the US in 2000 My guess is around half of whatever it is today is unnecessary, due to waste in the system, and would not be there under single payer. The raw figure is probably at least half a million per American now.
Medicine in the US is riddled with white collar crime. The arguments are old and can be found here: http://www.critcrim.org/redfeather/crime/011white.html
It would be interesting to see an argument based on living in an economy that had productive investment instead of the massive health, HE and bankster rip-offs.
The US is more ideological than Canada or nearly any other country so when the ideas are correct we prosper; when they are not, we suffer.
Obviously, currently, they are not correct so that even a mediocre (by design) country has surpassed us.
Yeah, what’s more mediocre than round bacon?
“Yeah, what’s more mediocre than round bacon?”
Oscar Mayer bacon. Because its Corporate Bacon(TM). Its been crapified. It is also a Uniqely American Phenomenon.
Buy hog bellies, Lambert, and cure and smoke your own!
I’ve done it for years–delicious, and can be done for about $4.00/lb.
That us really true, we certainly have an extremist/neoliberal ideology as shown by what they consider to be “trade barriers” in other countries. They target public interest policies that would be considered normal even here – to people who still don’t realize what’s happening.
Nearing sixty here. Been through three careers. Expect to be working till I drop.
Sensed this outcome coming on twenty years ago.
Too many structural problems not addressed.
A better understanding as the years roll on of human nature and motivations.
You’re all quibbling over the scraps, details– the main gist of this piece is that the much vaunted american middle-class is kaput. We’ve now got Piketty’s book, the NYT’s piece as part of the popular conversation. What are we going to do with it.
Three simple solutions to avoid violent uprising.
Remember the tax code is the instrument of policy!
1. Publicly finance elections.
2. Tax all income at the same rate, (earned and unearned).
3. Make “off-shoring” illegal.