By Philip Pilkington, a writer and research assistant at Kingston University in London. You can follow him on Twitter @pilkingtonphil. Originally published at Fixing the Economists
Just a short post this morning to highlight an interesting chart that I put together. Below I have mapped out year-on-year changes in wages against the unemployment rate.
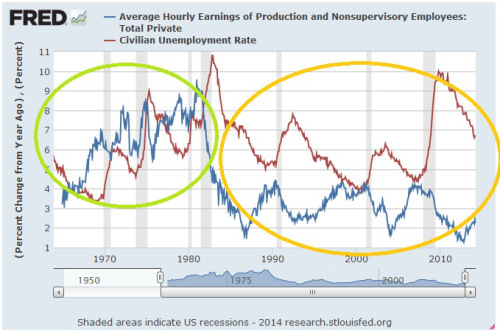 As we can see, in the period 1965-1981 (green circle) when unemployment went up wage-growth continued climbing regardless. However, in the period 1981-2013 (orange circle) whenever unemployment went up wage-growth slowed substantially. Indeed, in the second period we see a sort of “mirror-image” relationship.
This is not to say that after 1981 wages in the US became flexible — they do not fall when unemployment rises as silly variants of mainstream theory claim — but there is a strong negative correlation between unemployment and wage growth.
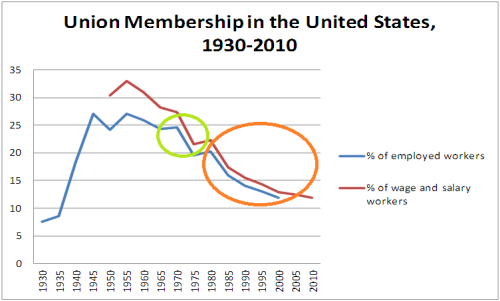
The reason, of course, is obvious. Union density has fallen substantially since the early 1980s as can be seen from the graph below.
 Everyone and their cat know this, of course. But I thought that the first chart was interesting indeed. It really shows the changes that have taken place in the US labour market since 1981 in a clear manner. Again, wages still grow as unemployment rises. But their acceleration does slow substantially.
Finally, let’s look at real wages — that is, wages adjusted for inflation — and how they relate to unemployment. We can see this in the graph I’ve put together below.
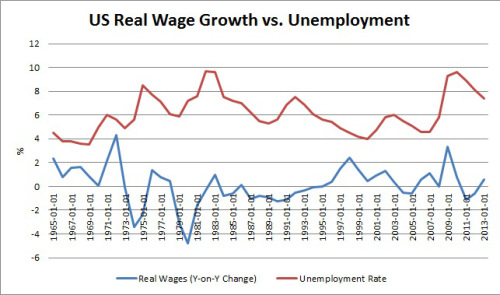 At first glance we see another “mirror-image” suggesting that there is a negative relationship between the two variables. This would seem to indicate that even in the period 1965-1981 wages fell when unemployment rose and vice versa. I would argue against this interpretation.
First of all, it is clear that until 1973 there was definitively no negative relationship between the two variables. Indeed, wages seemed to rise when unemployment rose — the opposite of what should theoretically happen in a flexible labour market.
Secondly, if you compare the chart mapping nominal wages against unemployment and the chart mapping real wages you’ll see that in the former when there is a negative correlation unemployment lags wages while in the second wages lag unemployment. What that means is that in the first chart there is a nice story — in the period 1981-2013 — that unemployment occurs and wages fall afterwards; thus indicating that unemployment might very well be the cause of the changes in wages. But in the chart mapping real wages this lag doesn’t exist in the period 1973-1981 at all.
Thirdly, if we look at the period 1975-1981 in the final chart above we see unemployment rising and real wages recovering from their trough.
The fact of the matter is that unemployment, when it does have an effect on wages, has an effect on nominal wages, not real wages. This is exactly what Keynes argued in the General Theory when he wrote,
But the other, more fundamental, objection, which we shall develop in the ensuing chapters, flows from our disputing the assumption that the general level of real wages is directly determined by the character of the wage bargain. In assuming that the wage bargain determines the real wage the classical school have slipt in an illicit assumption. For there may be no method available to labour as a whole whereby it can bring the general level of money-wages into conformity with the marginal disutility of the current volume of employment. There may exist no expedient by which labour as a whole can reduce its real wage to a given figure by making revised money bargains with the entrepreneurs. This will be our contention.
As macroeconomists it is nominal wages that should concern us when we do analysis and real wages that should concern us when we are interested in questions of policy.


As long as we continue to operate from the traditional laborcapital view of the universe we are going to get the same results. About the only way of changing things is a set of cooperative enterprises that take it away from our current lords and masters.
Linux took it away from Microsoft, and Android is a variation that has taken a large part of the market away from Apple. Especially in business, there is a kind of Karma that says that “as you sow. so shall you reap”.
I’m going to have to slightly disagree. The green circle can’t be directly compared, and even when you do, your conclusions isn’t quite accurate. There are three important factors – the initial level (rate) of UE before the rise, the extent and duration of the rise, and the ultimate peak. You can see that although this is a staggered upward trend through the green bubble, there is still a response of slower wage growth to rises in UE. But wages aren’t instantly alterable, much are under contract, so it takes time to make adjustments, even from 6% to 0%, eg. The durations here were short, so the downturns in wage growth were short, and then resumed. Plus, there is the duration issue of how long it takes to return to a more normal UE rate, when wages will start to rise again. Typically, we’re looking at 6+% before that happens. But we also have to factor in inflation in the first chart, as it is quite different in these two circles.
In the early 80s, it took five years to get UE back to around 6% before wages could start to rise, but then, inflation was low, and wage growth had had a lot of time to get completely pummeled. Since then, it’s hardly had very long runs of time heading lower from 6% to allow much of a wage growth increase before getting smacked down again.
I redid the first chart with inflation counted in. That was the third chart.
I don’t follow the rest of your argument (frankly, I can’t find one).
My issue is, inflation and unemployment were measured differently in the 1970s. Both, I believe, were measured in ways that showed them as higher than they would be measured today. Were you able to use the same standards for inflation and unemployment throughout the charts? I know this would be very hard to do, as the stats are deliberately different and recalculating may be beyond any one person’s ability to do without a grant to do nothing else for six months, but it is crucial to compare apples to apples as best one can.
Yes, but your first chart is totally misleading. Of course nominal wage growth is slower in the second bubble, as the inflation setting is totally different. You use the word “however” when you say that wage growth slowed substantially in the second circle, but it also slowed in the first circle when UE went up. My point is that the duration of these changes and the levels they started from and ended up are quite relevant to wage growth.
The argument is based on the idea that workers, as Keynes says, have no ability to bid up real wages only nominal wages. So, the first chart is not “misleading”. It is clearly labelled.
Nominal wage growth was not slowed in the first circle when unemployment went up. And real wage growth was all over the place.
Not disagreeing with Keynes. People dont think in terms of real wages, for the most part, but they do consider the need for nominal wage hikes more when they see inflation at 10%. But that still is not my point. Nominal wage WAS slowed in the first circle. Do you see a straight upward line or something? It quite clearly has a response to rising unemployment. But yet again, I stress that the durations of these movements were brief, and for much of it, the UE rate was low enough that job security wasnt strongly on people’s minds. In a labor market with high UE, and lots of job insecurity, you dont ask for a raise, more so when you know that if you lose your job, you will have a very difficult time finding another one.
What Im saying is that when UE comes back down to a more safe level quickly, as it does in the first circle, there isnt as much time for wages to adjust downward. The long slow declines in UE from higher levels in the second circle is a totally different job market reality.
It’s not about “thinking”. It’s that real wages are endogenous. A hike in nominal wages may lead to price rises that directly impact real wages.
As far as your interpretation of the nominal wage data from 1965-1981, I cannot help you to read a graph properly. So, read whatever you want as you gaze into the tea leaves. (A quick OLS regression gives an r-squared of 0.34 noting POSITIVE correlation, not negative, if that makes it easier for you to interpret).
Regarding time adjustment that’s rubbish. In the mid-1990s, the mid-2000s and post-2008 wages adjust almost INSTANTLY. There is no time lag. They adjust instantly. If your hypothesis that it takes time for wages to adjust downward we would see a substantial lag in these periods. We do not.
You’re quite the testy one.
No, it doesnt help me to show a 0.34 r2. One would not use a quick OLS to interpret that relationship. That you cannot see the deceleration in wage growth when UE is rising makes we wonder what is wrong with your eyesight.
You think the duration is irrelevant? Wow. Oooook.
The mid 90s came after the early 90s. The 92-95 period saw UE dropping from 8 to 6% with almost no change in nominal wage growth. Only after UE was below 6% did wage acceleration start. Was not instantaneous at all. In the mid 00s it was closer to instantaneous when UE began to fall because the rate was already at 6% when it headed lower. In 2008, yes they adjust almost INSTANTLY, but downward, not upward. And they dont adjust rapidly downward, they continue down while UE is rising. And then, if UE is high enough, they continue heading down even as UE falls, which was the 2010-2012 period.
So, go ahead and dismiss my point that the duration and level of UE are irrelevant, because you are obviously determined to project your inability to read a graph onto me.
So, you agree. In the period 1981-2014 when UE goes up wages go down almost instantaneously. But this does not happen in the period 1965-1981. Therefore, the latter period is obviously different. There must be something stopping the downward adjustment. Duh!
You’re not exactly a wizard at these causal inference arguments, are you?
I dont agree, in that there is most of the time (save for around 1975) a deceleration (or going down as you deem it) of wage growth in response to a rise in UE.
1970, UE starts to rise, wage deceleration ensues.
1974, UE starts to rise, and for a time, wages, rise, then with a further rise in UE, the decleration kicks in sharply. I dont profess to know the reason that wages initially rose, but it could be tied to contracts, or tied to inflation in some way. Id have to investigate. But the period was brief, and doesnt invalidate the point that once UE kept rising, wage deceleration ensued.
1978, UE rises, wage deceleration starts immediately. But the rise in UE is brief and modest, and when it start to decline, briefly, wages go back up, but only for a moment before 1981 when UE shoots up and wage deceleration kicks in strongly.
Thus, there isnt much distinction at all between the two circles. The important point is that wage growth accelerates not when UE is falling, but when it is falling past a certain level. The levels are quite different in the two circles, as are the inflation environments, so they arent quite comparable.
Your method of discourse is somewhat disrespectful and dickish, btw, in case no one has pointed it out to you.
I’ll let others consider the arguments as they have been laid out. If you can’t see the difference between the periods 1965-1981 and 1981-2014 (despite the fact that we’ve [I’ve!] gone through the data breakdown AND run OLS regressions) then I suggest you stay away from jobs that involve data analysis.
You clearly missed the lecture in Econometrics 101 on specification error. And you also don’t seem to want to believe that the level of UE is relevant to the behavior of nominal wages (along with the inflation rate, which perhaps you do understand.)
Ooops, sorry. In a rush. Wrote down the wrong variables.
A regression for 1965-1980 shows that for every 1% increase in unemployment we will see a 0.54% INCREASE in nominal wages.
A regression for 1981-2014 shows that for every 1% increase in unemployment we will see a 0.38% DECREASE in nominal wages.
I dont dispute your simple OLS numbers and what you want to infer from them, but it oversimplifies the reality, and is a poor model.
So, my eyeballs are telling me that in Period 1 wages and UE are positively correlated and in Period 2 they are negatively correlated. This is confirmed by a simple OLS regression. But you still deny it. Fair enough. I doubt anyone will find your argument remotely credible. But you’re free to make it.
Wages are growing the entire period, so yes, they’ll look positively correlated. But a deceleration in wage growth is what occurs when UE rises, so the rate of change is negatively correlated with the UE rate, in terms of direction of UE rate change. But the absolute level is important as well.
The same relationship holds in the second circle. The issue Im bringing up is that the change in wage growth rates is dependent upon the level of UE.
Maybe the following graph tells the story better:
http://bit.ly/1noJKFY
Here’s the story.
(Dec 1969-Dec 1970) UE rises from 3.5% to 6.1%. Wages briefly decelerate but then pick up pace again in Oct 1970. This is despite the fact that unemployment does not fall. WAGES ACCELERATE DESPITE THE FACT THAT UNEMPLOYMENT IS AT A HIGH LEVEL.
(Oct 1972-Oct 1973) UE falls from 5.6% to 4.6%. Wages decelerate substantially. WAGES DECELERATE DESPITE THE FACT THAT UNEMPLOYMENT IS FALLING.
(Jan 1974-Feb 1975) UE rises substantially from 5.1% to 8.1%. Wages continue to rise, only decelerating between Mar 1975 and Oct 1975. WE SEE SOME NEGATIVE CORRELATION BUT IT IS WEAK IN COMPARISON TO THE DATA FROM THE LATER PERIOD.
(Sept 1977-Jan 1980) Here we actually do start seeing the trend emerge of an actual negative correlation. NOTE HOW DIFFERENT IT LOOKS FROM THE REST OF THE TIME-SERIES.
Wages were low in the 70’s because jobs were hard to find. As I recall, there was a recession, technically or not. When you were offered a job, you took the salary offered so as to not lose the offer. The 80’s may have seen a productivity rise. Wages may have risen. But so did hours worked making effective wages decrease. It was the start of the 24/7 work week. Productivity went up because employers did not hire as many as really needed. We were few people doing the same quantity of work or more but with fewer people. This was the start of the effort of the now politically empowered conservatives to reduce labor costs by working the employees longer and harder. These observable economic outcomes were the result of the political will of the ‘conservatives’. They were conscious decisions and not the magic of the market.
It’s too hard for me to draw any conclusions from the final chart just by eyeballing peaks and troughs. One thing that does appear to show up is that during the period 1992-98, there is steadily falling unemployment with a concurrent steady increase in the rate of wage growth. Also form about 2002 to 2007, the changes again seem closely correlated.
As I understand it, the issue Keynes was raising in the cited paragraph was the potential impact of deflation on wage movements. Labor might, in the aggregate, negotiate an overall reduction in the money value of wages, but the change might not result in an overall reduction in real wages since the decrease in nominal spending brought on by the decrease in nominal wages might trigger deflation – as occurred during the 1929-32 period, a period still fresh in the minds of Keynes and his original readership. But this divergence between the direction of nominal wages and real wages can only happen during a period of deflation. In an environment with even modest price inflation, then a reduction in money wages mustcorrespond to a reduction in real wages. Since the period covered by all of these charts saw varying rates of inflation throughout, I don’t know how to apply Keynes’s observation to it.
It’s simple. If Keynes is correct then any correlation between unemployment and real wages should (in an environment where workers do not have substantial bargaining power) be far weaker and more difficult to discern than the correlation between unemployment and nominal wages.
In short, if Keynes is correct the correlation in the period 1981-2014 in Chart 3 should be far messier than the correlation in the same period in Chart 1. Of course, this is exactly the case.
That’s fine, Philip. I like that way of stating it better than the more blanket statement that unemployment does not have an effect on real wages.
That’s not what I meant. I meant that you will not detect direct effects from unemployment => real wages because this can lead to price changes that negate the effect. However, you might well detect a direct effect from unemployment => nominal wages.
In that sense, unemployment will not have an effect on real wages. Because it affects both the numerator (nominal wages) and the denominator (prices).
I know that computers aren’t exactly a new thing, but still, it seems to me that since the ways they are being used keeps becoming a better and better approximation of what a worker might do, that there should be some application of that fact into the economic formulae which might explain otherwise inexlicable phenomena in current economics.
If financial calculations don’t have any means of representing the non-human (computer-based) “workers” (of all kinds) being gradually integrated into the economy then (IMO) thats a major failing.
It would be best to think of them as workers who keep improving very quickly who oftentimes cost much less than people.
The perfect example would be the web e-commerce application. Certainly, there are jobs created building and maintaining the e-commerce applications, and they pay well, but the number of workers required to do that is quite modest compared to the number of workers staffing brick and mortar stores that were unable to secure a niche – who are gradually being replaced by them.
when you can print irrelevant of wealth creation, bad stuff happens…
all unions are now government unions…
there is no private sector…
the Fed sets RE inflation and Congress sets wages.
Inequality is a function of wage and price control, by morons.
having worked for most of the unions, I find it quite ironic that they keep getting trotted out as the problem solution, despite all the data to the contrary.
don’t get me wrong; apprenticeships are much more effective than college, but burcats couldn’t find a needle in a sewing box.
like everything else, real unions were replaced in a bait and swap.