Yves here. Even with the wild end-of-day rally yesterday, Steve Roth describes how absent a strong continuation of the snapback, real household net worth is likely to show a year-to-year fall by the end of September. And that’s not a good sign at all.
By Steve Roth, a serial entrepreneur whose businesses have ranged from book and magazine publishing to high-tech professional conferences to corporate services. His publications include “Capital in the American Economy Since 1930: Kuznets Revisited,” an appendix to James Livingston’s Against Thrift: Why Consumer Culture is Good for the Economy, the Environment, and Your Soul. Cross posted from Angry Bear
In my last post I pointed out that over the last half century, every time the year-over-year change in Real Household Net Worth went negative (real household wealth decreased), a recession had either started, or was about to. (One bare exception: a tiny decline in Q4 2011, which looks rather like turbulence following The Big Whatever.) Throughout, click for source.
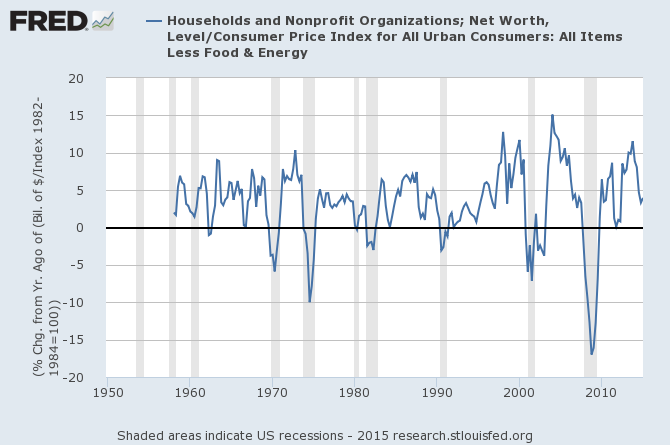
The problem: we don’t see this quarterly number until three+ months after the end of a quarter, when the Fed releases its Z.1 report for the the preceding quarter. The Q2 2015 report is due September 18.
But right now we might be able to roughly predict what we’re going to see four+ months from now, in the report on our current quarter, Q3, which ends September 30. We’re a bit over a month from the end the quarter, and we have some numbers to hand.
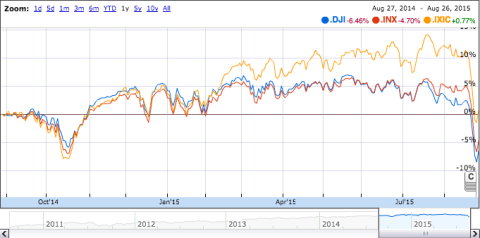
The U.S. equity markets are down roughly 7% year-over-year (click for source):
Total U.S. equities market cap one year ago was about $20 trillion:
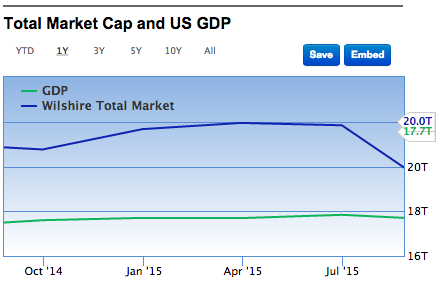
So a 7% equity decline translates to a $1.4-trillion hit to total market cap, which goes straight to the lefthand (asset) side of household balance sheets, because households ultimately own all corporate equity — firms issue equity, and households own it (at one or more removes); people don’t issue equity in themselves, and firms don’t own people (at least not yet). It’s an asymmetrical, one-way ownership relationship. (Note: yes, the Fed accounts for household net worth on a mark-to-market basis.)
Total household net worth a year ago was $82 trillion. The $1.4 trillion equity decline translates to a 1.7% decline in household net worth.
Meanwhile household liabilities over the last four quarters have been growing at a fairly steady rate just above 0.2% per year. There’s no reason to expect a big difference in Q3.
This suggests a 1.9% decline in household net worth over the last year, based on the equity markets alone. (My gentle readers are encouraged to add numbers for real estate and fixed-income assets.) Add (subtract) 1.5% in inflation over that period, and you’re looking at something like 3.4% decline in real household net worth, year over year.
Unless the stock market rallies by 10% or 15% before the end of September ($2–3 trillion, or 2.5–3.5% of $80 trillion net worth), it’s likely we’ll see a negative print for year-over-year change in real household net worth when the Fed releases its Z.1 in early December of this year. And we know what that means — or at least we know what it’s meant over the last half century.
You heard it here first…
Cross-posted at Asymptosis.

