By Arthur. Berman, a petroleum geologist with 36 years of oil and gas industry experience. He is an expert on U.S. shale plays and is currently consulting for several E&P companies and capital groups in the energy sector. Originally published at OilPrice
U.S. rig counts have surged as oil prices sink. Capital is driving the oil markets and it enables bad behavior by producers. That is why oil prices will stay low.
The oil-price rally that began in February is over. Prices rose from $26 per barrel to $51 by early June and are now below $42 (Figure 1). If they fall through $40, the next likely support level is at $36 per barrel.
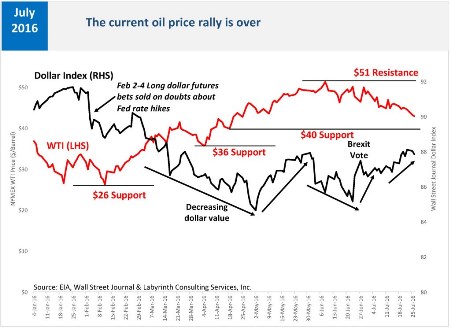
Figure 1. The current oil-price rally is over. Source: EIA, Wall Street Journal and Labyrinth Consulting Services, Inc.
Capital Drives The Oil Market and Prices
Most people think that fundamentals–supply and demand–drive the oil market but capital drives the market and oil prices.
More than anything, rig count reflects capital flow. Many believe that oil prices drive the rig count but it is really capital flow that drives rig count and production and that affects oil prices.
When oil prices fall and oil-price volatility increases, the floodgates of capital open. Every genius-investor wants to buy low and sell high. Rig count rises with fresh capital, production increases and oil prices fall (Figure 2). The weekly change in tight oil horizontal rig count is the leading indicator of capital expenditures. Price trends roughly follow the inverse path.
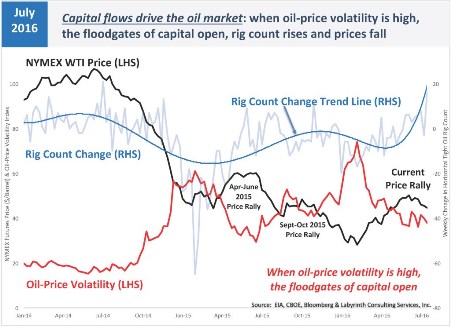
Figure 2. Capital flows drive the oil market. Source: EIA, CBOE, Bloomberg and Labyrinth Consulting Services, Inc.
When oil prices were around $100 per barrel in mid-2014, oil-price volatility was low. When prices fell below $90 per barrel in October 2014, oil-price volatility began to increase. When prices bottomed below $46 in January 2015, volatility peaked. Correctly believing that a price floor had been reached, investors poured capital into the markets and oil companies were flush with money to start drilling again. Prices rose to $60 per barrel by May 2015.
As drilling proceeded, oil-prices began to fall as market confidence in a price recovery faded. In July 2015, prices began to fall. As they fell to near $40 per barrel by late August, price volatility increased again. Investors saw another price floor and opened their wallets.
Prices rose 18 percent to more than $48 by early October but by then, confidence in a price recovery again faded with increased drilling and global economic concerns about Chinese growth and oil demand. Oil prices fell below $30 in late January 2016 and by mid-February, oil-price volatility reached its highest level since the Financial Collapse in November 2008.
Once again, investors saw a price floor and the floodgates of capital opened. Pioneer and Diamondback raised almost $1.5 billion in share offerings in January 2016, probably the darkest time for oil markets since 1998.
In the first half of 2016, more capital has flowed to E&P companies than during 2013, the previous record year when oil prices were more than $100 per barrel and the tight oil boom was in full bloom (Figure 3).
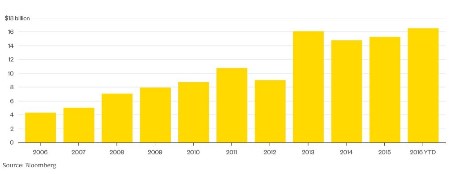
Figure 3. U.S. E&P companies have sold more stock so far this year than in the whole of the record year of 2013, when oil averaged almost $100 a barrel. Source: Bloomberg.
Rig Count Surges and Oil Prices Fall
During the current price rally, prices increased from $26 in mid-February to more than $51 per barrel by early June. Meanwhile, the rig count change rate has exploded (Figure 2). Predictably, oil prices have fallen below $42 per barrel as hopes for a price recovery fade once again. This repeating process qualifies under the standard definition of insanity – namely, continuing to do the same thing that got you in trouble before.
66 land rigs and 47 tight oil horizontal rigs have been added since early June (Figures 4 and 5). Last week, prices were crashing but 18 rigs were added, the biggest increase in almost 2 years.
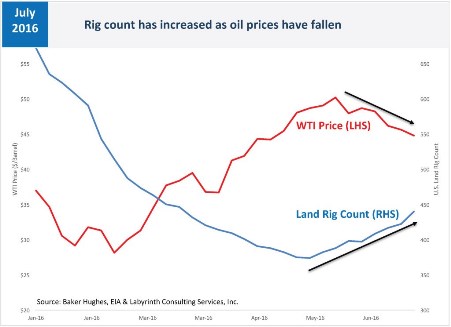
Figure 4. Rig count has increased as oil prices have fallen. Source: Baker Hughes, EIA and Labyrinth Consulting Services, Inc.
Those added rigs, however, resulted from decisions and a process that began weeks or even months ago. After a company decides to add a rig, negotiations follow. More time passes between signing a contract and a rig showing up on location. Empirically, there is about a 5-week lag between changes in price trends and a response in rig count (Figure 5).
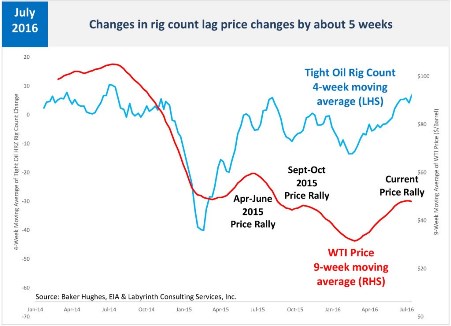
Figure 5. Changes in rig count lag price-trend changes by about five weeks. Source: Baker Hughes, EIA and Labyrinth Consulting Services, Inc.
Who Are Those Guys?
Which companies are adding rigs and do their financial results support more drilling at these oil prices?
About 60 percent of rigs added in the tight oil plays during the last few months are in the Permian basin where there are currently 145 rigs operating (Figure 6). The rest of the new drilling is fairly evenly spread among the Bakken, Eagle Ford, Niobrara, Mississippi Lime and Granite Wash plays.
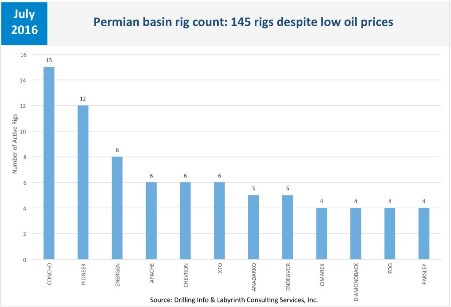
Figure 6. Permian basin rig count: 145 rigs despite low oil prices. Source: Drilling Info and Labyrinth Consulting Services, Inc.
The most active operators in the 3 most-productive plays–the Permian, Bakken and Eagle Ford–are shown in the table below.
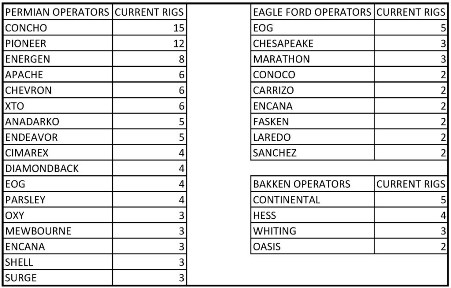
Table 1. Leading tight oil rig operators for the week ending July 22, 2016. Source: Drilling Info and Labyrinth Consulting Services, Inc.
In the Permian basin, Concho Oil & Gas currently operates 15 rigs, Pioneer Natural Resources operates 12 rigs, and Energen operates 8. Apache, Chevron and XTO each operate 6 rigs, and Anadarko and Endeavor each operate 5. Cimarex, Diamondback, EOG and Parsley all operate 4 rigs.
The most active operator in the Eagle Ford play is EOG with 5 rigs. EOG is followed by Chesapeake and Marathon each with 3 rigs. In the Bakken, Continental Resources is the leading operator with 5 rigs. Hess operates 4 rigs, Whiting operates 3 and Oasis, 2 rigs.
So how are these operators doing financially?
Terribly, despite preposterous stories of technology gains, costs approaching zero, and single-well EURs of 1 million barrels of oil equivalent.
Figure 7 shows the main rig operators in the Permian, Bakken and Eagle Ford plays. These companies spent an average of 4 times as much as they earned in the first quarter of 2016. And it’s been going on for years. Imagine doing that yourself.
Among Permian operators, Parsley spent more than 10 times cash flow and Energen, more than 6. Pioneer and Chevron spent 5 times more than they earned. Anadarko had negative cash from operations meaning that it didn’t even earn enough to pay for well operations.
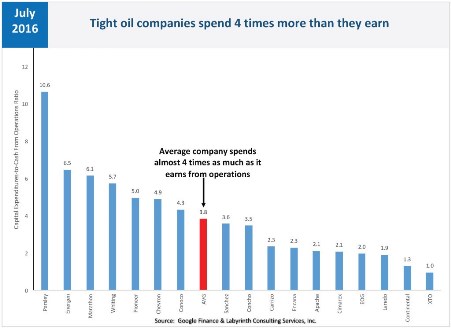
Figure 7. Tight oil companies spend 4 times more than they earn. Source: Google Finance and Labyrinth Consulting Services, Inc.
EOG leads the drilling in the Eagle Ford play and only spends twice what it earns–among the best of a bad lot. Marathon, on the other hand, outspends earnings by more than 6-to-1 and ConocoPhillips is not much better at more than 4-to-1. Like Anadarko, Chesapeake has negative cash from operations and, therefore, does not appear in Figure 4.
In the Bakken play, Hess cannot even pay for well operations from its cash flow yet operates 5 rigs. Continental Resources leads Bakken drilling and has a respectable capex-to-cash flow ratio only spending $1.30 for every dollar it earns. Whiting outspends cash flow by almost 6-to-1 and Oasis has negative cash from operations.
The debt picture is equally grim.
It would take top tight oil rig operators an average of 10 years to pay off debt if all cash earned from oil and gas sales were exclusively for that purpose based on first quarter 2016 financial data–in other words, no drilling, no salaries, no nothing except debt payments (Figure 8). That’s way above standard tolerance for this critical measure of bank risk which is now about 4:1 but before 2012, it was closer to 2:1.

Figure 8. Tight oil companies would take 10 years to off debt using all cash from operations. Source: Google Finance and Labyrinth Consulting Services, Inc.
In the Permian basin, most operators have a debt-to-cash flow ratio of about 6:1 or 7:1. Chevron and Pioneer are much higher at 9.3:1 and 8.2:1, respectively. It would take Apache 8 years to pay off its debt and 7.4 years for Concho. Cimarex is somewhat lower at 4.4 years and not surprisingly XTO (ExxonMobil) is at 2.2 years.
In the Eagle Ford play, EOG has more debt than it could pay off in 6 years and Marathon has a stunning debt-to-cash flow ratio of almost 25! Conoco is not far behind at almost 18-to-one.
In the Bakken play, Continental would need 6 years to pay off its debt but Whiting leads all major tight oil players with a debt-to-cash flow ratio of 29-to-1!
Meanwhile, these companies tell investors tall tales of fantastic rates of return even at low oil prices that clearly do not pass even a superficial fact check using Google Finance or Yahoo Finance. Why would any rational investor give money to most of these companies?
Short-Term Price Spikes In a Few Years
There is an important difference between oil supply and reserves. Supply is available on demand and reserves require long-term, capital-intensive investment to develop.
Tight oil is really a supply project because reserves can become supply one well at a time. Tight oil development can be turned on or off at will as prices rise and fall because at-risk capital is incremental–basically the cost of the number of wells in a rig contract.
While tight oil supply has overwhelmed markets in recent years, remaining reserves are relatively small–a few tens of billions of barrels–compared with true reserve projects like conventional and deep-water oil or oil sands that involve hundreds of billions of barrels. True reserve projects have been largely deferred because of uncertainty about how long low prices will continue.
The insane cycling of oil prices will continue as long as tight oil production keeps the market in a supply surplus. At some time in the next few years, the market will go into deficit as deferred investment in reserve projects comes back to haunt us. Then, inventories will finally be drawn down to 5-year average levels and prices will probably spike.
If that happens, it is likely that prices may go well above $90 per barrel. This may last for a year or somewhat longer based on what occurred in 1979-1981 (27 months), 2007-2008 (13 months) and 2010-2014 (48 months) when prices were more than $90 per barrel. Then, demand destruction will set in and prices will fall. Because the global economy is so much weaker now than during those past periods of high oil prices, I suspect that it will only take a few months to a year before prices fall hard.
Lower Prices Ahead
The current oil-price rally led many to believe that a full price recovery was underway. But inventories have been too large for that to happen short of epic supply interruptions. Current OECD inventories stand at 3.1 billion barrels and untold millions of barrels in places like China and Russia that do not report storage volumes.
In mid-April, I cautioned:
Two previous price rallies ended badly because they had little basis in market-balance fundamentals. The current rally will probably fail for the same reason.
You don’t have to be a genius to figure this stuff out. Attention to data and recent history is all it takes.
So, why do producers misread price signals so badly and act in ways that lower prices and hurt their own businesses?
They can’t help themselves. Give them money and they will spend it. That’s what E&P companies do.
The cost of credit dictates the precedence of cash flow over common sense even as more debt and the growing burden of debt service dictate even more production to meet new cash flow demands.
It is a vicious cycle that cannot be broken unless the capital stays away. That has not happened because other options for similar yields at acceptable levels of risk cannot be found. And so it continues.
The longer companies continue to produce at a loss and make absurd claims that they are making money at low prices, the more that investors believe them. The market graciously obliges by shorting oil prices.
I see no graceful way out of all of this.


Those debt figures are astonishing. You can only wonder what how much wealth is going to vanish when theirs game of musical chairs stops. It will surely be a big enough sum to do serious economic damage that will impact far beyond oil States. Yet another mess for the next Pres to clean up (lol).
Berman touches on this tangentially, but in the longer term it will become a serious issue that there has been a huge retrenchment in investments in conventional oil and gas while billions has been thrown at unconventional. This could well lead to a significant supply shortfall in the longer (10 year plus) time scale which could leave the world very short on liquid fuels – we can just hope by then that renewables are up to scale. Of course, if the vast sums thrown at fracking had been put into solar and wind and storage instead, that would be a near certainty.
“Those debt figures are astonishing.”
Since interest rates are so low, I imagine that the cost of debt service is pretty small despite the large total quantity of debt.
I’m not sure how I feel about this analyst. He says rig counts lead oil price. But he only uses a six month time series to prove his point.(figure 4) A Tyler over at zerohedge makes a pretty strong argument for the opposite case( that rig counts follow price) using the same plot on a 2.5 year time frame.
http://www.zerohedge.com/news/2016-07-29/us-oil-rig-count-rises-fastest-rate-jan-2010
These borrowers are all junk credits, so you’d look at junk bonds as the proxy. So the rates aren’t that low. Moreover, many are dependent on bank loans. I recall someone saying that a lot of banks were up to renew the lines in March 2015 and indeed, you saw some bankruptcies in the following months as the lines were not renewed or were reduced.
The real wealth destruction here beggers the imagination. A production system only capable of producing by destroying ecology at scale is being force fed money to accelerate ecological destruction to what aim? Who is benefitting? Are the owners of these companies allowed to cash out leaving an LLC to vanish into bankruptcy, making these criminals whole?
I’d say this is the result of allowing too much money to stay in too few hands. They have no idea what to do with it, so they throw it at boondoggles like this. When capital flows overwhelm supply and demand signals, even brain-dead neoclassical economists have to admit that something is radically wrong.
We don’t need bubble-blowing investment schemes. We need broad-based affluence and increased wages (especially at the bottom).
Really good point, jsn. Methane blowout and toxic aquifers and that’s just on the front end. A giant maw, a perverse Anglerfish whose glowing lure is “we’ve hit bottom!”
while i dont disagree with Berman’s conclusion or anythng he’s written here, Brexit was what broke the oil price runup from $26 to $51…markets went haywire for a few weeks, and by then the oil rally had been broken…fundamentals are now driving prices lower…
My brother in law was forcibly retired from Schlumberger after more than 25 years as a toolpusher last January. He worked both the Permian and Eagle Ford and had a lot of insight about what was going to happen and is still happening.
In a nutshell, the old guys have seen this all before and the common thread is that the bust this time will be epic. Schlumberger started laying off more than 2 years ago as they saw the glut coming. The rig operators will keep drilling as long as the stupid banks keep lending. It’s what they do. I’m reminded of Chuck Prince’s famous remark about dancing as long as the music is playing.
“It is a vicious cycle that cannot be broken unless the capital stays away.” Pretty much says it all.
Yes – an issue I’d have with the headline is that the ‘oil industry’ to a large extent doesn’t care about the oil – its profit lies in persuading investors to keep the money rolling (in particular, the exploration and services sectors). I suspect this bust will be worse than most simply because the stupid cash has been rolling in for longer than in previous pre-busts. Reading some oil market reports its clear there is an enormous amount of delusion going on. Investors have persuaded themselves that the drop was cyclical, and that an upsurge in prices is ‘inevitable’. They are ignoring the fundamentals.
weinerdog,
As you say, layoffs began more than 2 years ago; so did cutbacks in capital expenditure. It was clear what was coming. The old hands have been through this before, as in the 1980s, but there’s an additional factor now: The crash then led to a drop in students entering programs for petroleum engineering and geology–the students who would now be in middle management, and who would be experienced and able to help steer the oil patch through the current downturn.
Senior management and experienced field workers are retiring (those who still have jobs), and those top managers have been pushing for production not profits because production is what bonuses are based on and what Wall Street likes to see in order to invest. They’ll go away happy. What’s missing is that middle layer of management with experience, the ones who would move up. This is known in the oil patch, of course, and has been for a good long time. Tomorrow?–someone else’s problem.
I smell regulatory forbearance …
…and something a little more disconcerting …
http://cassandralegacy.blogspot.ca/2016/07/some-reflections-on-twilight-of-oil-age.html
Wow. Looks like past assumption that oil prices will remain high deluded companies into drilling high cost oil wells in the same way assuming housing prices would always go up previously burned the mortgage market. It’s pretty clear that falling oil prices are related to worldwide supply (highest level in history), and worldwide demand (slowing corporate profits, and BRIC economic slowdown) forces. That said, I wonder how much of the price decline can be attributed to the current high volume of worldwide oil smuggling (ISIS Iraq oil, ISIS Syria oil, ISIS Libya oil, Venezuela gasoline/fuel oil, and Nigeria oil). Smuggled goods have almost no cost, so any sale price is profitable.
The bears are back — and the sky is falling on the oil patch!
Actually, if you visit this handy sector fund tracker and select a “1Y” timeframe, it shows that the energy sector is down a harrowing … wait for it … -2.66% over the past year.
Two words, Art Berman: mean reversion.