Yves here. While the recent trend in foreclosures looks alarming, it appears that servicers are making a push to clear out what they regard as old inventory, even though it appears to be include defaults that started after the crisis. One has to note cynically that they waited to the tail end of the Obama administration to act. Did servicers hope that their move would not get much notice from the press, given all the election noise, and hence little to no pushback from politicians in the affected cities and states. Here is one take, from DSNews:
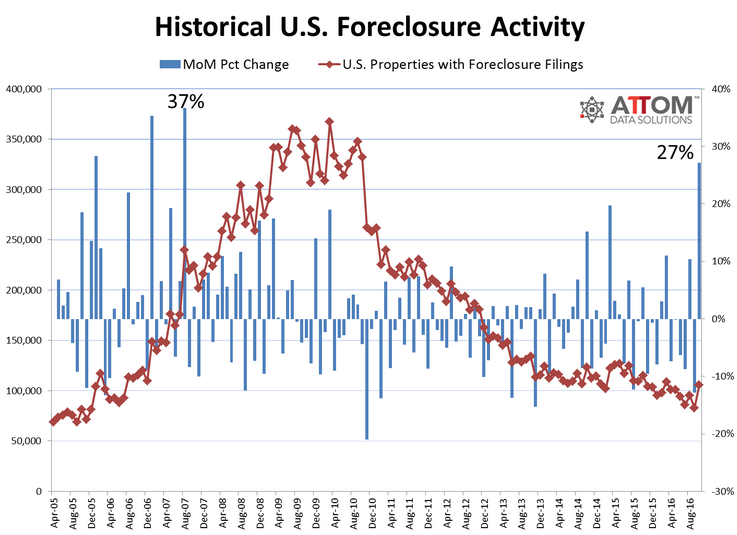
October foreclosure filings increased 27 percent from the previous month after experiencing a 129-month low in September, according to the latest U.S. Foreclosure Market Report from ATTOM Data Solutions.
Despite increases month-over-month in foreclosure starts, bank repossessions (REO), and scheduled foreclosure auctions, these trends including total foreclosure filings still saw a marginal decline year-over-year.
“Part of this could be tied somewhat to the election with lenders holding back for the last few months as there are uncertainty around the election,” says Daren Blomquist, SVP of ATTOM Data Solutions. “Even though they didn’t know the outcome in October when we saw this activity take place, there was probably a lot of certainty thinking that Clinton would win. I think with this certainty, lenders went ahead and pushed through more foreclosures.”
By Wolf Richter, a San Francisco based executive, entrepreneur, start up specialist, and author, with extensive international work experience. Originally published at Wolf Street
The total number of homes with foreclosure filings jumped 27% in October from September, when they’d been at the lowest level since 2006. It was the biggest jump in monthly foreclosure filings since August 2007.
Compared to October last year, homes with foreclosure filings still decreased, but this nationwide decrease is covering up what is now happening in 28 states and Washington D.C., according to the Foreclosure Report by ATTOM Data Solutions. There, the inventory of homes with foreclosure filings is beginning to rise even on a year-over year basis. And in some states it soared year-over-year:
- Colorado +64%
- Georgia +22%
- Pennsylvania +20%
- Arizona +17%
- Virginia +15%
- Massachusetts +11%
- New York +10%
When home prices rise for years, foreclosure filings become rare because defaulting homeowners can usually sell the home for more than they owe and pay off the mortgage. The problem arises when home prices fail to rise locally, and it balloons when home prices fall. We’ve seen that last time around. After bouncing along super low levels during Housing Bubble 1 through 2005, foreclosure filings skyrocketed during the housing crash starting in 2006. At first it was just an uptick that no one paid attention to. By 2008, it helped take down the financial system.
Foreclosure filings peaked in late 2009, began dropping in 2010, and then tapered down to 2006 levels as foreclosures were processed, and as the home price surge of Housing Bubble 2 made new defaults less likely. But the spike in October stands out as much as those in the early phases of the housing bust in 2006 and 2007. Note the blue bar on the right:
While some states are still trying to digest the foreclosures from the last housing crisis, according to Daren Blomquist, senior VP at ATTOM, “the foreclosure activity increases in states such as Arizona, Colorado and Georgia are more heavily tied to loans originated since 2009”:
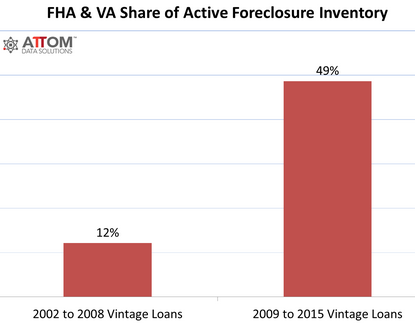
“The loans used in this housing recovery that appear to be most susceptible to foreclosure are those such as FHA and VA with low down payments. Our data shows FHA and VA loans combined represent 49% of all active foreclosure inventory for loans originated in the seven years ending in 2015.”
This chart shows the soaring proportion of FHA and VA mortgages issued since 2009 among the active foreclosure inventory.
On average across the nation, the foreclosure rate was one foreclosure filing for every 1,258 housing units. But in some states, the foreclosure rate was much worse. Here are the “top” ten:
- Delaware: one in every 355 housing units
- New Jersey: one in every 564 housing units
- Maryland: one in every 679 housing units
- Illinois: one in every 704 housing units
- South Carolina: one in every 801 housing units
- Nevada: one in every 826 housing units
- Florida: one in every 895 housing
- Ohio: one in every 930 housing units
- Pennsylvania: one in every 1,018 housing units
- Georgia: one in every 1,028 housing units.
And here are the “top” ten highest foreclosure rates among the 216 metropolitan areas with a population of over 200,000:
- York-Hanover, PA: one in every 274 housing units
- Atlantic City, NJ: one in every 301 housing units
- Rockford, IL: one in every 481 housing units
- Columbia, SC: one in every 498 housing units
- Trenton, NJ: one in every 499 housing units.
- Reading, PA: one in every 542 housing units
- Chicago, IL: one in every 571 housing units
- Dayton, OH: one in every 573 housing units
- Philadelphia, PA: one in every 597 housing units
- Salisbury, MD: one in every 625 housing units.
These “foreclosure filings” are based on data that ATTOM gathered in 2,200 counties where over 90% of the US population lives. They include data on the three phases of foreclosure:
- Foreclosure starts: lender issues Notice of Default (NOD) and Lis Pendens (LIS)
- Auction notices for future public foreclosure auctions: Notice of Trustee’s Sale (NTS) and Notice of Foreclosure Sale (NFS);
- Real Estate Owned (REO) properties that have been foreclosed on and were repurchased by a bank at auction and are now held by the bank.
Broken down based on these three phases of the foreclosure process:
Foreclosure starts jumped 25% in October from the prior month, to 43,352. While still down 11% year-over-year, it was the highest monthly increase in foreclosure starts since December 2008.
Foreclosure starts increased even year-over-year in 23 states and Washington D.C. In some states they soared. The “top” five:
- Colorado +71%
- Arizona +48%
- Ohio +34%
- New York +15%
- Virginia +15
Auction notices jumped 30% from the prior month to 43,815 (in some states, these are foreclosure starts), the biggest monthly increase since January 2006. While still down 6% year-over-year nationally, auction notices rose year-over-year in 25 states and Washington D.C. The “top” five:
- Pennsylvania +66%
- Indiana +37%
- Illinois +34%
- New York +12%
- New Jersey +6%
Bank repossessions (REO) jumped 25% from the prior month to 34,288 homes, the biggest monthly increase since July 2015. While REOs were still down 6% year-over-year nationally, they increased in 22 states and Washington D.C. The “top” five:
- Massachusetts +104%
- Georgia +53%
- Wisconsin +45%
- Texas +38%
- Virginia +17%
The fact that mortgages issued since 2009 are now seeing rising defaults again is worrisome enough. It’s doubly concerning that 49% of these foreclosure filings are on homes with low-down-payment mortgages backed by the FHA and VA and issued since 2009. Recall that low-down-payment mortgages played a big role in the last housing collapse.
ATTOM VP Blomquist tries to remain sanguine: “The increase in October isn’t enough evidence to indicate a new foreclosure crisis emerging in these states, but it certainly demonstrates that this housing recovery is not completely devoid of risk.”
So take this as an early red flag, the kind you might have seen in 2006 when no one paid attention to red flags in the housing market.
Some of the same characters that played leading roles during the last housing bubble and bust are back in their full glory. Read… Housing Bust 2? Low- and No-Down-Payment Mortgages Surge, “Shadow Banks” Dominate


This has been covered elsewhere as to the reason: Rate resets.
All those HELOCS in 05′-08′ et al. are now hitting their 10-year grace periods. Now homeowners are seeing these payments double. Take a look at the plunge in home ownership across the country, it’s everywhere.
Since the early 1960s, the American homeownership rate has fluctuated within a narrow range — 62% to 65% of households. During Bubble 1.0, ISTR that this rate was bumping up against 70%.
More recently, I’ve been reading quite a few anguished reports about the fact that the rate has gone back below 65%. Reversion to the mean, I say.
I remember noticing quite a few HAMP modifications “back in the day” that had balloon payments coming due at the (5 year?) mark, IIRC.
Maryland is the one state with a terrific (free) online public land records database, and I remember digging through those a few years back–I was mortified by the terms of some of the “modifications.”
It would make sense that a lot of those are starting to come due around now, maybe?
I think that the statement by ATTOM VP also needs some disection.
ATTOM VP Blomquist tries to remain sanguine: “The increase in October isn’t enough evidence to indicate a new foreclosure crisis emerging in these states, but it certainly demonstrates that this housing recovery is not completely devoid of risk.”
There is no housing recovery in that, rising housing costs does not constitute a recovery….rising housing costs with a surge in foreclosure indicates how tapped out the majority of homeowners are because of high housing costs and, as has been seen, the institutional housing shills have been buying out foreclosed properties in cash and jacking rental rates in a speculative fury to securitize rent and jump out with cash while the smurfs hold the bag again. We are in debt deflation…..
Just because Realtors (useless, banal bloodsucking ticks) see themselves as providing services worth their % of sale price which they say they maximize, does not change the fact that paying more on credit for a house makes you less able to spend elsewhere into the economy. We are in debt deflation.
Rising prices of a place to live should be considered a huge inflation but, somehow people are convinced that it is wealth creation instead of it’s opposite….it is magical thinking to believe that an object that deteriorates and crumbles gets more expensive in the short term. Rising real estate prices are great for the FIRE sector but, a disaster for the real economy.
Well, it is wealth creation for speculators and they’re really all that matters. They’re busy sucking the last of the quarters from all the little old ladies they let into the casino. I’m not sure who they’ll cannibalize after that, foreign investors?
“You’re the foreign investors!”
http://tng.trekcore.com/audiocaps/2×12/2×12-brokenthebank-e.mp3
Sounds like just another evening at “the Hotel Royale”
“One has to note cynically that they waited to the tail end of the Obama administration to act.”
So, money can be used as a passive-aggressive political weapon?
Therefore, postponing the purchase of a new American made car until after Inauguration Day, is “Just a choice.”
Historically, in any given market, the median price of a home has been three times the local median income. Housing Bubble 1.0 threw this metric out the window, and I seriously doubt that it has recovered from its injuries.
For example, in my local housing market, the median income is somewhere in the mid-thirties to mid-forties. Which means that Tucson is pretty poor.
Meanwhile, median house prices are somewhere in the high 100s. Or five to six times the local median income.
On the rental side of the market, the traditional metric has been that your home purchase price should be 100-120 times the monthly rent that the market will bear in the neighborhood where you’re buying. Good luck with that one. Rental home prices are also way up there.
My prediction: We are about to get the housing price correction that we should have experienced a decade ago. And don’t look for a repeat of HAMP, HARP, or that first-time homebuyer tax credit that juiced housing prices before it expired in 2010.
This multiple should naturally vary over time as a function of interest rates. Otherwise home ownership would become ridiculously cheap as interest rates decline and vice versa.
From your lips to the housing market gods’ ears, but I’m doubtful that housing prices will ever correct as much as they should in a down market. Instead of prices coming down, the market tends to seize (i.e., sales grind to a halt because sellers are generally unwilling to sell for much less than the outdated price in their head). If prices ever do correct fully, the process would most likely take a long time (or entail mass foreclosures, but even then the foreclosed homes would likely be sold to cronies (e.g., hedge funds) instead of the public).
It’s no surprise to us homeowners. Pennsylvania has a larger share of elderly who just don’t have the income to cover all their bills, their mortgages, and the increasing school and property taxes. In the 25 years I’ve been here, school and property taxes tripled. There has been price inflation in everything from food to services. But after two years of no increase in Social Security, I’m about to get an extra $1.80 a month while the Medicaid fee is going up $20 or more. Meanwhile, the media, the government, and pundits like Richter, haven’t acknowledged there is no “recovery” for the 99%.
A property that Fannie Mae has held for four years…
No such thing as shadow inventory, especially in one of the hotter (Portland Oregon area) markets…
Four years. And here I thought that the zombie foreclosure in my mom’s Pennsylvania nabe was getting long in the tooth.
Family walked away from that place in 2014. And it’s been turning to shhhh! ever since.
The owner of this oh-so-special place? Wells Fargo.
Our favorite cross-selling bank is named in the township code violation citation that’s taped to the front door.
Skyrocketing health insurance premiums.
Instead of having one mortgage payment and one health insurance premium, lots of “folks” now have two mortgage payments.
It is slowly bankrupting millions.
If I were the banks and were counting on housing going up in the past I would now bet on housing prices going down.
If Trump begins deporting immigrants the stock of vacant housing will skyrocket.
Blowback is hell.
I live in San Diego. My Chase HELOC will go from $400 to $1200 a month on $200k HELOC. Some people will not be able to afford this increase. Not doubling but tripling. No wonder Jamie Dimon was a millionaire before the Crash and now he and Blankfein are billionaires.