This is Naked Capitalism fundraising week. 1312 donors have already invested in our efforts to combat corruption and predatory conduct, particularly in the financial realm. Please join us and participate via our donation page, which shows how to give via check, credit card, debit card, or PayPal. Read about why we’re doing this fundraiser, what we’ve accomplished in the last year, and our current goal, expanding our reach.
By Janine Aron, Senior Research Fellow, Institute for New Economic Thinking; Associate Member, Nuffield College; Member of the Centre for the Study of African Economies, University of Oxford and John Muellbauer, Senior Research Fellow, Nuffield College; Professor of Economics, Oxford University; Senior Fellow, Institute for New Economic Thinking. Originally published at VoxEU
The US has 4% of the world’s population but 21% of the global COVID-19-attributed infections and deaths. This column shows that when comparing excess mortality rates, a more robust way of reporting on pandemic deaths, Europe’s cumulative excess mortality rate from March to July is 28% lower than the US rate, contradicting the Trump administration’s claim that Europe’s rate is 33% higher. The US Northeast – the region most comparable with individual European countries – has experienced substantially worse excess mortality than Europe’s worst-affected countries. Had the US kept its excess mortality rate down to the level in Europe, around 57,800 American lives would have been saved.
The US has the highest COVID-19-attributed infections and deaths, accounting for 21% of global deaths. Defenders of the US’s pandemic policy record assert that such figures are misleading since reported COVID-19 cases depend on the testing regime and many countries under-count COVID-19-related deaths.
Using excess mortality data is a more rigorous way to compare the pandemic’s death toll. Excess mortality counts deaths from all causes relative to what would normally have been expected. This avoids miscounting deaths due to the under-reporting of COVID-19-related deaths and other health conditions left untreated, or potentially misattributing deaths to COVID-19 that had other causes. Measures taken by governments and individuals may influence death rates – for example, deaths from traffic accidents may decline but suicide rates may rise. Excess mortality captures the net outcome of all these factors. We show that the P-score – a measure of the rate of excess deaths (actual deaths minus ‘normal’ deaths) relative to normal deaths – is preferable to measuring excess deaths relative to population.
President Trump has claimed that ‘Europe’1 has had a 33% higher rate of excess mortality than the US. It is unclear what measure of excess mortality and which comparison period he was using – he may have been considering excess deaths per capita. It is also unclear how he defined ‘Europe’ – possibly Italy or Spain were the countries he had in mind in his intended comparison with ‘Europe’.2 Our figures suggest the opposite: Europe had a 28% lower excess mortality rate than the US during March to July, using the most reasonable comparative measure. From end-February to 25 July, the US Centers for Disease Control and Prevention (CDC) calculates that excess deaths were about 207,000 above ‘normal’. If the US excess mortality rate had matched that of Europe, around 57,800 US citizens would have survived.3
Yet US policymakers had at least four advantages over their European counterparts in countries such as Italy and Spain that should have led to lower excess mortality rates than in Europe:
- First, there was more time to prepare. Genomic evidence suggests that Europe was the source of most infections that became evident in New York in early March. The US administration had three weeks’ more warning given the lag between initial rises in excess mortality in Italy and Spain versus the US Northeast. For the South, West and Midwest (accounting for 83% of the US population), the delayed spread of the virus should have provided an even greater advantage.
- Second, the US has a younger population4 and COVID-19 mortality is significantly correlated with age.
- Third, the US has a lower population density than Europe as a whole and for large conurbations within, and viral spread is greater in more dense populations.5
- Fourth, the later onset should have enabled US authorities to take advantage of rapidly improving medical knowledge and capacity (the nature of the disease, treatment regimes, testing capacity, and the effectiveness of policies such as social distancing and masks).
These multiple advantages should have reduced US excess mortality rates relative to Europe, but instead rates far exceed those of Europe and its countries (see Figure 1).
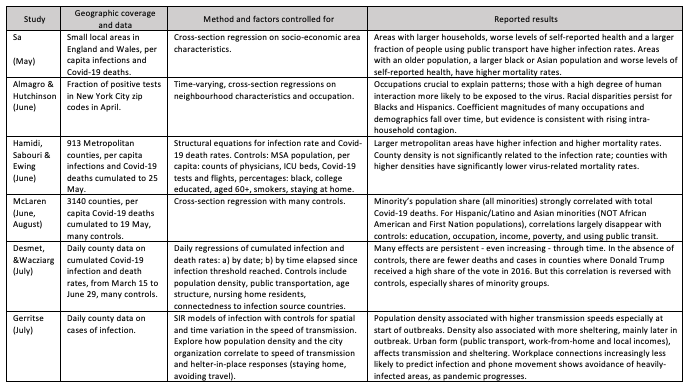
The more robust excess mortality P-score measure could help analyse cross- and within-country differences in order to draw lessons about the social and economic consequences of the pandemic and of relaxing lockdown restrictions. Studies on the spatial variation in COVID-19 infection and death rates to inform policymakers, many appearing via CEPR, are useful for framing the kinds of variables – urban density, spatial patterns, racial inequality – that are useful in cross-country comparisons. Table 1 summarises a representative subset.6
Table 1 Selected 2020 studies on spatial and socio-economic variation in COVID-19 infections and deaths
When Is It Valid to Compare Rates of Excess Mortality for the US and Europe?
In an application to European countries, we assessed the comparability of data on excess mortality between countries and regions (Aron et al. 2020a,b), reviewing the available data sources and comparing and contrasting different statistical measures of excess mortality.7 We argued that P-scores at a weekly frequency or cumulated from the start of the pandemic were the most robust indicators for comparing excess mortality across countries. They are preferable to per capita rates of excess mortality, which are biased in favour of countries with younger populations. The P-score is defined as excess deaths as a percentage of ‘normal’ deaths. For weekly data, ‘normal’ deaths are often defined as the previous five-year average of the same weeks.8 ‘Normal’ death rates reflect persistent factors such as the age composition of the population, the incidence of smoking and air pollution, the prevalence of obesity, poverty and inequality, and the normal quality of health service delivery. An advantage of the P-score is that it takes into account such differences in ‘normal’ deaths between countries or regions.
Even P-scores need to be interpreted with care. While P-scores are less affected than per capitaexcess deaths by differences in the age-composition of the population, they are not immune. The COVID-19 pandemic has disproportionately more severe outcomes for the elderly. Though less biased than the per capita rate, even the P-score measure of excess mortality computed for all ages will favour countries like the US with a younger population.9
Comparing Plausible Indicators of Excess Mortality for the US and Europe
We compare measures of excess mortality for the US (using CDC data) with Europe (using data from the Human Mortality Database, or HMD).10 European coverage consists of the 27 EU countries, excluding Ireland, Cyprus and Malta (with 5.0, 0.9 and 0.4 million people, respectively), but adds Iceland, Norway, Switzerland, and the UK nations. The total included population is 522.2 million, compared with 330 million for the US. For the US, CDC data, adjusted for trends, define normal weekly mortality. For European countries, normal weekly mortality is calculated as the average for that week in the previous five years.11 The weekly count of excess deaths is then calculated as the actual deaths for that week minus the ‘normal’ number of deaths. For weeks where excess deaths are estimated to be negative, a count of zero is used instead. This avoids the problem of undercounting recent deaths, which could contribute to finding spuriously negative rates of excess mortality.12
We compare cumulative excess mortality from the last week of February to the penultimate week of July13 and compute the two measures of rates of excess mortality: the per capita measure of excess deaths and the percent of ‘normal’ (i.e. the P-score measure). The July endpoint reflects missing data for some European countries for later weeks; also, recording lags in the US data14make later observations less accurate. Table 2 shows the comparative results.
Table 2 Comparison of cumulative excess mortality in the US and Europe
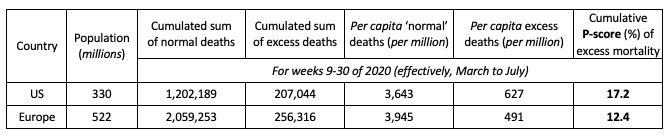
Sources: The P-scores for Europe are calculated by the authors using the Human Mortality Database (see metafile) for the European countries; the ‘normal’ or expected weekly deaths are defined as the average for the previous 5 years, except for Germany and Greece where the previous four years are used. The P-scores for the US are calculated using CDC data where ‘normal’ deaths take mortality trends into account.
Notes: (i) See the text and Figure 1 for the countries included in the definition of Europe. (ii) Cumulative P-scores cover the weeks 9-30. Data are available for the US to week 36, but given reporting lags, are liable to undercount mortality in recent weeks because of lags in registration. (iii) Negative excess deaths were set to zero. (iv) See other notes under Table 3.
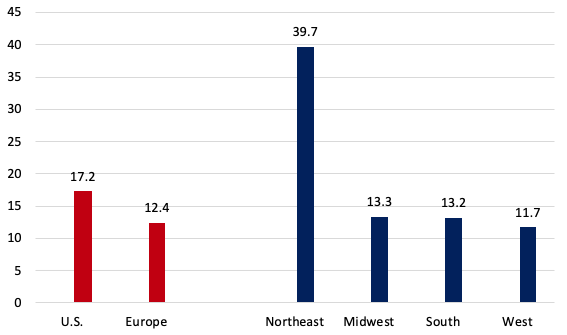
As noted, Europe has an older population and hence more ‘normal’ deaths per capita than the US (see Table 2, column 5). The ‘all ages’ P-score measure of excess mortality takes (significant)15 account of this and in Europe was 28% lower than in the US. Even on the cruder per capita figure, excess mortality in Europe was 21% lower than in the US. A cumulative P-score of 17.2% means that for every 100 ‘normal’ deaths, there were 17.2 additional deaths in those weeks in 2020.
Despite the multiple advantages of the US discussed above, which should have reduced relative excess mortality, the US rates far exceed those in Europe. Figure 1 shows P-scores, ordered from highest to lowest, for the US, Europe as a whole and various European countries. Spain and ‘England and Wales’16 have the highest excess mortality rates amongst European countries. Comparing a large, highly heterogeneous country like the US with individual European countries is inappropriate; also, the pandemic timing needs to be matched. A more relevant comparison is of the worst-affected US region with the worst-affected European countries during the pandemic’s first wave.
Figure 1 Cumulative P-scores of excess mortality comparing the US to Europe, weeks 9 to 30
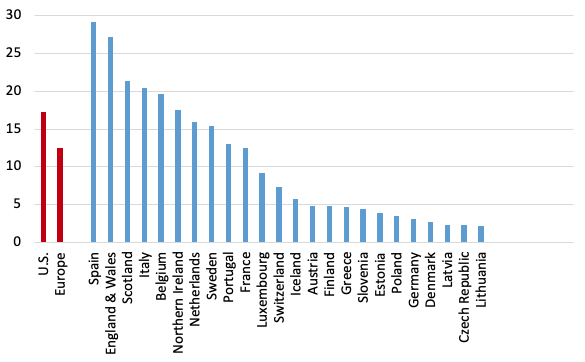
Sources: The P-scores for Europe are calculated by the authors using the Human Mortality Database (see metafile) with the ‘normal’ or expected weekly deaths defined as the average for the previous five years, except for Germany and Greece where the previous four years are used. The P-scores for the US come from CDC data where ‘normal’ deaths take mortality trends into account. For the US Northeast, excess and normal deaths are cumulated over the nine member states.
Notes: (i) Cumulative P-scores cover the weeks 9-30. Data are available for the U.S. to week 36, but given reporting lags, are liable to undercount mortality in recent weeks because of lags in registration. (ii) Negative excess deaths were set to zero. (iii) See other notes under Table 3.
Digging Down: Comparing the US Regions to Large European Countries
Arguably, the Northeast census region of the US (comprising nine states)17 provides a good comparator with the larger European countries in terms of population size, density, age composition, urban-rural structure and the timing of the pandemic. For the five worst-hit European countries, we compared weekly P-scores and the peak week cumulative P-scores in the first wave of the pandemic (Aron and Muellbauer 2020b). For an 11-week peak period, the starting dates varied by country between week 10 (ending 8 March) and week 13 (ending 29 March) of 2020. The equivalent 11 weeks for the US and the US Northeast are weeks 13 to 23.18 Table 3 compares cumulative P-scores for the US and the Northeast with the eight worst-affected European countries and with Germany, which registers the lowest P-score among large European countries. The US Northeast suffered by far the highest rate of excess deaths in the first wave of the pandemic. In a like-for-likepeak week comparison, its P-score was 75%, compared to 55% for Spain and 5.7% for Germany. The US Northeast also had the highest per capita excess mortality in these weeks.
For the cumulative P-scores for weeks 9-30, the pattern is repeated. Figure 2 also shows Europe’s cumulative P-score for weeks 9-30, which lies below three out of four US regions, and below the US as a whole.
Table 3 Cumulative P-scores for the 11 peak pandemic weeks for the US, the US Northeast and major European countries and for weeks 9 to 30
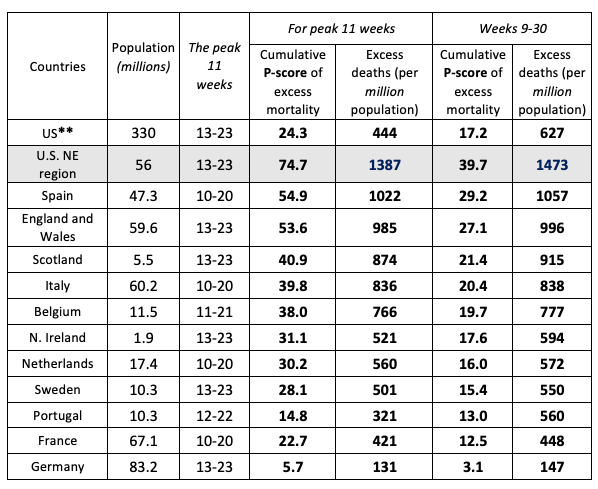
Sources: The P-scores are calculated by the authors using the Human Mortality Database (see metafile) for the European countries with ‘normal’ or expected weekly deaths defined as the average for the previous five years (four in the case of Germany), and for the US and US Northeast (aggregating data for its nine states) from the CDC’s Excess Mortality website. The CDC uses models incorporating trends and seasonal to estimate normal or expected deaths.
Notes: ** The US as whole is included for reference but cannot provide a like-for-like comparison with individual European countries over this time frame, since at least two of its four regions (the South and the West), comprising 62% of its population, experienced a far later spread of the pandemic and all four regions have not returned to zero excess mortality. The Northeast US region can be fairly compared over this time-frame with individual European countries. (i) Cumulative P-scores cover the 11 peak weeks shown in column 2. (ii) Negative excess deaths were set to zero. (iii) The European country ordering is by cumulative P-scores; the countries shown have the highest P-scores in Europe, apart from Germany, which has the lowest among the large economies. (iv) HMD only report for ‘England and Wales’, not separately for each; they report for Scotland and Northern Ireland. (v) HMD use deaths by week of occurrence for all the above countries, except the UK, where deaths by week of registration are used. (vi) For the US, the CDC define a week as ending on Saturday. For Europe, HMD define a week as ending on Sunday, except for ‘England and Wales’, which is Friday (see their metafile).
Figure 2 Cumulative excess mortality P-scores across the four US regions
Sources: The P-scores are calculated by the authors using the Human Mortality Database (see metafile) for European countries, and for the U.S. and its regions from the CDC’s Excess Mortality website. See notes under Table 3.
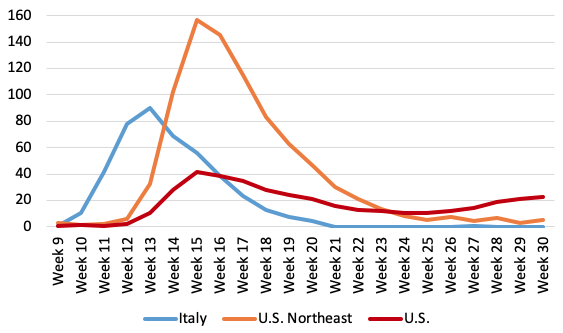
The weekly profiles of P-scores for the US Northeast and the US in Figure 3 suggest that deaths had almost returned to normal levels by week 23 in the Northeast, but not for the US as a whole, and illustrates the later arrival of the pandemic compared with Italy. The even later spread of the pandemic in the other US regions is seen in Figure 4, which also shows the share of these regions in total US excess deaths.
Figure 3 Weekly profiles of P-scores: The US Northeast, the US as a whole and Italy, weeks 9 to 30
Source: The P-scores are calculated by the authors using data for the US and the US Northeast (aggregating data for its nine states) from the CDC’s Excess Mortality website. The CDC uses models incorporating trends and seasonal to estimate normal or expected deaths. Data for Italy are from the Human Mortality Database (see metafile) for the European countries; the ‘normal’ or expected weekly deaths are defined as the average for the previous five years.
Notes: (i) Data are available for the US to week 36, but given reporting lags, are liable to undercount mortality in recent weeks because of lags in registration. Data for Italy end in week 26 and were interpolated to week 30 using EuroMOMO z-score data (ii) Negative excess deaths were set to zero. (iii) The CDC define a week as ending on Saturday. HMD define a week as ending on Sunday, see their metafile. (iv) See other notes under Table 3.
Figure 4 Regional weekly excess deaths and the share of all US excess deaths across the four US regions
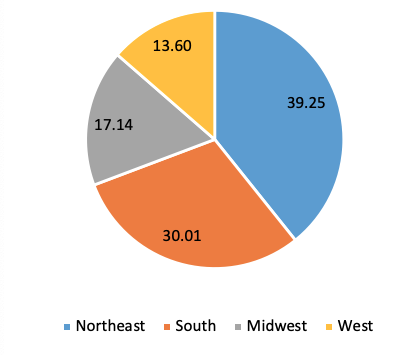
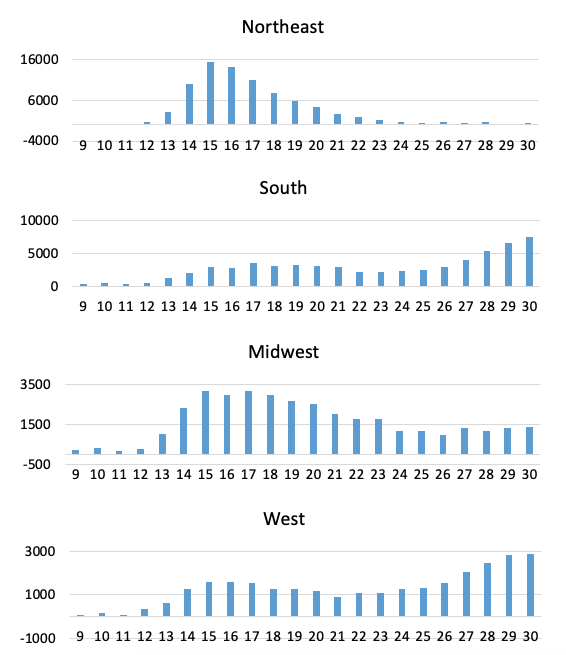
Sources: Excess deaths for the US and its regions from the CDC’s Excess Mortality website. See notes under Table 3.
The Bottom Line: Is the Claim that US Excess Mortality Is Lower than in Europe a Fact or Fiction?
We compared cumulated excess mortality for the US and Europe, measured by excess mortality per capita and the percentage of excess mortality relative to ‘normal’ deaths. Our definition of Europe has broad coverage. Excess mortality rates were significantly lower in Europe than in the US (from end-February to near-end of July 2020 (Table 3, Figure 1). US deaths exceeded ‘normal’ deaths by around 207,000. If the US excess mortality rate had matched that of Europe, around 57,800 US deaths would have been avoided. By the P-score, excess mortality in Europe was 28% lower than in the US; even on a cruder per capita figure, excess mortality in Europe was 21% lowerthan in the U.S. This is surprising as: (1) the pandemic arrived later in the US, giving policymakers more time to prepare; (2) the lower population density and degree of urbanisation and (3) lower median age in the US than in Europe should have resulted in lower mortality; and 4) the US could have taken better advantage of rapidly evolving medical knowledge and capacity. Our findings contradict repeated claims by President Trump that Europe had a 33% higher rate of excess mortality than the US.19
Examining the US Northeast census region, which is much more comparable than the rest of the US to European countries in terms of population, population density, age structure and degree of urbanisation, and in the timing of the first wave of the pandemic, leads to a similar conclusion. The first wave lagged Italy’s first wave by three weeks. Comparing the 11 peak pandemic weeks for each, the Northeast had substantially higher rates of excess mortality than the most severely affected European countries (see Table 3). The Northeast region had 36% proportionately worse excess mortality than the worst-affected European country, Spain (i.e. a P-score of 75% versus 55% for Spain).
Most states and cities in the US Northeast have Democrat governors and mayors. Some might attribute higher excess mortality rates to this political factor. However, higher rates of excess mortality in Northeast states cannot be attributed to the governing party. A study of COVID-19 deaths and infection rates across US counties finds that counties with a high 2016 vote share for Trump have higher rates of COVID-19 mortality, accounting for population density, racial/ethnic composition and other controls (Desmet and Wacziarg 2020). This result appears to be confirmed at the state level when using excess mortality as the dependent variable: states with a higher share of the Democrat vote in the 2016 election have lower cumulative P-scores, given appropriate controls.20 While the dense, urban Northeast had the highest excess deaths, the Midwestern and Southern states, many of which have Republican political leadership, also suffered higher excess mortality than Europe (Figure 4), despite being substantially less dense, more rural and having advance warning.
These results raise important questions as to why the US, with its technical and institutional capabilities and other advantages cited, was far less effective in its response to COVID-19 than Europe.
Spatial studies that explain these excess mortality patterns could lend policy insights.
Authors’ note: We are grateful to Eric Beinhocker of INET for comments and to Jessica McDonald of FactCheck.org for highlighting the current relevance of the issue and working with us. Her article can be found here. We thank Our World in Data, especially Charlie Giattino, for providing data.
See original post for references


NYC was simply a perfect storm demonstration of tag-team neoliberal Idiocracy. Private equity liquidated health systems, regulatory capture, complicit media and speciously gullible, intentionally delusional Creative Class; who’d skedaddled, while feeding Black, Hispanic & refugee “essentials” to a lethal virus for a month, trying to make 105 billionaires 120, flipping 35K miraculously vacant apartments, indenturing survivors with $35K surprise ER, ICU, PhARMA and final expenses, since few victims were even tested? Now, we’re all chronic, broke… yet vulnerable!
Aye. I’ve been following the COVID-19 statistics at Worldometer, where you can re-sort the list to put the highest “deaths per 1M pop” at the top. If New York and New Jersey (which received a lot of the NYC spillover) were their own countries, they’d be the two worst countries on the planet in terms of COVID-19 deaths.
If you exclude NY and NJ from the statistics, the US death rate drop from 638 to 535 deaths per 1M pop, which is a 16% reduction. This would account a good chunk of the higher “excess mortality rate” that the US has seen relative to Europe.
NYC was indeed “a perfect storm demonstration of tag-team neoliberal Idiocracy”. They really screwed it up, with massive death and human suffering as a result.
If Europe could remove Italy (and possibly Spain) from our stats you will still be far higher ;)
It seems like the first country / state hit does all of the mistakes and the neighbours learn from their mistakes…
I think Trump’s claims last night will be fact checked and exposed today. Just thinking about the “P Score.” In this country of less-than-adequate social services there really should be a category for Stress. Not everyday stress, which is bad enough, but extreme circumstance Stress which is aggravated by the everyday stresses of our useless economic system. Think of the sub-categories: Your unemployment check runs out and Congress recesses; food banks run dry; home schooling is inadequately organized; information on susceptibility is all confused; both racism and classism allow neglect at every level; you are getting evicted; your electricity just got cut off and everything in your small freezer is spoiled; there’s no hot water; you can’t afford to fill your gas tank or drive your car; masks that are absolutely ineffective and worthless are selling for $5 each – if you can find them; hospitals are cut to the bone; medical staff is totally exhausted; there is no PPE; there is only chaos because best practices for prevention hurts profits, and there are credible rumors that our highest officials have conflicts of interest; the general health of our population is crappy to begin with and suffers from bad nutrition and polluted air; and we wonder why China has done so well controlling Covid… This is disgraceful. There’s no other word for it… except maybe it’s a “shithole.”
Susan the other
September 30, 2020 at 11:00 am
Your exactly right. I’m amazed, though I have been around long enough that I shouldn’t be.
Or…a reasonable person might suggest that all things are not equal and the medical system in the USA, based on the strange risks for birth compared to the rest of the world, has a horrific set of results and is a massive problem being glossed over by all the flag waving for medical professionals actually showing up for work. We pay more for way less and this has exposed the overpriced corner cutting.
Nah, greatest country in the world, rah rah rah, we just need to get rid of Trump/Biden don’t you know.
(Sorry I went to bed angry and woke up angry.)
Thanks. Isn’t excess mortality the absolute vaguest way of measuring the impact of the disease, given the many variables involved? For example I’ve read that countries that had a low flu season the previous year will have higher excess mortality simply because there are more old and frail people available to be victims.
And I wonder if you took the Northeast out of the picture how the US would compare to Europe? While the death rate in SC has certainly risen over the summer our deaths per 1 million are still one third that of NY and NJ. Is there really no political spin factor here? No blame to Cuomo (but plenty seemingly to Trump)? I’d say those Northeast governors better hope there isn’t. And with the possible exception of Cuomo there probably isn’t.
Here’s hoping next pandemic politics will be out of the picture totally because that certainly hasn’t been true of this one. Blame it on Trump for putting himself up front during the crisis but also blame it on the media and blame it on the Dems.
Check Figure 2 “Cumulative excess mortality P-scores across the four US regions”
North East, South and Midwest are worse than Europe, but the West did a little bit better.
No Excess mortality is the best because we have so much data to compare with … AND there is virtually no flu to disturb the numbers
It would be interesting to see if there is a correlation in deaths for the over 55 demographic and obesity rates.
What have some indication that medical treatment is less effective in preventing deaths when the Covid infection is accompanied by obesity, and many other obesity related complications.
I think there was an article here and definitely on other sites that said it is absolutely linked to obesity. So the American love for being fat is another one of those variables.
Another vote for obesity/physical fitness/diet factor, including explaining regional U.S. differences.
See ya on the trails and the high fat / medium protein / low carb food aisles at the grocery store!
I question the article’s assumption that any increase in deaths in 2020 vs prior years is due to CV infection. Could excess deaths not also be attributed to consequences of the response to CV, such as loss of employment, postponement of routine care, social isolation due to distancing, fear and stress caused by pandemic hysteria, etc? And if so would those factors operate equally in Europe and the US?
Yes, there are many variables involved here. It does appear that obesity is a major contributor to Covid mortality. And so is the totality of US culture (compared to Europe): expensive or non-existent health insurance (care) for many Americans; limited worker unemployment insurance; inability of essential workers to protect themselves (by fleeing to the Hampton’s); unabashed economic/social segregation; and national leadership that considered the virus a hoax.
The point of the article was to debunk the statement of the Chief Hoaxer. It seems a credible explanation that the Hoaxer-in-Chief is wrong, again.
So it’s a debatable debunking. Why not use actual statistics?
https://www.worldometers.info/coronavirus/country/us/
https://www.worldometers.info/coronavirus#countries
Well, it’s more than just obesity in my opinion:
– Diet/Nutrition in general (directly correlates to class) and especially Vitamin D deficiency, this might be even worse for black people, who might need to supplement their levels by default.
– Diabetes
Now it would be very interesting, if we could get some more figures on the relative occurrence of these conditions. Another thing is the treatment methods. In my opinion the HCQ+ or Ivermectin+ first line treatments make a significant difference. This however varies a lot across Europe as well.
This is not consistently used throughout Europe as well however. So again, lots of different variables, and not enough data to draw conclusions. Comparing countries is seductive for scoring some points, but really doesn’t add anything useful to the discussion.
Note that the jury is still out on ivermectin, mentioned earlier in comments, as there are some questions of the most heavily cited paper.
https://www.isglobal.org/en/healthisglobal/-/custom-blog-portlet/ivermectin-and-covid-19-how-a-flawed-database-shaped-the-covid-19-response-of-several-latin-american-countries/2877257/0
Interesting that two very simple molecules (which means they are probably cheap to manufacture, although this has absolutely no correlation to how much Big Pharma is going to gouge you poor suffering suckers) are showing some promise. a) 4-Phenylbutyric Acid [doesn’t even have a fancy made-up name], which shows a lot of promise in halting hyperinflation and thus cytokine storms, and b) Ebselen, used in a variety of diseases, which disrupts a vital CV19 protease.
https://www.medicalnewstoday.com/articles/covid-19-can-we-tackle-the-root-cause-of-inflammation#Cellular-stress
https://www.medicalnewstoday.com/articles/treating-covid-19-bipolar-drug-shows-promise-and-other-hopeful-findings
Complexity is only partially related to cost, but for comparison, chemical formulas of:
4-Phenylbutyric Acid: C10 H12 O2
Ebselen: C13 H9 N O Se
Ivermectin: C48 H74 O14
These statisticians jump right into the weeds without giving you some basic numbers to get your feet planted firmly on the ground. For instance, could we just see a chart showing annual all-cause mortality for the US and European countries, for the past 5 years?
Why? Because I assume “normal deaths” expected are not just some straightforward number, but rather the result of a complicated algorithm (and probably debatable if you’re up on your statistical algorithms.)
A lot of this is too “black box” for me as a layperson to trust it at face value. If the writers have any agenda they could easily make the numbers dance however they want them to. I need more of the basic, raw data, unadjusted and unvarnished, to begin to get the lay of the land.
Right on! The complexity is further muddled by variation in local practice in the categorization of cause of death.
This is much like the post, but I feel need to stress it.
I keep remembering all that reading I have done on the history of diseases and while COVID-19 is bad, it is merely an annoyance compared to some previous ones. So what happens when something even worse like the 1918 Flu or perhaps Smallpox II, the Reawakening appears? How about an “improved” version of the pneumatic form of the Black Death, which already has a greater than 90% death and the ability to spread like the flu? It does not even have to be that bad. A mutated version of one the many exciting “childhood” diseases my parents and grandparents often got, that can get passed the current vaccines would be bad enough.
The United States, large areas of the planet, have difficulties handling this comparatively mild pandemic. China, for all its vaunted technocratic abilities and all the information that its dystopian panopticon could get its government, nearly let the disease overwhelm its medical system because of incompetence and corruption. They did let it get loose to the rest of the world. Then there is Europe.
We are all looking at the news over the Summer and marveling at the rampant stupidity, corruption, ignorance, and general incompetence seen all over the world when previously the various governments and societies (usually) dealt with deadlier diseases much more competently. They often did it with a lesser understanding of what they were dealing with and with fewer resources. But we just cannot.
I am getting less hopeful of our civilization’s, forget our individual countries’, abilities to handle anything including the next pandemic or climate change. It is not because we lack the knowledge, certainly not for lack of inherent abilities, or even for the want of resources, but because not being able to survive today helps some people “win” tomorrow whatever game they are playing. And that tomorrow is coming evermore quickly.
The United States has become totally transactional; everything is defined by money, buying and selling. A ruling pact of oligarchs seized power, bought politicians, funded thinktanks and NGOs. Transferred all the new generated wealth to themselves. To achieve this, democracy and the rule of law were dismantled. It blossomed in the Obama Era but Donald Trump has thrown a monkey wrench into the gears, risking a new civil war 2.0.
Oligarchs and Corporations cannot control pandemics. Only functional governments and science based public health systems can. The bottom line in the West is that corporate profits now outweigh human lives. This is the cause of the excess morality rate in the USA. Without a national public health system and universal testing, coronavirus will be endemic in the Americas until, if and when, a vaccine that works is developed. American life expectancy was declining even before the pandemic and economic depression hit. It will get worse.
The views expressed above that US excess deaths may not be primarily Covid are supported by the usual rigorous stats and analysis here by Policy Tensor, no friend to Cheeto45
Noting also the utter indifference shown to the Despair Epidemic by our Lib Overlords. At least Trump gave it passing lip service in the debate, although it got lost in all the heckling.
The etiology of the epidemic is clear: the hourglass economy that followed the Clinton betrayal destroyed the working class family….
In the professional class understanding, the roughly two hundred black men (0.2k) who are shot and killed by the police every year exposes the white supremacism of American police forces and the blue collar officers who man them; while the hundred and fifty thousand deaths of despair merely attest to the self-destruction of the poorly-educated….
Even with all the comorbidities, it is not clear whether more Americans will die of COVID-19 than deaths of despair this year…. [given] extreme social isolation and widespread depression.
I have shown previously that overdose deaths are the strongest predictor of the Trump swing.
The initial [Covid] panic was justified; although there were some, like the Swedes, who kept their cool. But the Bayesian update that needed to happen this summer — okay guys, this is not exactly an existential threat — simply did not obtain….
Professional elites, who dominate the Democratic party, from Zuckerberg on down, perpetuated the panic over COVID-19 with an eye on the election. But it is looking increasingly likely that it may cost them the election instead.
And then, double wowsers©! our highly rational, nonideological and data driven friend the Tensor extrapolates to a prediction that echoes that of Kunstler or ZH! an avalanche of sketchy mail-in ballots lands on swing states unable to validate them, sparking factional armed clashes!
Well worth reading in full, needless to say, including the comments…. Forget the coffee, grab antacid tablets.
Convenient overlooking the fact that letting it rip would cause collapse of health provide system. Conveniently forgetting the overflowing hospitals in Bergamot, Madrid, NYC, NJ, Houston
The US needed harsher measures, because voluntary compliance was never going be enough – American exceptionalism!!
Instead of flattening the curve, crushing it like Taiwan, Korea, and New Zealand was never socially or politically possible – fragmented and underfunded healthcare/public health paired with austerity driven social safety nets and guided by delusional, miserly, disconnected, selfish elites worshipping “markets”.
You clearly didn’t read the piece.
To quote Ed Luttwak, the virus won’t pass around us, it must pass through us (collectively). All we can do is influence the pace, while we work toward prophylaxis, treatments and a vaccine.
Flattening the curve merely buys time for health care systems to prepare, by lowering acute caseload to levels they can handle. In Jan-Feb pretty much all health systems worldwide were underprepared and didn’t know what we were dealing with, so total lockdown was fully warranted.
America’s fragmented and hollowed out private system and execrable elder warehousing ‘industry’ has proved among the hardest to shore up (which surprised precisely no NC readers). And while Trump’s ignorant posturing didn’t help, this is a systemic malfunction that long predates him. A Hillary admin would have enjoyed little more traction, although masks would surely be in more widespread use today.
… But as a species, we’ve now been focused on this threat for some 8 months. So if America (or Victoria, or Spain) still has to shutter its economy because it *still* can’t keep vulnerable people from dying like flies, then that’s more systemic rot in evidence. But imposing extended shutdowns in an attempt to throttle caseload to zero carries its own price that can kill even more people over time. That’s PT’s point. At no point does he suggest there’s a pain-free alternative.
This tells a story of how early epidemic signals were ignored and/or confused (with seasonal flu, for instance) and how the regions were taken unprepared by the epidemic. The more confused and unprepared, the higher mortality, with some added behavioural differences. That is why I believe, or hope, that further waves will be managed much better even if we collectively play the ostrich. These days, the moment you feel a cough, first suspicion will be on SARS CoV 2, it will be diagnosed at a rate as never have been diagnosed viral respiratory diseases, and treatment will have also improved (not that much but enough to reduce mortality).