As the housing numbers come in, they keep getting worse and worse. From Bloomberg:
Sales of new homes in the U.S. dropped more than forecast in August and prices plunged by the most since 1970, underscoring the Federal Reserve’s concern about the broader economy.
Purchases declined 8.3 percent to an annual pace of 795,000, the lowest level in more than seven years, the Commerce Department said today in Washington. The median price dropped 7.5 percent from a year ago.
The figures suggest home construction will extend its deepest slump since 1991, and consumers will have less home equity to tap for spending. Fannie Mae Chief Executive Officer Daniel Mudd said in an interview today that the industry won’t hit a bottom until the end of next year, echoing comments by KB Home, the builder that hours earlier reported a third-quarter loss.
However, performance across the country varied greatly. Sales actually increased in the Midwest and Northeast:
The number of homes for sale at the end of the month fell 1.5 percent to 529,000. The inventory of unsold homes jumped to 8.2 months at the current sales pace.
The number of properties completed and waiting to be sold rose by 2,000 to 180,000.
“We don’t think we hit a bottom until the end of ’08 and then we have some period of time to work our way back up again,” Mudd said in the interview in Washington. Fannie Mae is the largest provider of financing for American mortgages.
Sales fell in two of four regions. The decline was led by a 21 percent slump in the West and a 15 percent drop in the South. Purchases increased 42 percent in the Northeast and 21 percent in the Midwest.
Housing starts have dropped to a level below even pessimistic forecasts. Keep in mind that the 795,000 figure presented above is an annualization of the latest month’s results, but consider that noted bear Nouriel Roubini had said the trough would occur in 2008 at 1.1 million new starts, and Roubini pointed out that some forecasters were looking for results below that level:
As recently reported housing starts have now fallen by 42% and now JP Morgan – one of the most respected research houses on Wall Street and a persistent proponent until recently of the view that the housing recession would bottom out – is predicting that housing starts will fall another 25% to a cumulative fall of 56% from peak and will bottom out at 999 thousand units some time in 2008.
Why the steep decay? There is a lot of housing out there….From an earlier post:
Michael Shedlock, of Mish’s Global Economic Trend Analysis, provides some uplifting charts and commentary that should quash any doubts that this housing cycle is worse than its predecessors:
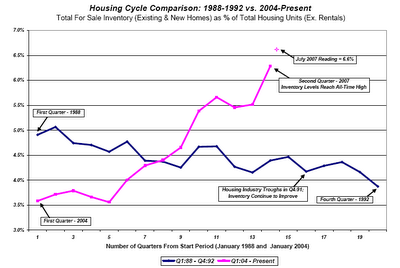
….this housing cycle looks different than any I have seen. To this point, I have included two charts. I suggest studying them carefully. What you find is that the 1988–1992 housing cycle peaked in the first quarter of 1988 (1Q88) followed by a decline in “For Sale Inventories” until the cycle troughs in the 4Q ’91 (some 15 quarters later, which is typical).
Housing Inventory 1988-1992 vs. 2004-Present
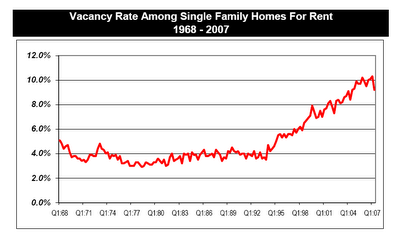
Housing Vacancy Rates 1968-2007
In case the charts are hard to read, the pink line in the top chart is our current housing inventory level, while the blue line is the 1988-1992 inventory line. Shedlock’s point is twofold: in the last cycle, inventory peaked in 1988, but the market prices continued to tank until inventory levels had fallen, which took almost four years. Second, look how dizzyingly much higher current inventory levels are relative to housing stock than they were last time around.
And his second chart shows that houses for sale have plenty of competition from a rental market that also has a lot of slack.


I agree the final chart is interesting, but I think there were differences in the overall economic context in the 80s/90s.
My impression is that both the early 80s and the 88-92 housing problems were caused by an overall recession (and high interest rates in the early 80s).
In this cycle a debt bubble seems to have created the appearance of more demand than was really sustainable. That caused overbuilding, overpricing, and a big inventory overhang. In past cycles, it seemed like high interest rates and economic recession triggered a housing problem while inventory was fairly reasonble.
In this one, it seems like the overbuilding/pricing/bubble-mentality triggered the housing problem on its own. As the housing problem grew, that began to trigger lower access to home financing and may trigger a recession.
So, it seems like we are entering the beginning of what traditionally causes a housing problem (financing/recession) from a different initial state ( overbuilt, over inventoried, over priced).
Can you tell me where I can find this data ?
Thanks.
Anon of 3:29 PM,
The reason for showing the Shedlock charts wasn’t to make a statement about the cause of this housing recession vs. the one in the early 1990s, but their relative severity. This one clearly looks to be far worse.
Anon of 4:44 PM.
I assume you mean the Shedlock charts, since there are links for the other citations. Frankly, I don’t know where he got it from (his original post doesn’t indicate a source) so you might e-mail him.