Reader AK sent me a bit of Christmas in May: three hot-off-the presses reports, one from Morgan Stanley on the credit standing of US and European broker dealers, a Moody’s report on RMBS, and a UBS report on the subprime crisis.
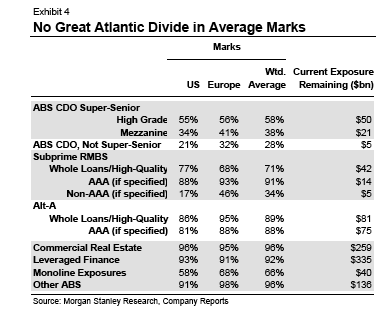
The Morgan Stanley report, although the shortest, was in some ways the most informative, since it provided a table that shows the marks that dealers are using for various types of securities. The paper argues that the gap between US (based on a universe of 7) and European (universe of 15) broker dealers has narrowed considerably, so the perception that European dealers were in worse shape than they appear to be is dated (note Knight Vinke disagrees vehemently as far as HSBC is concerned).
Morgan Stanley is suitably mysterious about its methodology, but claims it is +/-2% for those marks that have later been disclosed. Their approach no doubt includes sexual favors and the liberal use of alcohol.
Note this research does not necessarily contradict what my buddy with high level sources said about European banks sitting on a lot of undisclosed losses. The bulk of the lousy 2006 RMBS and CDOs were sold abroad, often to smaller institutions. So their could be trouble brewing in the next-tier institutions.
The Morgan Stanley chart (click to enlarge):
Note that these marks are generally higher than the haircuts required by the Fed per its collateral table, with the notable exception of CDOs. Of course, these marks are averages, and one would have to assume adverse selection in whatever was fobbed off on the central bank.
The report argued that broker/dealers are two thirds of the way through their write-downs, but warned that there was still the potential for trouble via basis risk and counterparty risk in hedges (code for possible CDS woes). And its other main caveat:
But as our equity analysts in the US and Europe have highlighted repeatedly, the looming concern is that of more traditional loss provisioning by commercial banks. Rising provisions and further deleveraging will make the earnings environment challenging for years to come, although with tail risk also reduced, we be believe this will be a greater headwind to financial equities than to credit.
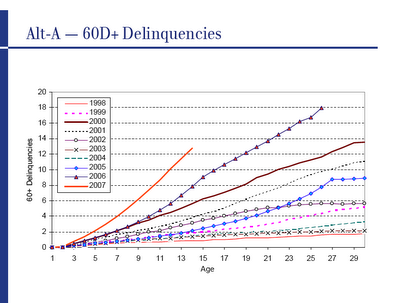
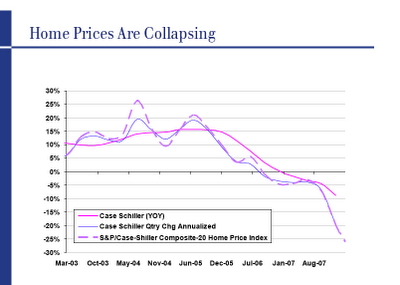
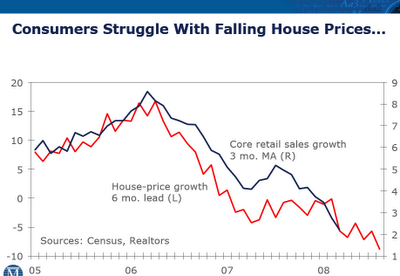
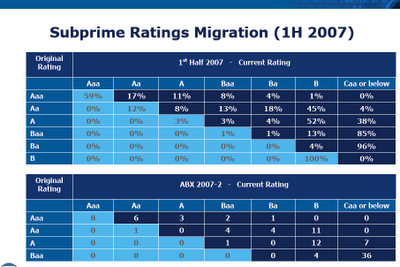
I thought I’d lift the charts I found most interesting from the two other presentations (150+ pages in total, so forgive the arbitrary selection). From UBS (click to enlarge):
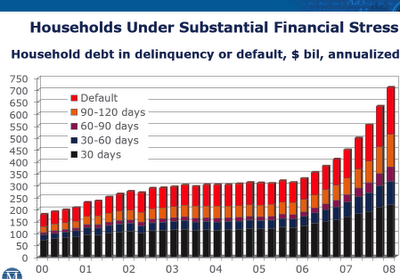
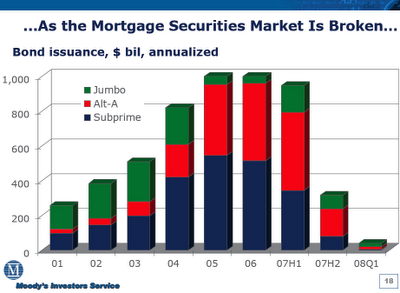
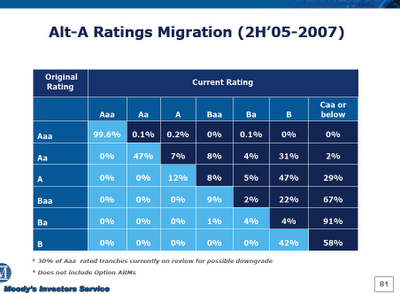
From Moody’s (click to enlarge):


brokers are 2/3 through writing down what? The “annoucned” exposures. That is merely a distractor to the gluttonous balance sheets and namely the LEvel 2-3 assets catagories. Not to suggest all are worthless, but it take mereley a fraction to make the entire complex insolvent.
Yves, thank you for these goodies.
How can a super senior be marked at 55 when the economics suggest a remote chance of experiencing loss, even in this environment? I understand that FAS requires mark to market at the exit price which means when liquidity dries up the price is 55. But holding it means the performance of the bonds should be fine and then the investor would later accrete as earnings what he just wrote down, net of any actual losses. The problem is that banks and others are raising REAL capital until/if those returns or lack of losses are realized. It seems that FASB has not dealt very well with the chasm between the marks (which must go through earnings) and expected actual performance of the investment. It’s a huge inefficiency and poor use of capital (whether the system is adequately capitalized in absolute terms is anopther question).I think the financial press hyper ventilates about “losses”. Nobody is selling !!
I think you have to keep in mind that these are $55 marks on subprime backed CDO paper. Ignoring the accounting subtleties for the moment, that’s very close to a fair mark. A high grade ABS CDO was backed mostly by A & AA pieces of 06/07 subprime ABS, a lot of which will get wiped out, housing reform or not. All you really have to do is compare the default pipeline (so reo+FC+60+delinws) with current subordination on those A pieces and it’s not farfetched. Now because the ABS CDO is comprised of these A tranches, as well as other CDO’s any losses on the underlying will quickly translate to losses on the mother cdo…
Note, if the High Grade ABS CDO was made up of just AAA pieces of subprime ABS then this woldn’t be true, since many of those are still money good
AK, all good points. Thanks for the proper framing. — MD (anonymous)
what are these reports called (titles and/or links) – esp. the moody’s and usb. i would like to read them.
thanks