By rjs, a rural swamp denizen from Northeast Ohio, and a long-time commenter at Naked Capitalism. Originally published at MarketWatch 666.
This week we’ll look at sales of previously occupied homes, which unexpectedly slipped more than one percent in June… Some think it’s the effect of higher interest rates, but there’s not enough evidence in the data, which showed even higher prices, to pinpoint a cause.. Then we’ll look at the census report on sales of new homes, which some think were at a 5 year high, and explain that Census doesn’t even know if they rose or fell in June… Finally, we’ll look at new orders for durable goods, which appeared to be up more than expected in June, and find that once we strip out the orders for aircraft, new orders for other durable goods put up a goose-egg…
Sales of Previously Occupied Homes
 Two of the widely watched reports this week were on June sales of houses. The first we’ll look at is on sales of previously owned homes from data provided by National Association of Realtors (NAR) and is based on home sales data from a representative sample of 160 MLS Boards. The NAR reported that existing homes sold in June at a seasonally adjusted annual rate of 5.08 million, up 15.2% from the 4.41 million-unit rate of last June but down 1.2% from the 5.14 million rate homes sold at in May, which was revised from the 5.18 million pace originally reported.. Sans the annualization and adjustments, 501,000 actual home sales were reported for June, down from 514,000 in May, but up from 463,000 homes that sold in June of last year.. Completed transactions on single family homes accounted for a seasonally adjusted 4.50 million of the annualized total, and these were also down 1.1% from May but up 14.5% from a year ago.. The adjacent graph from Bill McBride shows the annualized sales rate that NAR reports plotted monthly since 1993; you can see that except for the spike in sales caused by the first time home buyer’s credit, home sales are still near the post housing bust high…
The median June sales price for all housing types, including townhomes, condominiums and co-ops, was at $214,200 nationally, up from $203,100 in May and 13.5% above the June 2012 median of $188,800. This marked the 16th consecutive month of year over year double digit median sales price gains, which had only occurred previously circa February 2005 to May 2006, at the height of the housing bubble.. The national average home sales price was at $261,100 in June, up from $251,100 in May and 9.6% higher than the $238,200 average of a year earlier. The median price for single family homes was at $214,700, up 13.2% from a year earlier, while the average sales price of a single family home was $261,600, 9.5% higher than the average selling price in June 2012. The pie graph below, from the NAR (pdf), shows June’s home sales by price range, with each slice representing the percentage of homes that sold in each price range…43% of homes sold in June for between $100,000 and $250,000, represented by the large violet wedge…
 So-called distressed sales, which includes foreclosures and short sales, amounted to only 15% of homes sold in June, down from 18% in May & the lowest since the NAR started tracking this metric in October 2008. Foreclosures, which accounted for 8% of all sales, were said to be selling at 16% below market value, whereas the short sales, accounting for 7% of sales, were selling for 13% less than similar properties which were not so distressed. With such discounted sales down from 26% of the total just a year ago, it’s clear that the reduction of cut rate distressed homes in the mix of homes sold has gone a long way in increasing both the average and median national home price metrics…
Except for a tiny pullback of 0.2% in March, June’s sales marked the first seasonally adjusted decrease in home sales since September of last year, as average interest rates on 30 year mortgages rose from 3.54% in May to 4.07% after the Fed’s talk of reducing their purchase of mortgage backed securities spooked the markets. It’s obviously difficult to quantify how much these increasing interest rates influenced home buying decisions; it’s even possible that the prospect of higher mortgage rates could have temporarily hastened buying. However, NAR chief economist Lawrence Yun opined that higher mortgage interest rates are affecting sales in high-cost regions of California, Hawaii and the New York metro area. Although the NAR does not report price data on individual cities, median and average home prices in the West were by far the highest in the country, at $282,000 and $325,600 respectively…
All-cash buyers accounted for 31% of home sales in June, down from 33% in May, though up from 29% a year ago, while individuals identified as investors accounted for 17% of transactions, down from 18% in May and 19% last June. Although the percentage of first time home buyers rose slightly from 28% in May to 29% in June, they still made up less than the the 32% of sales they accounted for last June, and much less than the normal 40% to 45% of the market they had previously accounted for. High home prices are said to be one of the factors holding back first time home purchasers, but anyone who’s been paying attention knows there’s a number of other reasons limiting new household formation, the most obvious of which is the already high debt load from student loans young people are carrying, even if they should get a decent paying job after graduation.
There were 2.19 million previously owned homes remaining on the market at the June, which NAR reports is a 5.2 month supply at the current sales rate, up from the 5.0 month supply they reported last month.. This is a closely watched figure, with some even considering it so important as to report on it weekly, despite the fact that it does not include bank owned foreclosed homes held off the market or any other shadow home inventory. However, this low supply of homes is accelerating sales for those that are offered; the median time homes were on market was 37 days in June, down from 41 days in May. Previous NAR releases have consistently blamed tight inventory for lower sales and higher prices, but that rhetoric was absent from this month’s press release; rather, this month they present a narrative of previously underwater homeowners wanting to sell at these higher prices and others waiting for further price appreciation before they sell…
Census Report on Sales of New Homes
The other June housing report released this week was an estimate of new single family homes sold (pdf) from the Census Bureau, a report which typically has the largest margin of error and is subject to the largest revisions of any census construction series, with the sample data collected from voluntary questionnaires at just a small sampling of permit offices. Nonetheless, this and other widely followed census residential series are almost never reported with the caveat that they’re inexact and error prone, and since they’re believed to influence policy, we must continue to explain what little data they reveal.
According to the Census, June sales of new single family homes were estimated to be "at a seasonally adjusted annual rate of 497,000, 8.3 percent (±20.5%)* above the revised May annual rate of 459,000", which means that new home sales could have been down 12.2% from May’s sales, or up 28.8%. Furthermore, that range is the 90% confidence interval, which means that census figures there’s even a 1 in ten chance that sales were down more than 12.2% or up more than 28.8% in June. To put numbers on it, it means that census is just 90% confident, that if the pace of new home sales they’ve estimated in June were to be extrapolated throughout the year, somewhere between 436,366 and 640,136 homes would be sold, and there’s a 1 in 10 chance that the annual rate of sales would fall outside that range. The year over year change has a similar wide range of possibilities; at "38.1 percent (±22.0%) above the June 2012 estimate", it means census believes there’s a 90% chance that home sales rose between 16.1% and 60.1% since June of last year. Policy makers might get better odds at Vegas…
Before the adjustment and extrapolation, the actual estimate of new homes sold in June was 48,000; which was up from the revised May estimate of 43,000, which in turn was reported last month as 45.000 homes sold, resulting in a 17,000 downward revision in the annualized May rate.. April’s estimated sales were also revised down, from the 46,000 revised figure of last month to 44,000, while March sales were revised down from the earlier estimate of 42,000 to 41,000, meaning the net downward revisions in this report were as great as the headline sales gain, which many trumpeted as the highest level of sales in 5 years. Of the estimated 48,000 homes sold in June, an estimated 18,000 were not yet started, 16,000 were under construction, and 13,000 were completed. After the release of this report, housing economist Tom Lawler poured over the 2nd quarter results of the top seven US homebuilders, and in noting a large number of cancellations, opined that there is a good chance that these home sales estimates for last quarter will be revised downward, and that the bulk of the downward revision would be in June sales.
Census also reports here that the median price of all new homes sold in June was $249,700, which was down from the $263,900 median sales price in May, while the average sales price was $295,000, down from May’s average of $307,800. However, those figures are also variable and subject to fluctuating revisions; for instance, April’s average sales prices was originally reported as $330,800 on the strength of sales of 4000 new homes for over $750,000; that has since been revised to show just 2000 homes in that highest price bracket, but April’s average sales price has now been revised upwards to $336,800..
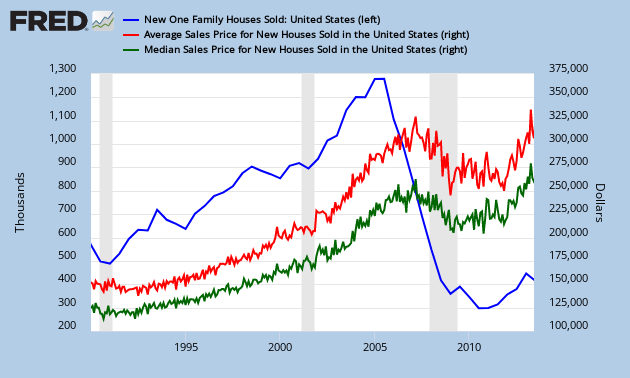
Our FRED graph for this report, above, shows the median monthly new home sales price since 1990 in green, and the monthly track of the average new homes sales price in red. In blue, we’ve chosen to show the annual rate of new home sales at a the average semiannual rate rather than monthly, to smooth the monthly revisions and eliminate some of the noise in the monthly series. Note that the dollar scale for home prices is on the right of the graph, while the annual home sales rate in thousands is on the left. Clearly this year-to-date’s new home sales are above those of the past 4 years, and according to current census data, at the highest rate for a first half year since 2008.
New Orders for Durable Goods
The other major report of this past week was the June Advance Report on Durable Goods Shipments, Inventories and Orders, which is usually watched for the forward looking new orders metric, and which showed that new orders for durable goods rose a seasonally adjusted $9.9 billion in June to $244.5 billion, a headline gain of 4.2%, which was better than forecasts. But that’s where the positive news ends, because the gain was largely driven by orders for new aircraft, which as we’ve previously seen, causes large month to month fluctuations in this report as Boeing’s order book rises and falls. New orders for non-defense aircraft, which is largely a proxy for Boeing’s orders, rose from $20,750 million in May to $27,267 million in June, a gain of 31.4%, while orders for defense aircraft increased 18.7%, from $4,303 million to $5,107 million. These, combined with a small 1.3% increase in orders for motor vehicles and parts from $44,758 million in May to $45,340 million in June meant that orders for transportation equipment were up $9.9 billion all by themselves, meaning excluding transportation equipment, new orders for durable goods were flat. In the first half of 2013, total new durable goods orders were 3.7% ahead of the same period in 2012, while excluding transportation, new orders had gained just 1.6% over last year…like retail sales, these estimates are not adjusted for price changes…
New orders for capital goods, which includes everything from construction and farm equipment to computers and electromedical instruments, were up 9.0% month over month, from $95,064 million in May to $103,596 million in June, but again this measure of investment grade equipment includes aircraft and total defense industry orders, which by themselves rose 35.2%, from $8,874 million to $11,995 million. Orders for what are called core capital goods, or non-defense capital goods excluding aircraft, are considered a fair proxy for business investment plans, and June saw core capital goods orders rise 0.7%, from $69,013 million to $69,526 million.. Orders for machinery were up 2.4%, from $34,572 million to $35,392 million, but orders for computers and electronic products fell 2.6%, from $22,239 million in May to $21,661 million in June. In addition, new orders for electrical equipment, appliances,and components were off 1.8%, from $10,712 million to in May $10,519 million in June…

Our FRED graph for this report, which starts in January of last year, shows the overall monthly percent change in new orders for durable goods in red, and the percent change without transportation industries in orange. We clearly see the large collapse in overall orders last August, precipitated by the cancellation of a large Boeing order from Quantas, followed by a Boeing orders driven spike in September, while the change in bookings less the volatile transports, shown in orange, have stayed in a narrow range throughout the period In green, we’re showing the change in new orders less defense orders, another albeit smaller volatile sector…lastly, in blue, we have the change in new orders for non-defense capital goods less aircraft, aka “core capital goods”. We can see that changes in that key investment sector are virtually oblivious to the overall change in new orders…
In the other metrics covered by this report, seasonally adjusted shipments during June slipped a bit, to $229,757 million, from $229,773 million in May. Shipments of machinery fell 1.2% from $34,624 million to $34,217 million and shipments of civilian aircraft and parts fell 6.3% from $12,637 million to 11,840 million, while shipments of vehicles and parts rose 1.3%, from $44,564 million in May to $45,161 million in June.. Shipments of core capital goods increased from $212.6 billion in the first quarter to $221.4 billion in the 2nd quarter, so that 4.1% increase should make a small contribution to the private investment component of 2nd quarter GDP, which will be released next week. Unfilled orders at the end of June increased $21.4 billion or 2.1% to $1,029.4 billion following a 1.2% May increase in unfilled orders. leaving the order books at the highest level since the current durable goods series started in 1992. Total inventories of durable goods at month end were up 0.2%, to $377,959 million from $377,274 million at the end of May. With May inventories unchanged and April inventories up a similar 0.2%, the contribution from durables inventories to GDP will be minuscule…
The caveat we should leave you with is like all "advance" reports, this report on durable goods is based on preliminary data and will be subject to revision as soon as next Friday, when the Full report on Manufacturers’ Shipments, Inventories, and Orders will be released. This is a larger survey panel, also known as "Factory Orders", that polls companies representing approximately 60% of manufacturing output. But even that is subject to revision as more complete information becomes available next month, and again in annual benchmark revisions each year. The bottom line is that none of this data is as precise as the given dollar amounts in six significant digits would lead us to believe…


Meanwhile, unearned income and speculative income continues to rise? I would expect a further concentration of wealth at the top as this type of income is favored through an unjust revenue system and legislation that favors financialization and debt leverage over wealth creation (labor is always and forever required in wealth creation) – go rentier class – it’s all stacked in your non-wealth producing sector – the squeeze on the rest of us still continues.
I guess time will tell if June sales were helped by the specter of increasing mortgage rates. I wonder what the drop off in sales from May means.
I thought housing was all set to boom, or something?
And here we have statistics showing everything is going sideways or something.
Confusing!
Until you remind yourself that they are just BS-ing about spending on capital goods. Because those cap goods are imports. Imports from abroad, run by our own turncoat international corporations still trying to have their cake and eat it too. These stats have very little to do with the reality 99% of us face.
if it were really going sideways, that would be healthy…it would indicate people are buying houses to live in, and moving to a new one only when they need to move…
i accidentally viewed a few minutes of TV this afternoon, and what i saw was reminiscent of the old “flip this house” shows that were ubiquitous during the boom; a real estate agent was advising how much could be made by buying & later selling a certain house…
the new home sector is the only one that is economically critical, and we’re getting mixed uncertain signals from that; last week census estimated new home starts were down 9.9%; this week new home sales are estimated up 8.3%, but both reports have the magic asterisk leading to the footnote that says Census is “uncertain whether there was an increase or decrease” month over month…
starts and sales arent comparable anyway, because starts includes multi-family units, as well as owner built homes, neither of which are included in sales figures..