Lambert here: It sounds like the author is arguing for what David Graeber called “everyday communism,” where, for example, when you ask a stranger for directions to the Post Office, they give them to you. Of course, the neoliberal model, where the stranger would charge you for the service, is both more efficient and a better reflection of human nature. Nevertheless….
By John Helliwell, Arthur J.E. Child Foundation Fellow of the Canadian Institute for Advanced Research. Originally published at VoxEU.
Much research and policy discussion over the past decade or two has argued for measures of wellbeing that are broader than the indicators of income and wealth previously used as the primary measures of human and social progress (e.g. Stiglitz et al. 2010, OECD 2013). There has also been a surge of interest in the measurement and welfare analysis of what is, in many countries, growing inequality of income and wealth (United Nations 2013, Atkinson 2015). But discussions about the measurement and consequences of inequality have thus far been focused mainly on the distribution of income and wealth, both within and across countries (Atkinson and Bourguignon 2014, Piketty 2014). Even where attention has been paid to other forms of inequality – for example, based on ethnicity, gender, health, or education (Putnam 2015) – little has been done to compare the sources or measure the relative importance of these diverse types of inequality.
If subjective wellbeing provides a better measure of welfare than that provided by income and wealth, should inequality in the distribution of subjective wellbeing not provide a superior measure of inequality? Should it not also be expected to reveal the combined consequences of various sorts of inequality?
What Do the Data Tell Us About Happiness Inequality?
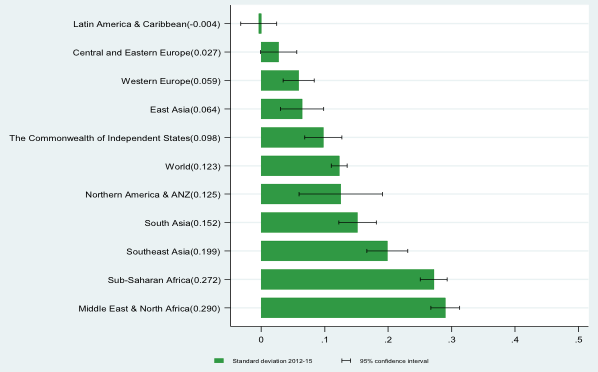
National and global sources of data on subjective wellbeing are gradually being improved, making it easier to understand the relative importance of many aspects of life. The better of these measures – those with sufficient richness of response categories, such as the World Happiness Report Update (2016) – can be used to measure the inequality of the distribution of satisfaction with life as a whole. What do these data show about the levels and changes in happiness inequality? Figures 1 and 2 (from Helliwell et al. 2016a) show the levels and changes of wellbeing inequality, as measured by the population-weighed standard deviations of answers on a 0-10 scale, of individual evaluations of life satisfaction, averaged for the years 2011-2015, for the world as a whole and for each of ten geographic regions. Wellbeing inequality is lowest in Western Europe and South-East Asia, and highest in Latin America, the Middle East, and North Africa. Figure 2 shows the average changes for the world and the same ten regions, from 2005-2012 to 2012-2015. Inequality has grown significantly for the world as a whole and for eight of the ten global regions (the exceptions being Latin America and Central and Eastern Europe). The largest increases in wellbeing inequality have been in sub-Saharan Africa, and in the Middle East and North Africa.
Figure 1. Inequality of happiness by global regions, 2012-2015
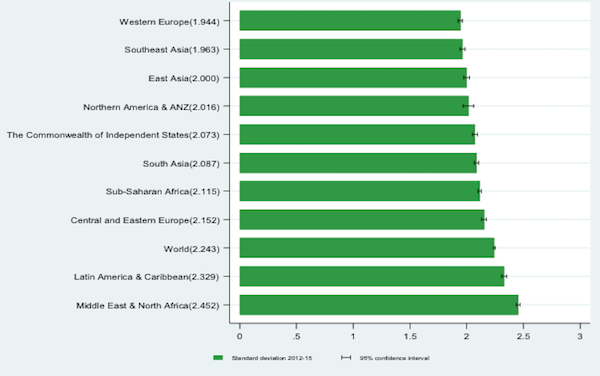
Figure 2. Changes in the inequality of happiness by region, 2005-2011 to 2012-2015
Sub-national measures of the inequality of wellbeing are only possible in those relatively few countries (the UK and Canada among them) that have population-based surveys large enough to show both average wellbeing and how the inequality of its distribution varies among different populations, communities and regions. Evidence from three international datasets (the World Values Survey, the European Social Survey, and the Gallup World Poll) has recently been used to show that wellbeing inequality, as measured by the standard deviation of life satisfaction responses within the sample populations, strongly outperforms income inequality as a predictor of life satisfaction differences among individuals (Goff et al. 2016).
Two sorts of evidence were used in that paper to support the conclusion that this correlation has causal significance. First, the estimated effects of wellbeing inequality on life satisfaction are significantly larger for those individuals who agree with the statement that income inequalities should be reduced. That this interaction applies for wellbeing inequality but not income inequality provides further support for the theoretical preference for wellbeing inequality as an indicator of life satisfaction.
Second, additional support for the importance of wellbeing inequality is shown by the fact that it performs much better than income inequality in one of the key causal roles previously found for income inequality – as a factor explaining differences in social trust. Evidence for a central trust-causing role for income inequality is provided by Rothstein and Uslaner (2005). However, Goff et al. (2016, Table 6) have recently shown, using all three international datasets, that income inequality is strongly dominated by wellbeing inequality as a factor explaining individual differences in social trust.
The Inequality-Reducing Power of Social Trust
The importance of social trust as a powerful lever to reduce wellbeing inequality has been illustrated by recent research showing that the wellbeing costs of several sorts of adversity, including unemployment, health problems, and being a member of a group subject to discrimination, are significantly lower for those with above-average levels of social trust (Helliwell et al. 2016b). Taken together, these resilience-providing channels between social trust and wellbeing offset more than one quarter of the combined damage from the three unfavourable events, reducing it from 2.2 points to 1.6 points on the 0 to 10 scale of life evaluation. The gains from social meeting with friends are also reduced by roughly one quarter. These four channels together account for almost one third of the total benefits of high trust for subjective wellbeing. Of course, social trust will continue to have most of its total positive effects on the wellbeing of the large majority of the population who are employed, in good health, and are not members of groups thought likely to be subject to discrimination. But the per capita effects are much larger for the disadvantaged – social trust has much greater proportionate advantages for those who are subject to ill-health, unemployment and discrimination. Thus the wellbeing gap between the advantaged and disadvantaged, in terms of employment, health and discrimination would be significantly narrower if trust levels were generally higher. Therefore, increases in social trust would not only raise average levels of wellbeing, but would also reduce inequality in wellbeing by raising wellbeing more for the disadvantaged than for the rest of the population. This previously unnoticed link between social trust and individual-level resilience suggests that increases in social trust can have an asymmetrically large role in reducing wellbeing inequality and reducing the misery of the least advantaged. This is because the incidence of all three types of adversity is significantly higher among those at the lower end of the distribution of wellbeing.
The inequality-reducing power of social trust is just one channel through which social trust improves overall wellbeing. If the wellbeing effects of higher social trust are compared to the wellbeing effects of higher incomes, for example, this ratio can be used to estimate the value of social trust as a component of national wealth. Based on the income-equivalent values of social trust in Helliwell et al. (2016b), Hamilton et al. (2016) have estimated that the wealth embodied in social capital averages about 20% across 132 countries, with a structure and distribution quite different from those of physical capital. These estimates reflect values above and beyond what social trust contributes to supporting incomes and health. Although social trust is an important component of total wealth in all regions and country groupings, there are nonetheless big variations within and among regions, ranging from as low as 12% of total wealth in Latin America to 28% in the OECD.
There is also evidence from sub-national analysis that regional- or local-level inequalities in wellbeing are empirically as well as theoretically preferable to measures of income inequality. This is shown by Goff et al. (2016, Table 5), who show that subjective life evaluation data from the Gallup-Healthways US daily poll are much better explained by interstate differences in SWL inequality than by the corresponding measures of income inequality.
More recently, regional-level data in the UK have been used to show that differences in wellbeing inequality (measured in this case by mean distance rather than the standard deviation) perform better than differences in income inequality as correlates of regional differences, in the proportions of voters voting for the UK to leave the EU (What works wellbeing 2016).
Concluding Remarks
Given the widespread interest in the sources and consequences of inequality, the emerging evidence supporting the validity of measuring wellbeing inequality, and the growing availability of large samples of wellbeing data within an increasing number of countries, the time seems ripe to pursue the research and policy implications of wellbeing inequality, and to analyse in more depth the extent to which the substantial effects of social trust on wellbeing are due to its role in moderating the inequality of wellbeing.
Author’s note: This note draws on research with several co-authors whose contributions have been fundamental. On the importance of measuring well-being, Richard Layard and Jeff Sachs, co-editors with me of the World Happiness Reports. On the measurement of both happiness inequality and the role of trust as a support for well-being, and on the link between social capital and happiness inequality, Haifang Huang and Shun Wang. Leonard Goff and Guy Mayraz were key collaborators on assessing the welfare consequences of well-being inequality, and Kirk Hamilton and Michal Woolcock collaborated to use trust measures to implement social capital into global wealth estimates. My deep thanks to all, and to the Canadian Institute for Advanced Research for continued research support.
References
Atkinson, A B (2015), Inequality: What can be done?, Cambridge, Harvard University Press.
Atkinson, A B, and F Bourguignon (2014), Handbook of income distribution. Vols. 2A & 2B, Elsevier.
Goff, L, J F Helliwell, and G Mayraz (2016), “The Welfare Costs of Well-Being Inequality”, NBER Working Paper no. 21900.
Hamilton, K, J F Helliwell, and M Woolcock (2016), “Social capital, trust and well-being in the evaluation of wealth”, in K Hamilton and C Hepburn (eds.), Wealth: Economics and Policy, Oxford University Press, forthcoming.
Helliwell, J F, H Huang, and S Wang (2016a), “The distribution of world happiness”, Chapter 2 of J F Helliwell, R Layard, and J Sachs, World Happiness Report Update 2016, Sustainable Development Solutions Network.
Helliwell, J F, H Huang, and S Wang (2016b), “New Results on Trust and Well-Being”, NBER Working Paper no. 22450.
OECD (2013), OECD Guidelines on Measuring Subjective Well-being, OECD Publishing.
Piketty, T (2014), Capital in the 21st Century, Cambridge, Harvard University Press.
Putnam, R D (2015), Our kids: The American dream in crisis, New York, Simon and Schuster.
Rothstein, B, and E M Uslaner (2005), “All for all: equality, corruption, and social trust”, World Politics, 58 (1), 41–72.
Stiglitz, J E, A Sen, and J P Fitoussi (2010), Report by the commission on the measurement of economic performance and social progress, Commission on the Measurement of Economic Performance and Social Progress.
United Nations (2013), Inequality matters, UN Department of Economic and Social Affairs.
What works wellbeing (2016), “What wellbeing inequalities tell us about the EU Referendum result”, whatworkswellbeing.org, July.


When a manager, an immigrant from Sri Lanka, once asked me why black americans are so angry, despite having more sneakers and appliances than black africans, this was basically my answer to him.
He understood.
White americans, not so much.
Oh dear. Though trying to make valid points, this study falls into the usual holes: the key one is that the data all appear to be Likert-based self-reported happiness scales, which in two major countries (at the very least) have been shown to be deeply misleading (US and Australia). In short, even within these two countries, there are cohort and/or longitudinal effects: the number you state your happiness/life satisfaction to be is heavily dependent upon age (particularly if you are older), independent of (after adjusting for) a huge number of other factors (health, wealth, social empowerment, independence, etc). Moreover this is not “just” the infamous “mid-life dip”: the differences between such measures, and the more comprehensive well-being/quality-of-life ones, are particularly stark in extreme old age and have big implications for retirement age, what resources are needed by the very old etc.
To make comparisons across countries with different cultural backgrounds seems even more hazardous – Likert scales generally were pretty much discredited on such grounds by 2001:
Baumgartner H, Steenkamp J-BEM. Response styles in marketing research: a cross-national investigation. Journal of Marketing Research. 2001;38(2):143-56.
Steenkamp J-BEM, Baumgartner H. Assessing measurement invariance in cross-national consumer research. Journal of Consumer Research. 1998;25(1):78-90.
I have put up a short piece on my blog giving further details and reference to the US study.
The contribution of trust toward a broad measure of well-being was quantified by me in a large study when I lived in Sydney: in Australia it is basically the case that a lack of trust in those in the local community has a pretty huge (11%) detrimental effect to your quality of life in Sydney but a much smaller, though still significant (5%) effect elsewhere in Australia.
I wish these Likert-based happiness surveys would cease. They really don’t help the field, when much better alternatives are already in routine use.
There’s but one basic flaw in the “solution,” trust has to be earned and the people needing to earn the trust don’t seem to give a damn about the rest of us. The odds of them lifting a finger to earn the trust of the hoi polloi is nil, at best.
http://solari.com/articles/popsicle_index/
Catherine Austin Fitts; the results are by subscription, but, the methodology is what is important.
The Popsicle Index is a great way to look at the world.