Yves here. One quibble is that this post does not acknowledge how the headline unemployment rate, U3, has changed over time. It excludes discouraged workers. As a 2017 post in Quartz, If the US unemployment rate included everyone who says they want a job, it would be nearly double, pointed out:
As measured by the BLS, the unemployment rate is defined as the percentage of unemployed people who are currently in the labor force. In order to be in the labor force, a person either must have a job or have looked for work in the last four weeks. A person only needed one hour in the prior week to be considered employed.
This leaves out a ton of relevant people. According to the November 2016 data, over 5.5 million Americans said they want a job, but don’t have one, and are not considered a part of the labor force. If these people were included in the unemployment rate, it would jump to 8.2%.
Having said that, there have been signs of improvement. For instance, in 2017, the number of people who were in part time jobs but wanted full time work declined by 858,000.
By NewDealDemocrat. Originally published at Angry Bear
For the last several years, I have tried to identify several graphs that most bear watching over the ensuing 12 months. This year, in addition to watching bond yields like everybody else, the data that most bears watching, it seems to me, can be summed up in the question: Is the US economy about to enter a Boom?
The recent economic news has almost all been good. In particular the unemployment rate has dropped as low as 4%. Meanwhile, the GOP certainly believes — I most certainly don’t — that the recent tax changes are going to unleash a torrent of Capex spending and wage increases (as opposed to mergers, acquisitions, stock buybacks and executive pay bonanzas).
So, is the economy on the verge of firing on all cylinders?
There is no standard definition of a Boom. But since I am a fossil, in my lifetime I have experienced two times when it certainly felt like the economy was working extremely well and on a very broad basis: the 1960s and the late 1990s tech era. The “good times” feeling of both eras was palpable. Employment was rampant and average people felt that their situations were going well.
What distinguished those to eras from all the other economic expansions? I found five markers that stand out, and two that, oddly, didn’t.
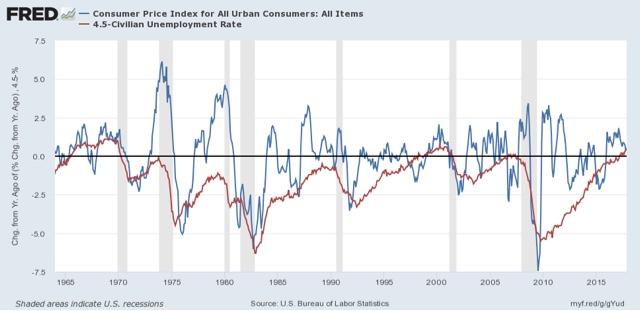
Let’s start with the first marker: the unemployment rate (note that the U6 underemployment rate wasn’t reported in its current configuration until 1994, and so is not helpful). In both the 1960s and the late 1990s, the unemployment rate hit 4.5% or below for extended periods of time:
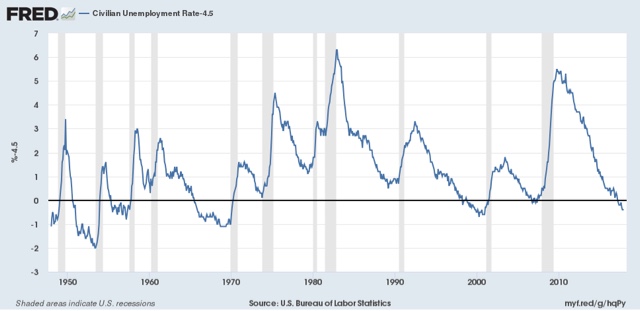
>While these weren’t the only two periods of low unemployment, they are among those that stand out, in particular vs. the 1970s and 1980s, none of which expansions hit such a low mark.
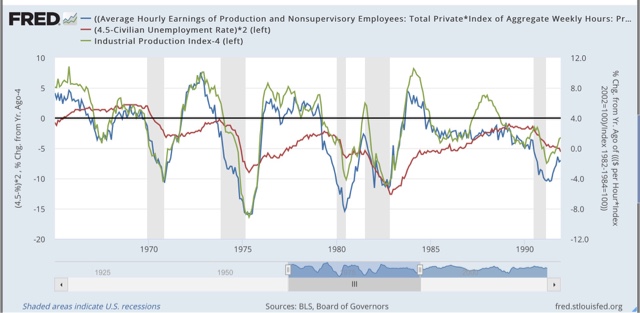
Now let me examine the two markers that didn’t make the cut. You would think that industrial production and capacity utilization would be making strong new peaks during Booms vs. other expansions. But that isn’t the case. industrial production (blue, left scale below) has made new peaks during each expansion, while capacity utilization (red, right scale) has been relentlessly declining:
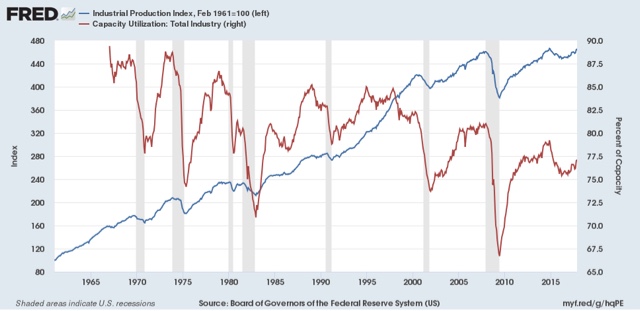
What does stand out at least somewhat is the duration and rate at which industrial production grew during both Booms. During both the 1960s and 1990s, production grew at or over 4% a year for extended periods of time, not just right after the end of a recession
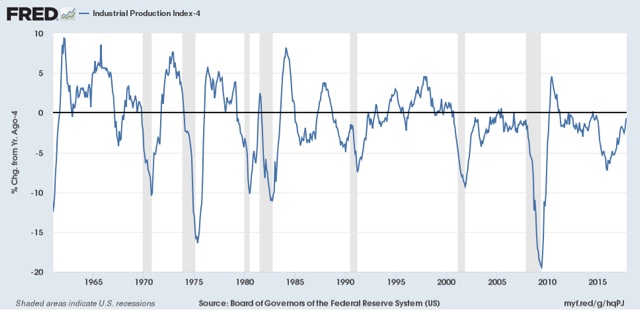
So the rate of growth of industrial production is the second marker of a Boom.
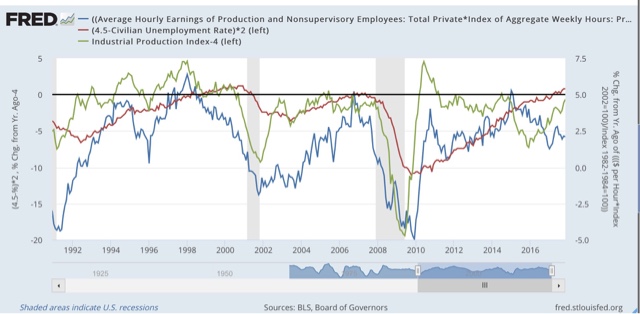
The third and fourth markers iare the rate of growth of real average earnings for non-managerial employees, both individually and in the aggregate. During the two Booms, in contrast to other expansions, real average hourly earnings also grew at roughly 1% YoY or better:
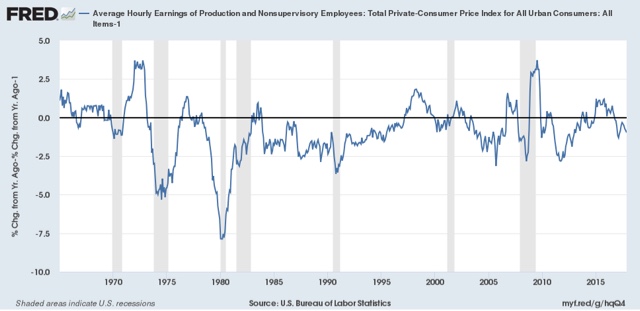 <
Meanwhile, real aggregate earnings grew at a rate of 4% YoY or better:
<
Meanwhile, real aggregate earnings grew at a rate of 4% YoY or better:
Here’s what three of those markers look like when put together in one graph:
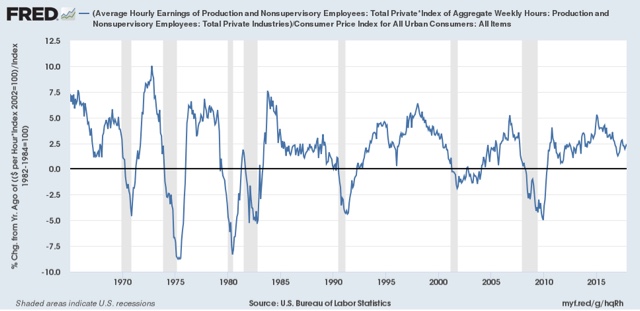
The fifth and final marker of a Boom — probably as the byproduct of the first four — is an increase in the YoY rate of inflation:<
So, to summarize, when they occur together, the five markers of an economic Boom are the following:
1. An unemployment rate under 4.5%< 2. YoY industrial production growth of at least 4% 3. YoY real wage growth of at least 1% 4. YoY real aggregate wage growth of at least 4%
5. Increasing YoY inflation.
As we begin 2018, only the first and last markers are present: we have low unemployment, and at least temporarily, the YoY inflation rate is higher than it was a year ago. But industrial production is not growing as fast as either of the last two Booms, and real wage growth has continued to be lackluster.
Based on my lieffetime experience, while the US economy is currently doing pretty well in general, it is not anywhere near a Boom, at least not yet.
I’ll continue to track these indicators during 2018.


I thought that I knew a bit about economics but my reading the NC has out paid to that little illusion. I no longer even know what the purpose of taxation is in a modern economy. Nonetheless, I will have a go here so I hope people will excuse my ignorance.
When we talk about the US economy we talk as if it was a homogeneous whole but what if it was not? Let me illustrate. Think of the US economy having the shape of an hour-glass. It’s not as it would be a very warpy shape but an hour-glass would be the only way that we could describe it as. The top bowl is where the economy appears to be going guns blazing. It is where the stock market is going to infinity & beyond, it is where the FIRE industries reside as well as our tech titans, it is where Trump’s tax bill will have the maximum benefit. The ever narrowing neck of this hour glass is the middle class – or what’s left of them as a few rise up to the top bowl while many more sink into the lower bowl.
The lower bowl is where the economy of most Americans reside. It is a hard scrabble with deteriorating services & infrastructure, of de-industrialization, of people who are no longer counted in the unemployment rolls, who receive food relief and bust their hump for minimal wages or even sub-minimal wages. So here is where I make my point.
If you try to use figures to describe the economy you are only hitting some of your targets. Talk about the Dow Jones Industrial Average, Nasdaq and the like and you are only capturing the data mostly from the top bowl. When you talk about the real unemployment rate and you are mostly capturing the data from the bottom bowl. You are never getting the full picture. I suppose that you could say what you choose to measure will be determine what results you get. I am reminded of the story of a man with his head in a freezer and his feet in a hot oven but the statisticians determined that on the whole that he was going quite well on the average.
The only story you need to understand how elites have destroyed labor power and sent the proles to painville is the share of profit going to workers.
Yes, as well as the disconnect between rising productivity and wage growth beginning in about 1980.
The hour glass is a great image; J D Alt could do a lot with it.
I like your analogy. I think most elite have their heads in the freezer.
Unemployment: There are bunches of collected rates, notably U3, U6, and NILF-WJN (Not In Labor Force-Want Job Now). NILF-WJN is a real statistic. Note also that there are also graphs of total employment, which counts how many people are actually working, and which are determined by what the economy is doing. You can generate graphs of many of these or their combinations. FRED can supply many of these.
Many of the 858,000 that now have ‘full time work’ don’t have a single full time ‘job’. This has always been an option. The massive debt among the middle poor and millennials has necessitated more and more part time jobs. I have three grandchildren that have five jobs between them. All work more than forty hours a week at their low wage ‘full time work’.
I have heard but don’t know how/ where to verify that folks over 55 are NOT included in labor stats. I do not know if this is true. I am 58, self-employed part time (would work more if I had it), and have taken pay cuts due to labor over-supply- all in these ‘hidden inflation’ times. You know, insane property tax increases (implies rents will go up) skyrocketing food & utilities, etc.
I used to have confidence that our kids would easily get work, that their timing, with the demographic wave of the boomers ‘retiring’, would make room for young workers. With the inverted pyramid of age/population, all the more strongly!
However, it seems that oldsters are working harder, longer, for more years, do not see retirement in their future. Also, automation of many facets of work adds a squeeze. Over-supply of labor.
Alternative economic indicators- whether it was borrowed or paid with cash- there are a lot of new cars on the road, a lot of cars on the road, period, a lot of devices in hands, a lot of tattoos, and a lot of people ‘consuming’ beyond groceries- so some folks seem to be managing. I live in a hard-winter northern rockies town, and I do not recall so many homeless, even through the winter. Perhaps there are more evident homeless as a simple extension of population growth- we are the third most populace nation in the world…
Anyway, would love to hear from anyone about the over-55 you don’t exist old-and-in-the-way rumor.
As much as ‘policy’ is created anymore, no doubt it will be flawed if a large chunk of US population is excluded statistically.
The data collected doesn’t have an age cut-off. Here is a link to 2016 annual average information from the Bureau of Labor Statistics: https://www.bls.gov/cps/cpsaat03.pdf
Jefe, thanks for your post. I’m 70, still working, with no financial possibility of retirement in sight for me. Luckily, I have a good job that pays well, but I don’t think I represent most 55+ workers.
Good post, thanks for this one.
I’d suggest one more chart to monitor. The labor force participation rate:
https://data.bls.gov/timeseries/LNS11300000
If you change the time-scale on this from 1948 to 2017, you’ll see that we saw more and more people participating in the formal economy up until the year 2000 or so. Then it dipped somewhat during the Bush II days, and fell quite sharply during the Obama days. We expected to see some drop-off because the sizable Baby Boomer generation is retiring from the workforce in greater numbers than the smaller Generation Z is entering it, but the Obama decline was twice as steep as you’d expect from demographics alone. Only recently has the labor force participation rate flattened out.
I don’t know what the labor force participation rate would be at “full employment” based on our current demographics, but I suspect we’re not there yet.
The “prime age labor participation rate” is chart to monitor (people 25-54 years old). It peaked in 1999 and the U.S. still hasn’t rebounded to the level before and during the financial crisis. FRED makes this chart available: https://fred.stlouisfed.org/series/LNS11300060
I’m as critical of the modern economy as anyone, but just looking at local indicators, the job market is more flush than it has been since the crisis.
That said, the jobs are crap.
Hence: and real wage growth has continued to be lackluster.
Same here in SW OR. I’ve lived here for 4 years and for the first time I’m hearing help wanted ads on the radio and seeing signs in shop windows.
Still nothing like the late 90s when I was in tech and they paid us bonuses not to leave to start an internet firm.
The Corners With Beggars (CWB) ratio has been steadily increasing in my semi rural Northern California neighborhood. I now see multiple panhandlers near both Safeway and Walmart. Recently the Mothers With Children (MWC) and Whole Families (WF) charts are rising also. The increases began after 2007 and have slowly crept up ever since. When I read headlines like Economy Improving I have begun to ask myself, Whose Economy?
One aspect of homelessness i’m seeing more of that didn’t exist previously, is single homeless women.
We’re too far from the beaten path to attract homeless as of yet, but I expect it to happen sooner rather than later. Aside from coming up with money for food & libations-which would be a tall order, there are hundreds if not a thousand hidey hole locations you could hang out here, and nobody would know.
My observation as well with respect to CWB (I’m stealing that), in my very upscale, but in-town neighborhood. The busiest thoroughfares have two per corner, with another at each median. I try to have a few bucks in my purse for the inevitable grocery store panhandling as kids and groceries go in the car.
I have also noticed that many of the people at CWB look neat, clean, organized and not in that bad of shape. In other words, they are not the typically “unwell” homeless person. And I hear people pick on them for not “getting a job”.
We have found people passed out in the alley where I used to make my kids take the trash out. I am assuming there are needles and other nasty things back there now because there is shade and a bit of a shelter from the elements. There is all kinds of human detritus along the urban trail system in our neighborhood – suitcases, clothing, food, baskets of junk. I am always amazed that I seem to be the only person in my social group worried about what is going on literally in our own backyards. The typical reaction is to “call the cops” not “what can we do to figure out how to fix what is going on here?”.
This is in a neighborhood described as “idyllic” and “family friendly”. I guess for some people.
The Corners With Beggars (CWB) is higher in SoCal, Santa Ana and Santa Ana River banks than I remember.
My data points are:
Lagos Nigeria 1953 to 1964 CWB was an career for families.
UK 1960 to 1971 – counts were zero.
ZA Joberg 1971 to 1978 – Less than Lagos,
US 1980 to 2000 – Close to zero
US 2000 -2012 – Increasing on busy intersections
US 2113+ Explosion in numbers, Santa Ana downtown and Santa Ana River banks.
A lot of CWB here in SW OR (Medford) as well. Has always been bad the 4 years I’ve been here, doesn’t seem to have gotten much better
It is not easy to discern where the advances, that this statistic purportedly uses to show a beneficial decrease in the number of part time jobs, ended up.
Full blown cynic that I am, I see additional citizens not being counted as being not in the labor force. I too see signs around to hire, but, even a rise to $15/hr by 2020, as Target promises, is neither a panacea now nor a solution 2 years down the road.
Apparently recessions happen every 11 years or so, so there is some chance that we are already at the top of the boom, and that a new recession is coming.
Just saying.
Recessions are aperiodic.
We need a “job quality” index as well.
– Percentage wise, how many people are in good quality jobs? A good quality job is one that pays a middle class wage or more, has full time hours, and pays benefits.
– For those employed, have their wages kept up with the cost of living (ex: rising costs of food, housing, transportation, and other necessities)?
– For those with benefits, have they been reduced? An example of a reduction is that defined benefit pensions are almost unheard of now outside of the public sector.
– How stable are these jobs? In the US and Canada labour laws a weak. Red States in the US have laws comparable to that of a developing nation. That leads to lower earnings and more anxiety. There is also the matter that aggregate demand is pushed down from this. Finally the rationale for this is that it will lower unemployment which seems to be a dishonest justification considering the unwillingness of neoliberals to end austerity.
– Another is unpaid overtime and missed vacations. Employee wage theft should also be considered.
I think that we are going to find that if we find a way to quantify this that jobs are facing rapid crapification, at outside of a few rich finance people, techies, and executives.
Maybe the unemployment rates are lower, but the jobs are getting worse.
Such a study might look something like this one:
http://www.statcan.gc.ca/daily-quotidien/161205/dq161205a-eng.htm?HPA=1
‘You would think that industrial production and capacity utilization would be making strong new peaks during Booms vs. other expansions. But that isn’t the case.’
Definitely not. As this FRED chart illustrates, manufacturing has fallen to a pitiful 11.5% of the economy:
While manufacturing remains an exquisitely sensitive economic indicator, strong industrial production and capacity utilization are not necessary conditions of a boom in a post-industrial services economy.
What do Apple, Amazon, Alphabet, Facebook and Microsoft manufacture? Nothing heavier than phones. And the majority of their revenue is from entirely weightless services.
Call this boom lacklustre … but this year and possibly next are as good as it gets, as Bubble III goes supernova and then shatters like fireworks across the purple sky.
Gates’ friction-less capitalism, but, then whom argued it was earned and such the dominance an exemplar of markets in action.
I did not find the word ‘debt’ in the above piece – IMO any such epistle which fails to mention private-sector debt loads and place them in a historic context is not worth reading. But, I read it anyway, and applying Yves’ caveat about the bogusness of latter-day gerrymandered unemployment metrics, the author’s “low unemployment” goes away, leaving him with just one of five, inflation-according-to-official-metrics, whose current uptick may prove to be brief.
Wildly price-inflated asset markets of all kinds as the “everything bubble”, the third and greatest in the recent series of central-bank-blown bubbles, approaches a crescendo, also do not bode well for any durable real-economic expansion.