By Servaas Storm, Senior Lecturer of Economics, Delft University of Technology, an economist who works on macroeconomics, technological progress, income distribution, economic growth, finance, development and structural change, and climate change. Originally published at The Institute for New Economic Thinking website
In what constitutes a volte-face, Lawrence Summers openly admits that monetary policy is ineffective in the current environment of secular stagnation and argues that what is needed instead are “efforts by governments to promote demand through fiscal policies and other means.” Summers and co-author Anna Stansbury write that they have come to agree with “the point long stressed by writers in the post-Keynesian (or, perhaps more accurately, original Keynesian) tradition: the role of particular frictions and rigidities in underpinning economic fluctuations should be de-emphasized relative to a more fundamental lack of aggregate demand.”
Pushing on a String
Summers and Stansbury are right in pointing out that the U.S. is suffering from a fundamental lack of demand. But they are wrong in believing that this is somehow only now showing up in a decline in the power of monetary policy to stimulate the economy. Monetary policy has never been robustly effective in promoting economic recovery or growth. While restrictive monetary policy, when credible, may be effective in slowing down economic growth and reducing inflation, this does not mean that monetary stimulus has the capacity to promote growth and raise inflation — if anything, post-2008 monetary policy experience provides an acid test of this asymmetry in policy effectiveness.
Most of the time, the macro-economic impact of monetary policy has been swamped by the effects of other factors. This is illustrated by Figure 1, which plots U.S. real gross fixed investment (as a percentage of GDP) against the long-term real interest rate during the period 1980-2018. The gross fixed investment ratio stayed rather close to the average of 19.5% of GDP during these 38 years — varying between a minimum of 16.9% in 1982 and a maximum of 22% in 2005-2006. The real interest rate exhibits much greater variation: from a high of 8.1% in 1984 to a low of ‒0.1% in 2012.[1]
It is worth taking a closer look at the data underlying Figure 1. As the real interest increased from 1.6% in 1980 to 8.1% in 1984, the investment rate increased. Then, during the years 1987-1993, both the gross fixed investment-GDP rate and the real interest rate declined; this was followed by a steady increase in the investment rate during 1994-2000, as the real interest rate kept hovering around 4%; and finally, during 2012-2015, the investment rate increased, while there was a modest rise in the real interest rate.
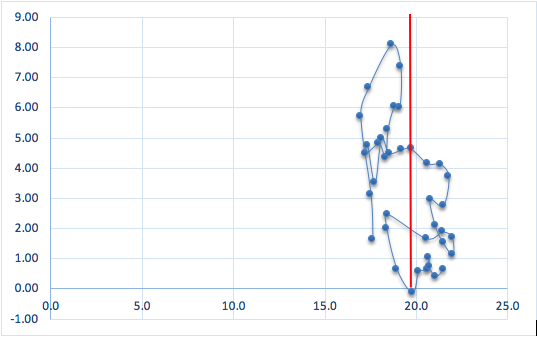
Figure 1, Real gross fixed capital formation (as a percentage of GDP) and the real interest rate: The U.S. economy (1980-2018) Source: Author’s construction based data from the AMECO database. The vertical red line gives the mean (19.5%) of the gross fixed investment to GDP ratio (1980-2018).
These patterns are not historical anomalies, but rather indicate that the macro-economic effects of monetary policy are normally overwhelmed by the influences of other factors, most notably (uncertainty about) changes in (future) aggregate demand. Recent econometric findings on U.S. business investment by IMF economists Kopp, Leigh, Mursula and Tambunlertchai (2019, p. 4) confirm this conclusion. The authors write that there “appears to be little unexplained component of business investment beyond the expected demand effect. Other factors, such as reductions in the cost of capital, thus appear to have played a relatively minor role.”
It is, therefore, quite mysterious how and why central bankers and the ‘scientists of monetary policy’, convening in splendid isolation in Jackson Lake Lodge or in central banks around the world, ever came to believe in the growth-promoting power of lowered interest rates. Monetary policy can pull, but not push. Central banks can merely encourage, but not compel, as Paul Samuelson (1948, pp. 353-54) already concluded — an old Keynesian policy truth which appears to have been all but lost on almost all those working on the modern ‘science of monetary policy.’
This is why many macroeconomists including Lance Taylor, Peter Bofinger and Mathias Ries, Daniele Girardi, Walter Paternesi Meloni and Antonella Stirati, Mario Seccareccia and Marc Lavoie, Barry Cinamon and Steven Fazzari and myself have long been emphasizing the overwhelming importance of aggregate demand to U.S. macro-economic performance, while at the same time arguing against the mistaken belief in the power of monetary policy as an instrument of macroeconomic stimulus.
When the Facts Change, I Change My Mind. What Do You Do?
Clearly, “there is no harm in being sometimes wrong — especially if one is promptly found out,” as John Maynard Keynes wrote in his obituary of Alfred Marshall. It took Summers almost a decade outside government to figure out how overwhelmingly important the shortage of aggregate demand is to U.S. macroeconomic performance — and it is only fair to ask: why now? Which factor prompted Summers to suddenly fundamentally change his position on the relative importance of monetary versus fiscal policy?
Summers’ U-turn appears to be motivated by a fear of the negative and destabilizing macroeconomic consequences of further interest rate reductions by central banks, and especially by the European Central Bank (ECB), which is currently charging commercial banks a penalty interest rate of 0.4% if they park surplus liquidity in Frankfurt; the ECB’s refinancing rate is zero. Outgoing ECB-President Mario Draghi has been preparing the ground to reduce the deposit rate by another 0.2 percentage points to ‒0.6% at the next ECB meeting in September. Crucially, the ECB’s main refinancing rate could drop to ‒0.20%. While this would mean that Eurozone banks can borrow at negative interest rates, the idea is that the ECB will only let banks borrow at negative interest rates provided they lend the money.
In effect, Draghi’s strategy amounts to a new round of Quantitative Easing by the ECB, which by forcing a depreciation of the euro relative to the U.S. dollar will likely motivate the Federal Reserve to lower U.S. interest rates as well. Summers and Stansbury are right in believing that such interest rate cuts, in combination with competitive devaluations, promote leverage and asset price bubbles and undermine macro-economic stability. Such a negative central bank rate may also bring down long-term interest rates and further erode banks’ interest rate margins. Eurozone banks are already paying more than € 7.5 billion penalty interest to the ECB, a part of which they are passing on their customers — mostly small savers who are becoming increasingly dissatisfied. Especially German and Dutch banks, pension funds and insurers are complaining that they cannot make money with inverted yield curves and when they get charged by the ECB to park money there. Summers’ sudden conversion to the gospel of fiscal stimulus may have a lot to do with ‘saving the banks’ and ‘preventing another financial crash’ — again using tax payers’ money, as in 2008-09.
But Wait a Minute: Isn’t the U.S. Economy at Full Employment Right Now?
Even so, Summers is still a relatively quick learner, compared to most establishment economists. To wit, University of Chicago’s ‘grumpy economist’ John Cochrane writes that his “jaw drops” at Summers’ supposedly ‘left turn,’ as he cannot understand why anyone can seriously be talking about “lack of demand” right now. After all, the official U.S. unemployment (measured by U-3) is 3.7%, lower than it has ever been since December 1969, labor force participation is trending back up and wages are rising (especially for less skilled workers). Hence, in Cochrane’s opinion, the U.S. economy is currently at full employment. Accordingly, slow GDP growth must come from too slow productivity growth, which he thinks is due to supply-side bottlenecks including over-regulation of labour and product markets, excessive taxation and red tape. His unsurprising ‘pro-growth’ agenda entails all the standard supply-side medicine: liberalisation, tax cuts and deregulation.
But Cochrane is wrong, because his diagnostics are wrong. Yes, the official measure of registered unemployment (U3) is at a historical low, but the broader unemployment measure (called U6), which includes ‘marginally attached workers’ (who without actively searching for a job, would however be prepared to work were some job available) and also part-time workers who work less hours than desired because of a lack of full-time jobs, is still 7% (in July 2019). Most significantly, the labor force participation rate (in July 2019) is about 63 percent, which is much below the 67 percent rate prior to the Great Recession. The U.S. economy still suffers from an underutilization of labour — which is clearly showing up in low (real) wage growth. Despite the ostensible ‘full employment,’ and never ending complaints that some can’t find workers, businesses continue to be super stingy, with average weekly real wages increasing by 0.8% during July 2018 to July 2019 (according to BLS data). No wonder that consumer confidence is dipping, inflation remains low, and U.S. economic growth is beginning to slow down, which taken together with the already mentioned ‘inverted yield-curves,’ may all well signal a looming recession. That the U.S. economy is operating at full employment is just too good be true.
The U.S. Economy Continues to Operate Well Below Capacity
Part of the problem is that the self-proclaimed ‘scientists of monetary policy’ are using measures of ‘full employment,’ based on faulty theoretical notions of ‘potential output,’ which is usually defined as the level of activity corresponding to the non-accelerating inflation rate of unemployment (or NAIRU). In theory, the NAIRU reflects the structural unemployment rate which comes with the steady-inflation (trend or potential) growth of the economy and which itself is fully determined by supply-side variables. While fiscal and especially monetary policy can be used to keep actual growth of the economy close to potential (trend) growth, these macro policy instruments cannot (in this theory, at least) permanently reduce the NAIRU and thereby raise potential output growth. NAIRU estimates are thus used to construct estimates of potential or ‘full employment’ output. For the U.S., the Congressional Budget Office (CBO) estimates the NAIRU to be 4.6% in July 2019. Because actual unemployment (at 3.7%) is lower than the NAIRU, it follows (in this narrative) that actual output must exceed potential output. The U.S. economy must be booming, in other words, and we should see wages rising and inflationary pressure building up.
This diagnosis beggars belief. Why it is wrong is not hard to understand. The reason is that the unobservable NAIRU is, in practice, estimated as some sort of (filtered) moving average of actual unemployment. This means that NAIRU estimates, instead of reflecting some long-run structural feature, follow movements in the actual unemployment rate. We know that actual unemployment in the U.S. came down and we know that official NAIRU-estimates mimic the actual unemployment rate, so the NAIRU came down as well. As a result of such ‘circular reasoning,’ the NAIRU-based estimates of potential output came down and the gap between (unobservable) potential output and actual gap narrowed — leading most observers to the wrong-headed conclusion that the U.S. economy is at full employment. We cannot base our notion of ‘potential output’ on such an analytically flimsy concept as the NAIRU (Storm and Naastepad 2012; Storm 2018). We need alternative indicators.
One important alternative estimate of potential output developed by Fontanari, Palumbo and Salvatori (2019), which does not rely on the mistaken NAIRU-notion, indicates that the U.S. economy (in July 2019) is nowhere near full employment. They estimate potential output based on data on actual unemployment using Okun’s Law and find (for 2019Q1) that U.S. output is still 2.4% lower than potential output (when using the U3 unemployment measure) and 3.6% below full-employment output (when they use the U6 unemployment measure). Crucially, their estimated output gap increases to almost 9% when the authors use annualized hours worked per person of the population aged 16-64 as their measure of labour underutilization. Taken together, these carefully empirically-grounded estimations of potential output testify that the U.S. economy continues to suffer from substantial slack in the system, and this is obviously consistent with continued low wage growth and low inflation.
One More Indicator of Underutilization
I want to bring in into the discussion another alternative indicator of utilization, one which is not based on observed unemployment, but on realized business profits (in the national accounting sense). Consider the following simple, but insightful, decomposition of the net profit rate of firms (ρ), defined as the real return on their invested capital:
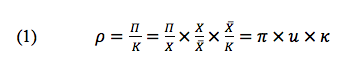
Here π = (Π/X) = the share of real profits (Π) in real Net Domestic Product (X), u = (X/X ̅) = capacity utilization, and κ = (X ̅/K) = the ‘normal’ (long-run) output-capital ratio. K is the net capital stock (at constant prices) and X ̅ is ‘normal’ (trend) output (measured as Net Domestic Product).
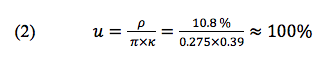
Let me illustrate this expression using data for the U.S. economy from the AMECO database of the European Commission.[2] Figure 2 presents the evolution of the U.S. macro net profit rate and net profit share during the period 1990-2018. The profit share has been trending up — from around 29% in the early 1990s to almost 32% in 2018. The net profit share hovered around 10% in the early 1990s, peaked at 11.6% in 2005 and is now around 11.3%. If I take the year 2000 as my base year, I can estimate capacity utilization in the following manner. First, in 2000, the profit share π equaled 0.275, which means that out of every U.S. dollar of value added generated by economic activity, 27.5% were profits, while the remaining 72.5% were wages. Second, the profit rate (defined as net profits per unit of net capital stock) in 2000 is about 10.8%; this is the average return made by shareholders who invested in the capital stocks of firms. Third, I assume that the ‘normal’ output-capital ratio κ is a long-run constant and takes a value of 0.39. Using these numbers, we can calculate capacity utilization u during the year 2000 as follows:
This means I am taking the high-growth year 2000, during which the official unemployment rate (U3) was 4.0%, the broad unemployment rate (U6) equalled 7.0%, and the labour force participation rate peaked at 67.1%, as my benchmark for ‘full employment.’
It is straightforward to see from equation (1) that the profit rate must increase, if the profit share rises under the assumption that there is no change in capacity utilization. And this is what happened in actual fact: years and years of (real) wage stagnation, when real wage growth was not allowed to grow in line with labor productivity, have resulted in a steady decline in the U.S. wage share and a steady rise in the profit share. According to AMECO data, the share of (net) profits in net domestic product of the U.S. rose by 4 percentage points: from 27½% in 2000 to 31½% in 2018. Keeping capacity utilization constant (i.e. u = 100%), this increase in the profit share would have pushed up the profit rate by as much as 1.5 percentage points — from 10.8% in 2000 to 12.3% in 2018. But according to the AMECO database, the profit rate in 2018 was ‘only’ 11.3% (one full percentage point below what it could have been if u = 100%). The reason is that capacity utilization declined in the early 2000s to 95% in 2007, to 88% in post-crisis 2009, to around 90% during 2010-13, and to 92% in 2018. The drop in capacity utilization by 8 percentage points (which reflects a secular shortage of aggregate demand post-2000) lowered the net profit rate of U.S. firms by one percentage point. On balance, business has seen its rate of profit increase over time, mostly by curtailing wage growth and raising the profit share — the accompanying demand shortage which is considerably hurting profitability, constitutes the collateral damage, which also includes the growing popular unrest and political instability.
When I follow the same procedure to estimate capacity utilization (u) using data from the Bureau of Economic Analysis (BEA), I obtain qualitatively similar results. According to BEA data, the U.S. net profit share increased by 2.9 percentage points during 2000 and 2018 and this pushed up the profit rate by 0.7 percentage points (keeping utilization constant). However, capacity utilization declined from 100% in 2000 to 88% in 2018, a drop of 12 percentage points. This lowered the profit rate by 1.1 percentage points. Accordingly, the U.S. net profit rate declined by 0.4 percentage points during 2000 and 2018, even when the profit share rose by 2.9 percentage points! Therefore, using BEA data, I find a trade-off between a higher profit share, on the one hand, and higher demand and higher utilization, on the other hand (see Kiefer et al. 2019 for supporting econometric evidence).
My national-accounting based estimates of ‘capacity utilization’ suggest that the U.S. economy has been operating a couple of percentage points below ‘full employment’ ever since the end of the 1990s — as is illustrated in Figure 3. The blue line indicates the estimates of capacity utilization based on AMECO data, the red line those estimates based on BEA statistics. The rate of under-utilization rose to more than 10% (based on AMECO-data) and 16% (based on BEA data) in the aftermath of the financial crisis (during 2008-10), but the U.S. have continued to perform well below capacity up to now; the flawed Trump stimulus did not trickle down into higher utilization. In 2018, actual output is some 8% below potential output based on AMECO data, and 12% lower than in 2000 according to BEA-based estimates. Figure 3 thus signals an economic system which is structurally underperforming, because of a permanent, almost inherent, shortage of aggregate demand. The demand deficiency, in turn, is due to stagnating wages, high inequality, persistent fiscal austerity for the middle- and lower-income classes and wasteful and ineffective fiscal stimulus for the top-1%.
Figure 2 The macro-economic net profit rate and the net profit share: The U.S. economy (1980-2018), percentages Source: Author’s construction based on the AMECO database.
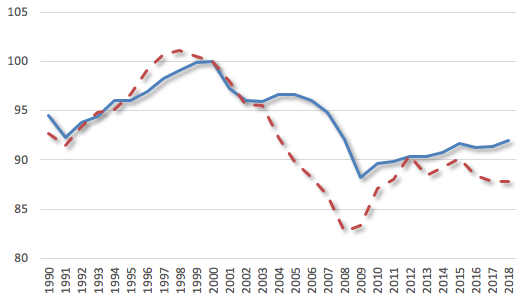
Figure 3 Capacity utilization: The U.S. economy (1990-2018), percentages Sources: Author’s construction based on AMECO data (blue curve) and Bureau of Economic Analysis data (red curve).
Potential Output Goes Down as Actual Output Goes Down
There is a final, related, error made by those who claim that the U.S. economy is operating at or close to full employment: their mistaken belief that long-run (trend) growth is uniquely determined by (exogenous) supply-side factors (basically, demographic change and technical progress), while demand and demand policy can only affect the short-run deviation (or fluctuation) from this trend. This stark dichotomy – demand matters in the short run, whereas supply factors determine the long run – is all too neat (Storm 2018). It is theoretically untenable.
The point is not that investments (including in R&D, knowledge and innovation) are key to (embodied and disembodied) technical progress and productivity growth — this is all too obviously true. The crucial point concerns a difference in views on what determines capital accumulation. For the ‘scientists of monetary policy’, investment is determined in the setting of a loanable-funds market by the interest rate, given the habits and preferences of households who ‘supply’ the savings. To raise potential growth, they think, one must permanently raise investment, which in turn means that savings must rise. This could be achieved by policies that restrain wage (cost) growth and bolster the profit share and (hopefully) the profit rate, because profit-earners (shareholders) are known to save a higher proportion of their income than wage-earners. This way, a higher profit share (and also greater income inequality) is believed to result in higher investment, faster technical progress and faster growth of potential output. This logic underlies calls for tax cuts, wage restraint and further deregulation of labor market (if at all possible).
The profit rate decomposition (in equation 1) and the data on U.S. profit rate and profit share presented in Figures 2 and 3 show that this supply-side (savings-driven) logic is wrong. The considerable rise in the profit share has led to a noticeable decline in capacity utilization, due to which the profit rate did not improve much (in a structural sense). As a result, the investment-to-GDP ratio (in Figure 1) is staying more or less stuck (at around 19.5%). The underlying cause of all this: a persistent shortage of demand, caused by wage stagnation and fiscal austerity for the 99%. As demand stays ‘down,’ firms are not investing but instead disgorge the profits to shareholders through stock buy-backs and dividend bonanza’s (Lazonick 2018). Recent econometric evidence by Kiefer, Mendieta-Muñoz, Rada and von Arnim (2019) confirms this diagnosis: the secular decline in potential output growth is found to have been closely related to the long-run decline in the wage share (or, alternatively, the long-run rise in the profit share, as shown in Figure 2).
It follows that fiscal stimulus can be effective in raising both actual and potential growth, if it can be made to increase broad-based demand and capacity utilization. Any fiscal-stimulus induced increase in utilization must raise the profit rate (ceteris paribus) and this will lead to higher business investment — exactly as IMF-economists Kopp, Leigh, Mursula and Tambunlertchai (2019) are observing. The increase in investment, in turn, will raise productivity growth, if only because the most modern technologies will be embodied in the newly installed capital goods, which will create space for (non-inflationary) higher wage growth. Utilization may well rise further, and growth can become a self-reinforcing cumulative process. Estimates by Fontanari, Palumbo and Salvatori (2019) indicate how strongly the rate of potential growth could be ‘pulled up’ by a ‘high-demand’ fiscal policy.
This brings me to my conclusion. If Larry Summers means what he writes, he should acknowledge the permanent effects (on potential growth) of fiscal policy and aggregate demand, and join macroeconomists such as Lance Taylor, Daniele Girardi, Walter Paternesi Meloni and Antonella Stirati, Peter Bofinger and Mathias Ries, Barry Cynamon and Steven Fazzari, Mario Seccareccia and Marc Lavoie, and Claudia Fontanari, Antonella Palumbo and Chiara Salvatori in bringing back ‘full employment’ as a valid and meaningful policy target into the macro policy discourse.
References
Bofinger, P. and M. Reis. 2017. ‘Excess saving and low interest rates: Assessing theory and evidence from the Global Crisis.’ VoxEU. Available at: http://voxeu.org/article/exces…
Cynamon, B.Z. and S.M. Fazzari. 2017. ‘Secular demand stagnation in the 21st century U.S. economy.’ Paper presented at the INET Secular Stagnation Conference. Available at: https://www.ineteconomics.org/…
Fontanari, C., A. Palumbo and C. Salvatori. 2019. ‘Potential output in theory and practice: a revision and update of Okun’s original method.’ INET Working Paper No. 93. New York: Institute for New Economic Thinking. Available at: https://www.ineteconomics.org/…
Girardi, D., W. Paternesi Meloni and A. Stirati. 2017. ‘Persistent effects of autonomous demand expansions.’ Available at: https://www.ineteconomics.org/…
Kiefer, D., I. Mendieta-Muñoz, C. Rada and R. von Arnim. 2019. ‘Secular stagnation and income distribution dynamics.’ Working Paper 2019-05, Department of Economics, University of Utah. Available at:
https://economics.utah.edu/res…
Kopp, E., D., Leigh, S. Mursula, and S. Tambunlertchai. 2019. ‘U.S. investment since the Tax Cuts and Jobs Act of 2017.’ IMF Working Paper WP/19/120. Washington, D.C.: IMF.
Lazonick, W. 2018. ‘Stock buybacks hurt workers and the economy. We should ban them.’ INET Blog, at https://www.ineteconomics.org/…
Samuelson, P.A. 1948. Economics. New York: McGraw-Hill.
Seccareccia, M. and M. Lavoie. 2016.’Understanding the Great Recession.’ INET blog, March 22. Available at:
https://www.ineteconomics.org/…
Storm, S. 2017. ‘Some thoughts on secular stagnation, loanable funds and the ZLB.’ INET Working Paper. Available at: https://www.ineteconomics.org/…
Storm, S. 2018. ‘The wrong track also leads someplace: Milton Friedman’s presidential address at 50.’ Review of Keynesian Economics, vol. 6 (4): 517-532.
Storm, S. and C.W.M. Naastepad. 2012. Macroeconomics beyond the NAIRU. Cambridge, Mass.: Harvard University Press.
Taylor, L. 2016. ‘The “natural” interest rate and secular stagnation: loanable funds macro models don’t fit today’s institutions or data.’ INET Working Paper. Available at: https://www.ineteconomics.org/…
References
[1] During 1980-2018, the fixed investment to GDP ratio has a coefficient of variation (or the ratio of the standard deviation to the mean) is just 0.08, whereas the real interest rate has a coefficient of variation of 0.65.
[2] The AMECO database includes (internationally comparable) time-series data on net fixed capital stock. I have normalized the value for κ in order to obtain a ‘full employment’ value for capacity utilization u in the year 2000. I have also estimated utilization based on BEA data. The results are qualitatively very similar.

