Yves here. This post shows that how on a global basis, the economy was primed for a crisis due to the rapid rise of private sector debt in the wake of the 2008 meltdown. And as so often happens in debt binges, the money goes to not-very-productive activities, from overpriced college educations and share buybacks in the US to ghost cities in China. As a result, the overall growth rate fails to compensate for the rising loan burden.
By M. Ayhan Kose, Director of the Prospects Group, World Bank Group, Peter Nagle, Economist, World Bank, Franziska Ohnsorge, Lead Economist in the Development Economics (DEC) Vice Presidency, World Bank, and Naotaka Sugawara, Senior Economist, Prospects Group, World Bank. Originally published at VoxEU
The sharp rise in global debt since the global financial crisis, together with record low interest rates, has led to an active debate about the benefits and risks of further debt accumulation (Blanchard 2019, Mauro and Zhou 2019, Moreno Badia et al. 2020, Rogoff 2019, Wyplosz 2019). Much of this debate focuses on government spending in advanced economies. But most of the increase in debt since 2010 has been in emerging market and developing economies (EMDEs), which saw their debt rise by 54 percentage points of GDP to a record high of about 170% of GDP in 2018 (Figure 1). This increase has been broad-based, affecting around 80% of EMDEs.
Figure 1 Debt in emerging market and developing economies, 1970-2018
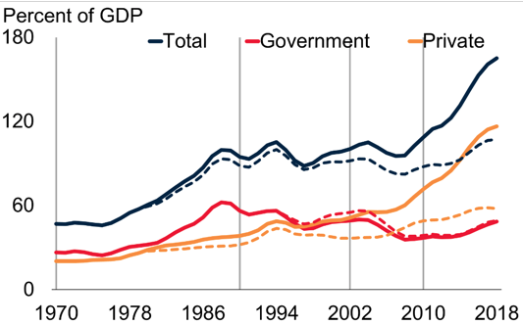
Source: Kose et al. (2020).
Note: Aggregates calculated using current U.S. dollar GDP weight and shown as a 3-year moving average. Gray vertical lines represent start of debt waves in 1970, 1990, 2002, and 2010. Dashed lines refer to emerging market and developing economies excluding China.
The latest wave of debt is not unique. Since 1970, EMDEs have seen three similar ‘waves’ of broad-based debt accumulation, all of which ended with widespread financial crises. But compared to the earlier waves, the current wave stands out for its exceptional size, speed, and reach. As such, despite record low interest rates, there is still a risk that the latest wave follows the historical pattern and ends in financial crisis. In a new CEPR Policy Insight, we shed light on this topic by comparing the current debt wave to its historical predecessors, empirically examining the links between rapid debt accumulation and financial crises, and drawing policy lessons (Kose et al. 2020).
Three Historical Waves, All Ending With Crises
Prior to the current wave, EMDEs experienced three waves of debt accumulation, which ended with well-known crises.
- The first spanned the 1970s and 1980s, with borrowing by governments in Latin America and in low-income countries in sub-Saharan Africa (Sachs 1986). This wave saw a series of financial crises in the early 1980s.
- The second wave ran from 1990 until the early 2000s as banks and corporations in East Asia and the Pacific and governments in Europe and Central Asia borrowed heavily, and ended with a series of crises in these regions in 1997-2001 (Kawai et al. 2005).
- The third wave was a runup in private sector borrowing in Europe and Central Asia, which ended when the global financial crisis disrupted bank financing in 2007-09 and tipped several economies into sharp recessions (Frank and Hesse 2009).
A comparison of these waves reveals common features. Each wave began during periods of low real interest rates. Borrowing was also often facilitated by financial innovations and/or changes in financial markets: the development of the syndicated loan market in Latin America in the first wave; financial and capital market liberalisation in East Asia in the second; and the growth of cross-border lending from EU-headquartered ‘mega-banks’ after regulatory easing in the third (Altunbaş et al. 2006, Takáts 2010).
The widespread financial crises that marked the end of these waves were typically triggered by external shocks that resulted in sharp increases in investor risk aversion, spikes in borrowing costs, and sudden stops of capital inflows. This led to steep falls in GDP growth, with output losses particularly large and protracted in the first wave. While currency crises were short-lived, sovereign debt crises were prolonged. For example, in the first wave debt relief was only provided in the late 1980s for (mostly) Latin American countries with the introduction of the Brady Plan (Cline 1995). For low-income countries, debt relief came in the mid-1990s and early 2000s with the Heavily Indebted Poor Countries initiative and the Multilateral Debt Relief Initiative, spearheaded by the World Bank and the IMF (World Bank 2017).
How Costly Are Debt-Related Crises at the Country Level?
To provide a more granular perspective on the consequences of debt accumulation, we also examine episodes of particularly rapid public and private debt accumulation at the country level. These episodes are selected by employing a widely used statistical algorithm (following Harding and Pagan 2002), which identifies cyclical turning points in the debt-to-GDP ratio.
A period of rising debt is labelled as an episode of rapid accumulation if the increase in the debt-to-GDP ratio exceeds its maximum ten-year moving standard deviation during the phase. We label episodes as being associated with crises if a financial crisis occurred either during the episode, or two years after the episode. Financial crises are defined as in Laeven and Valencia (2018).
Since 1970, we identify about 520 national episodes of rapid private and public debt accumulation in 100 EMDEs, during which government debt typically rose by 30 percentage points of GDP and private debt by 15 percentage points of GDP. The typical episode lasted about eight years.
About half of these episodes were accompanied by financial crises that led to severe output losses compared to countries without crises. After eight years, GDP and GDP per capita were around 6-10% lower in crisis episodes, while investment was 15-22% lower. Financial crises in government debt accumulation episodes featured larger output losses than private debt episodes.
Crises associated with these episodes were typically triggered by external shocks such as sudden increases in global interest rates, while domestic vulnerabilities often amplified the adverse impact of these shocks. Crises were more likely, or the economic distress they caused was more severe, in countries with higher short-term external debt and lower international reserves.
Policy choices and frameworks also played an important role. Case studies for 43 financial crises in 34 EMDEs since 1970 reveal some policy-related observations:
- Most EMDEs that experienced financial crises often had unsustainable macroeconomic policies and suffered structural and institutional weaknesses.
- Debt was often used for less productive purposes, for example in funding current account deficits, populist policies, or import substitution industrialisation.
- Many economies had severe weaknesses in their fiscal and monetary policy frameworks, including poor revenue collection, widespread tax evasion, and monetary financing of fiscal deficits.
- Regulation and supervision of banks and other financial institutions were frequently weak.
How Does the Fourth Wave Compare to Earlier Waves?
The latest wave of debt accumulation began in 2010 and has already seen the largest, fastest, and most broad-based increase in debt in EMDEs in the past 50 years. The average annual increase in EMDE debt since 2010 of almost 7 percentage points of GDP has been substantially larger than in each of the previous three waves (Figure 2). While the debt runup was largest in China, even in other EMDEs, debt rose by almost 20 percentage points of GDP, on average, between 2010 and 2018.
Figure 2 Average annual change in debt during the four waves
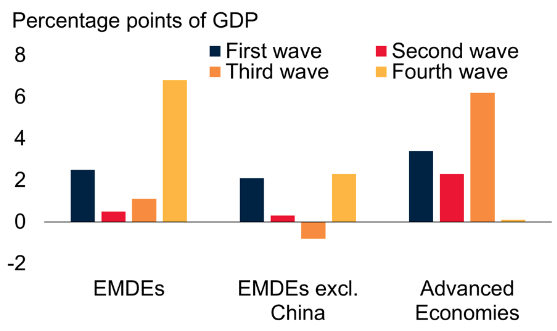
Source: Kose et al. (2020).
Note: First wave covered the period 1970-1989; second wave from 1990-2001; third wave from 2002-2009; and fourth wave from 2010 onwards. Emerging market and developing economies (EMDEs) include 147 economies. Average annual change calculated as total increase in debt-to-GDP ratios over the duration of a wave, divided by the number of years in a wave.
The current wave bears many similarities to the previous three waves. Global interest rates have been very low since the global financial crisis, and search for yield by investors has led to narrowing spreads for EMDEs. Changes in financial markets have boosted borrowing, including the rise of regional banks, growing appetite for local currency bonds, and increased demand for EMDE debt from the non-bank financial sector.
While EMDEs have gone through periods of volatility in the current wave of debt accumulation, they have not (yet) experienced widespread financial crises. However, the exceptional size, speed, and reach of debt accumulation in EMDEs during the fourth wave is a cause for concern. Despite the sharp rise in debt, growth in these economies has repeatedly disappointed, and they face weaker growth prospects in a fragile global economy (Figure 3). In addition to their rapid debt build-up, they have accumulated other vulnerabilities, such as growing fiscal and current account deficits and a riskier composition of debt (Kose and Ohnsorge 2019, Kose et al. 2018).
Figure 3 Growth and debt during the fourth wave
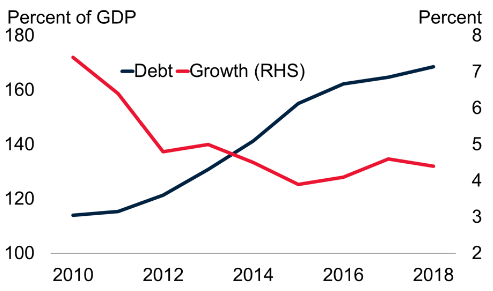
Source: Kose et al. (2020).
Note: Total debt (in percent of GDP) and real GDP growth (GDP-weighted average at 2010 prices and exchange rates) in in emerging market developing economies.
What Can Policymakers Do?
The lessons from the previous waves of debt highlight the critical role of prudent macroeconomic and financial policy frameworks. These include sound debt management and debt transparency, strong monetary and fiscal frameworks, and robust bank supervision and regulation. The IMF and World Bank have a critical role to play in spearheading these efforts, by encouraging common lending standards and highlighting current risks and vulnerabilities through analytical and surveillance work.
Authors’ note: The findings, interpretations, and conclusions expressed in this column are entirely those of the authors. They do not necessarily represent the views of the World Bank, its Executive Directors, or the countries they represent.
See original post for references


Wow.
It sure is lucky that virus timed so well providing cover for another raid on the treasury.
We are just exceptional.
Hat tip to Piketty for that last chart.
Nothing unusual about debt out growing Groaf.
Richard Vague wrote a book about how private debt booms, NOT public debt, reliably predict the onset of crises:
A Brief History of Doom
Two Hundred Years of Financial Crises
https://www.upenn.edu/pennpress/book/15996.html
Are there any surprises here that I missed?
Any breakout of how much private debt, in various instances, was domestic, and how much was owed offshore?
Any quantification of how much private debt, in various instances, was “used for less productive purposes, for example in funding current account deficits, populist policies, or import substitution industrialisation”?
And note that import substitution industrialisation is only less productive for foreign exporters. It’s key to beginning real development.
And so it goes. The World Bank: not just spearheading, also shafting.
Oh dear, from the World Effing Bank. Why did I bother to slog through it?
I am *quite* surprised to see from the first chart that public sector debt growth in China since 2010 has stayed in line with overall GDP growth (officially 6-7%, although Pettis and others are skeptical). But Chinese ‘private sector’ debt likely includes SOEs and various other state or provincial controlled entities.
Wolf Richter: China’s debt is in the provinces, including opaque entities owned by the provinces that carry the debt — what the Chinese government calls “hidden debt” — and in the corporate sector. And the debt bubble is blowing up.
Sorry, hopefully there’s a test for smell that readers are able to access.