Yves here. Those of you who remember the financial crisis and its aftermath no doubt recall how persistent real estate cheerleading was. So the notion that the flogging of Case-Shiller, very much a lagging real estate indicator, was merely the result of ignorance and laziness is charitable.
By Wolf Richter, editor of Wolf Street. Originally published at Wolf Street
OK, dear reader, I feel like I’m fighting a one-man battle against media misinformation or something. I didn’t want to descend into housing-data purgatory with you, and you didn’t want to either, but now we’re on the way after the horrifically brain-dead misreporting in the media about the Case Shiller Home Price Index this morning by lazy-ass reporters, or increasingly by spaghetti-code algos, who didn’t bother to read the Case-Shiller methodology – or better yet, my past articles about the Case-Shiller Index.
These brain-dead reporters – or the spaghetti-algos that wrote the reports – went like this: National home prices rose 4.8% year-over-year in April, during the peak of the lockdowns and despite the pandemic, showing how vibrant the housing market is.
But that is bull malarkey because the S&P CoreLogic Case-Shiller Home Price Index doesn’t work that way. It lags massively behind. With the Case-Shiller Index – my favorite home price index because of the way it is structured – you have to be patient. That’s its big drawback.
The Case-Shiller Index operates on a “three-month rolling average” basis. And the price data is collected from public records. So the release today, titled “April,” was the three-month moving average for deals whose data became available in the county deed recorders in February, March, and April.
There is also a time-lag between when a deal closes and when the data becomes available in the county deed recorders.
So what the Case-Shiller showed today were closings that had occurred in prior months and that became available in the county deed recorders in February, March, and April. This included some of the deals that closed in January and excluded some of the deals that closed in April.
This is not a secret. S&P publishes the methodology. And reporters should have studied it before reporting bull-malarkey and misinforming their readers, many of whom paid a subscription to be misinformed.
The Case-Shiller Index uses the “repeat sales method” where it compares the sales price of a house that sold in the current month to the price of the samehouse when it sold previously. To make it into the index, a house has to have been sold at least twice.
This sales-pair method makes the index immune to changes in the mix of houses that sold, which is an advantage over the common median-price indices. The index essentially tracks price changes for each house in the index separately over time and then builds an index out of the sales-pair data. The index provider also applies some algorithms to iron out certain issues, such as improvements made to the house over time.
First signs of the pandemic
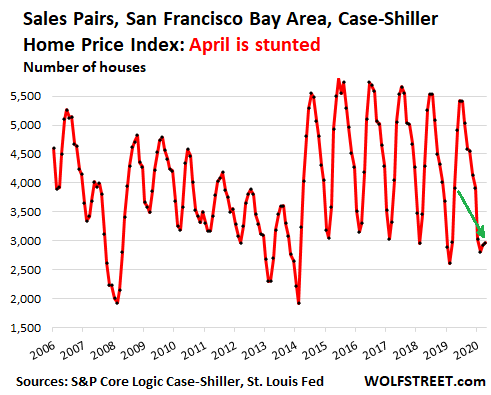
It is in the number of “sales pairs” in April where we can see the first impact of the pandemic. I will use the sales pairs of houses in the index for the five-county San Francisco Bay Area (counties of San Francisco, San Mateo, Alameda, Contra Costa, and Marin) because it is this area that went into lockdown before any other area in the US, on March 17.
The Bay Area is the earliest where we can see the impact of the lockdown. And even here, the impact of the lockdown only shows up in the April sales pairs data, and only in a much-reduced way.
The index used 2,970 sales pairs for April in the Bay Area. Meaning, data points of 2,970 houses whose sales were made available in the public records in April, and which had been sold previously, entered into the index. That count was down 24% from April last year. This is the first sign of the pandemic’s impact.
In March, the sales pair count was down only 2% from a year ago, well within the normal year-over-year fluctuations of the sales pair count. In other words, the lockdown that started on March 17 had not yet, or had only barely, impacted the public records data.
In February, the sales pair count was up 7.7% year-over-year, also well within the normal fluctuations of sales pair counts.
The chart below shows those sales-pair counts by month for the five-county San Francisco Bay Area. This is an indication of home sales volume, which is subject to strong seasonality. The low month in terms of sales appearing in public records is always in February. The high months are June and/or July.
This year, February was also the low point, and there was a small uptick in March, but April, when home sales volume normally begins to surge, was stunted, which caused it to be down 24% compared to April last year (green arrow):
And the pandemic’s impact was even smaller…
April sales pairs, by being stunted, accounted for only 34% of the total sales pairs in the three-month rolling average. Last year, April accounted for 41% of the rolling three-month count. In prior years, April accounted for 39% to 44% of the three-month rolling average.
In other words, price changes in April were further watered down in the rolling three-month average by being seasonally under-represented in terms of volume.
So the Case-Shiller Index for “April” in the Bay Area, the first of the 20 city indices to reflect the pandemic, contains, roughly speaking, 80% of pricing data from sales before the pandemic, and 20% of price changes from sales during the pandemic.
The National Home Price Index, which was cited in the headlines this morning, was even less impacted by lockdowns and the pandemic than the San Francisco Bay Area index because all other markets in the 20-city index locked down later than the Bay Area.
So, what the national index told us today is nearly all based on home prices before the impact of the pandemic. It will be another three months – the index to be released on September 29 – before every month in the National Case Shiller Index’s rolling three-month average fully reflects home prices of sales that closed since the beginning of the lockdowns. Each month will get us a step closer. And even then, it will take a while because house price data is sticky and moves slowly. So be patient.
Enjoy reading WOLF STREET and want to support it? Using ad blockers – I totally get why – but want to support the site? You can donate. I appreciate it immensely. Click on the beer and iced-tea mug to find out how:


Whoa Wolfie! Spaghetti algos and lazy-ass reporters. Thanks for the cold shower. I’m wondering if we couldn’t have an index of housing indexes of a variety of factors indicating the future of housing. Like cities going to the rats and mice v. cities that are properly maintained; cities with good K-12 Ed and employment v. cities that area vastly socially unequal; cities with excellent inclusive healthcare v. cities that don’t give a damn; and even the mother of all predictors of housing value: cities that have thrown in the towel and just disincorporated v. cities that are still limping along. Because housing values do not exist in a closed universe of houses signifying nothing; housing values exist in a social matrix. No? Lagging indicators just serve to show us how remiss we have been when we refuse to admit it in real time.
Some anecdotal observations…
My partner purchased a house during lockdown, closed on May 28. Our accepted offer was less than the asking price. The seller tried some tricks at the end to get us to back out, because by the time we closed it was clear that prices weren’t dropping in the area, but going up – I heard a couple of rumors about people from LA getting in bidding wars on houses locally, paying cash. Granted this is a somewhat rural area, so that can impact demand.
There was no expectation from any of the people we worked with that prices would come down. There are way fewer homes on the market than there are people looking to buy right now, at least around us. Despite the fact our move is over, I’ve still checked out homes for sale in the area. There are no longer any decent homes for sale in the price point for the place my partner bought – everything is $50k+ higher.
I suspect these anecdotal observations have as much to do with the rural nature of the area we live. I really don’t know what the housing market in the LA metro area is looking like.
My experience over 40 years is that home prices tend to lag unemployment by 6-12 months or more. It generally takes a while before people under financial pressure finally buckle down and sell or go into foreclosure.
This pandemic crisis is probably going to have two unusual major offsetting aspects. Huge unemployment spike at the beginning of the GDP drop – usually unemployment lags 6 months or more from the start of a recession. However, the financial hit is offset, at least partially, by major government intervention putting significant cash in the hands of people who have lost their jobs. The government also said they didn’t need to pay their rent or mortgage for several months.
In general, I don’t think we will see full impact of pandemic on housing prices for another year or more if unemplyment stays up and people get exhausted financially and emotionally..
Wouldn’t this measure be inflated by the houses that weren’t sold that might have been in a stronger market?
Slim checking in from Tucson. Here’s what my Cycling Intelligence Agency is seeing during Slim’s bicycle rides around town:
1. Not that many houses for sale. Methinks that a lot of listings from earlier this year have been withdrawn. I predict that, in the coming months, we’re going to see a lot of pent-up supply on the market.
2. A [family blog] TON of houses and apartments for rent. Some of this is probably due to the University of Arizona students being told not to return to campus after spring break. The rest? I dunno. Might be because people tend to leave town in the summer. Or other factors. Like I said, I dunno.
My CIA will keep embarking on missions and will keep the NC peeps informed!
Closed on our house in Westchester at the end of April, no change in demand or downward pressure on prices that i can see. In fact theres lots of demand from people who decided never again with an NYC apartment lockdown. In the NY area I think we are seeing the effects of the bifurcation in the economy, people with “secure” jobs that can work from home doing just fine, there’s tons of renovations happening around us, landscapers showing up every week, etc. if you don’t have that kind of job though you’re *family blogged* and can go die in a ditch as far as state and local govt is concerned
next Wolf has to explain the methodology behind the popular diffusion indexes like the PMI, and what the index numbers actually mean…that has also seen widespread misreporting…
Yeesh – I’m actually incredulous that anyone — at least anyone not independently wealthy — would be in a hurry to buy anything like a house right now. Nobody really knows what kinds of future shocks lie ahead.
I was looking to buy this year, but have tucked my feelers back in for at least the rest of 2020, choosing instead to store my belongings and ride things out until ~ mid to late ’21.
I made three serious lowball offers on March 31.
All three properties are REOs, and one is boarded up.
All are in the South Suburbs of Seattle.
So far, the sellers have not responded to my offers, but
they have not reported the properties as sold. . .
I am not independently wealthy, and I expect that people
will start to accept scary low offers before the end of the year.