The most important figures CalPERS publishes all year are its preliminary returns, which it releases shortly after its June 30 fiscal year end, and its Comprehensive Annual Financial Report, which comes out in November. In recent years, the preliminary returns have been identical to the final result, so this figure, unlike, say, the preliminary GDP estimate, is not typically revised down the road.
It was therefore disconcerting to determine that the figures below, taken from CalPERS July 15 press release, do not add up when you analyze them along with other data provided by CalPERS. Specifically, the 4.7% overall return presented is out of line with the returns reported for the asset classes, which instead point to an overall return of approximately 4.1%.
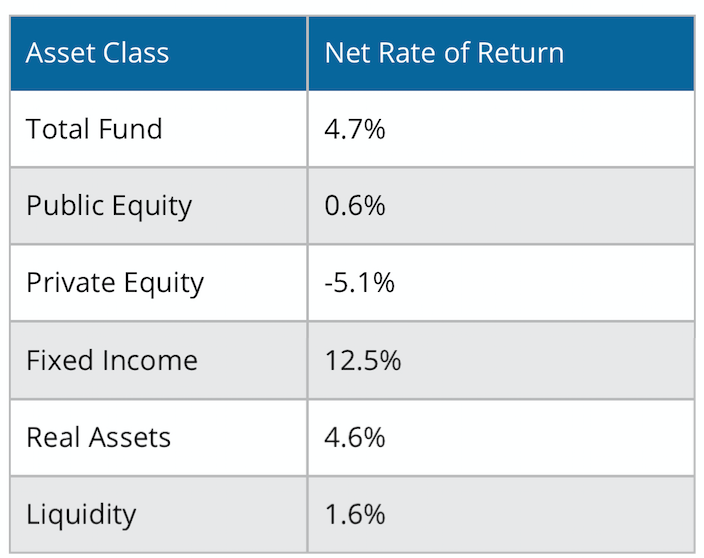
Specifically, if you take the quarterly asset allocations as reported by CalPERS, compute the average for each quarter, and then average those four quarter averages and multiply them by the returns listed for each asset class below, you get 4.12%, not 4.7%, a disparity of 58 basis points.1
A disparity of as much as 0.2%, or 20 basis points, would not be troubling, since it could be the result of timing issues and rounding, In keeping, if you use the same approach with CalPERS’ preliminary returns and its quarterly asset allocations for its previous fiscal year, the disparity is only 5 basis points.
Richard Ennis, a former editor of the Financial Analysts Journal who has spent over 30 years advising pension fund trustees and recently published a major study documenting the poor performance of public pension funds’ investments in “alternative investments” in the authoritative Journal of Portfolio Management, confirmed our concerns:
Based on publicly available information, Naked Capitalism estimates the fiscal year 2020 investment return for CalPERS at 4.12%, which is 58 bps less than the preliminary figure of 4.7% recently released by CalPERS. I reviewed the detailed data underlying the NC figure and, based on that data, 4.12% appears to be a reasonable approximation. 58 bps is far too large a discrepancy to go unresolved. I understand CalPERS has been apprised of the discrepancy. I look forward to seeing a reconciliation of the two figures.
We e-mailed CalPERS two days ago, which is a generous lead time by journalist norms, describing our work and asking for an explanation. Since this report is critically important to CalPERS, one would think it would be easy for them to describe the missing factor or factors that would explain the 58 basis point anomaly. But we have not gotten any response, while CalPERS head of Stakeholder Relations, has already addressed a completely different issue we raised after we e-mailed our questions about the return figures.
Bear in mind that CalPERS’ auditor, BDO, does not audit CalPERS investments. From its Independent Auditor’s Report in CalPERS fiscal year 2019 Comprehensive Annual Financial Report:
The introductory, investment, actuarial, statistical and compliance sections have not been subjected to the auditing procedures applied in the audit of the basic financial statements, and accordingly, we do not express an opinion or provide any assurance on them.
CalPERS publishes its “Investment Section” as a stand-alone document. The only text portion is a cover letter from its Chief Investment Officer; there is no independent certification. Last year’s missive, from Ben Meng, contains this section:
Our Investment Office team, the Board’s pension consultant Wilshire Associates, and State Street Bank & Trust, our master custodian, compiled the investment data presented on the following pages
You can read BDO’s plan for its audit of CalPERS fiscal year 2020 financials here. This slide summarizes key tasks:
00 Independent Auditor's Annual PlanA careful reader will note that BDO merely confirms investment “holdings” with custodians and investment managers, and not their valuation methodologies. This should be straightforward with actively traded public investments like stocks and bonds. But as readers know well, CalPERS has substantial positions in illiquid assets, namely real estate and private equity.
Note that CalPERS keeps its own books for its private equity investments, which runs on an in-house system called PEARS, and real estate, where the CalPERS system is named AREIS for Automated Real Estate Information System . Since a significant amount of CalPERS information is reported on a “trust me” basis, it would behoove the system to address any causes for concern promptly.
On top of that, our result, if confirmed, would have significant implications for CalPERS investment office employees. CalPERS changed its bonus policy under departed Chief Investment Officer Ben Meng so that the performance bonus for the investment staff now depends on CalPERS overall results. Previously, each investment team got a performance bonus based mainly on how they did relative to the benchmark for their strategy, and not overall results.
The CalPERS press release stated that the return benchmark for the fund overall was 4.33%. CalPERS perversely pays investment performance bonuses even if the results are as much as 14 basis points below. That means 4.18% or lower would mean no performance bonuses. Recall our work came up with 4.12%. The reported result of 4.7% would give staff a bonus of 150% of target bonus.
Now there presumably is an explanation for this disparity, so it is bizarre to see CalPERS refuse to provide one. We even helpfully pointed out the two most likely sources.
One is that there could conceivably have been extremely large intra-quarter swings in asset allocation. We would have re-run our analysis using monthly asset allocations, and we would have been able to do that for the previous fiscal year had the results using quarterly averages not come in so close to the official returns.
But when CalPERS reduced its number of investment committee meetings from nine or ten to mere four a year, it also stopped publishing the monthly asset allocation reports. Needless to say, having the board abdicate what already had been limited, and arguably perfunctory oversight of the critically important investment operations, creates baseline concerns about caliber of governance at CalPERS.
Another possible explanation is that CalPERS did not publish its returns for a hodge-podge of investments it previously held which it called “Trust Level”.2 In dollar terms, it consisted almost entirely of its emerging manager program. CalPERS canceled those mandates in late 2019 due to underperformance. CalPERS had peculiarly also lumped its tail-risk hedges in that category.
As Bloomberg reported, Ben Meng gave up a billion-dollar payday for CalPERS when he got rid of the tail risk hedge provided by the Nassim Nicholas Taleb-advised fund manager Universa (run by Mark Spitznagel) right before the markets imploded in March.
That is a long-winded say of saying that while the “Trust Level” assets could conceivably fill the gap, they would have had to have returned on the order of 70% to do so. Was CalPERS fortunate enough to get out of these investments when the stock market was doing well in 2019, and thus showed strong gains? Perversely, CalPERS could see this result as creating a big optics headache.
CalPERS might be concerned that it would make that bad situation look worse by showing that the other investments they eliminated also outperformed everything else they did, and by a large margin, even if that was due to very lucky timing of the exit.
We asked Mr. Pacheco to supply the missing monthly asset allocation and Trust Level data if they did explain the variance, which puzzlingly, he has not yet done. We have put in a Public Records Act requests for this information, so we should receive it in due course.
_____
1 After we ran the numbers, we asked two other people to make independent computations, down to pulling figures from the original records so as to prevent the possibility of replicating data entry errors. Each of us came up with 4.1% or 4.12% in the case of making more granular estimates by working from dollar figures as opposed to CalPERS’ reported asset allocations, which are rounded to the nearest 0.1%.
We would present our spreadsheet, but they don’t display well on WordPress. We will e-mail them upon request. Readers are encouraged to replicate our findings. You can compute 6/30/2020 asset allocations from https://www.calpers.ca.gov/docs/perf-monthly-update.pdf
March 31, 2020: https://www.calpers.ca.gov/docs/board-agendas/202006/invest/item06c-01_a.pdf
Dec 31 2019: https://www.calpers.ca.gov/docs/board-agendas/202003/invest/item08c-01_a.pdf
September 30, 2019: https://www.calpers.ca.gov/docs/board-agendas/201911/invest/item06c-02_a.pdf
June 30, 2019: https://www.calpers.ca.gov/docs/board-agendas/201908/invest/item07c-02_a.pdf
2 Trust Level includes Multi Asset Class, GE Emerging Manager Program, Completion Overlay, Risk Mitigation, Absolute Return Strategies, Plan Level Transition and other Total Fund level portfolios.


There are 13 members on the CalPERS board, but their silence makes me wonder if they’re really on the board. Is it just a board of bystanders?
They are on board. The question is on board with whom?
After reading all these posts about CalPERS I’m surprised that I am shocked by the total lack of oversight by the Board. Some of “CalPERS information is reported on a “trust me” basis,” You’ve got to be kidding. We are talking about over $400 billion. Let me guess… staff writes the scope of work for consultants and leaves out auditing the investment returns and benchmarks? If the numbers are wrong, there are many people in that CalPERS office that can do the simple math. Are they remaining quiet so as not to interfere with their bonus?
I am highly confident that Wilshire Associates does review the total fund benchmark computation, which per CalPERS’ July 15 press release, is 4.33%.
I concur on your take on Wilshire Associates. One sneaky bit, though, with that sort of benchmark is if CalPERS provides any underlying data that used (like on the Private Equity part) or if they created a highly bespoke benchmark for the illiquid stuff.
Medium sized story: I once was the Head of Performance at a medium-sized asset management firm in London and let me tell ya…the black box of the benchmark (and asset valuation) for illiquids is such a scam. I was deeply displeased at how the Private Equity boys & girls sort of randomized what the benchmark was (yeah, let’s use S&P500, MSCI World and some other bits and pieces from around the globe without any sort of proper controls) and then what the weights were within the benchmark. Real Estate is also a black box of whatever the heck you want it to be.
I do have one question that is related – where exactly does the CalPERS Performance Team report into? Do they report into the CIO or into the COO? At the role I had at the above medium sized firm it went into the CIO, which was the most politicized crap I have ever dealt with. Portfolio Managers would object to the valuations used and would (prior to outsourcing the back office) have the valuations changed so that they would get a larger bonus (I wouldn’t change it so they would brow-beat others to get that changed). I was accused at one point of massaging sector comparisons in order to make the PMs look good.
My subsequent Head of Performance role at a huge place had me report into the COO-line, which meant you could run the numbers and not have politics sway the calculations. Don’t get me wrong – PMs would still yell at me (or use the old chestnut: “but a monthly period is just arbitrary!” And when you think about it, it’s not wrong…), but I was able to publish sound numbers that I could explain and stand behind. My concern is that CalPERS probably looks more like the medium sized manager, than the huge place. So the problems / rot could be pretty fundamental…
This is a job for Super Accountant! I once read that if you want to understand a financial report, that you go digging into the footnotes as that is where you will find the dead bodies buried. So that is where I went looking for those missing 58 basis points and found much to my surprise that not only was it listed, but that the CalPERS Board were actively supervising it and were all over it. So the way that the figures broke down was this-
10 Basis Points – CalPERS Board Performance Bonus
10 Basis Points – CalPERS Board “Retirement” Fund
10 Basis Points – CalPERS Board Compensation Payout (for working at home)
10 Basis Points – CalPERS Board Gratuities Fund
10 Basis Points – Something called the Government Related Acting Financial Transactions
10 Basis Points – CalPERS Senior Staff Renumeration Fund
10 Basis Points – Trained Seals Fund (something related to press relations but does not explain further)
Yeah, I know that this all adds up to 70 Basis Points and not 58 but I never said that CalPERS was good at basic maths.
Unfortunately this is not one of these cases where you can reliably figure out what the number should be from the data provided. Because we don’t know the path of those returns you can get wildly different numbers than simply the weighted average of each quarter.
For example imagine an asset class that for 9 months didn’t do anything and then returned 10% in the last 3 months. Now imagine that you were significantly more heavily weighted in that class early in the year. Using the estimation technique you propose would give a number too high. And if the portfolio were more heavily weighted at the end of the year, the estimation technique would be too low.
I hate to seem rough on you, but did you manage to miss the headline? Your comment is a pretty elaborate way to misrepresent the point of the post.
The post never suggested that the CalPERS result could not be explained, but that it was incumbent upon CalPERS to explain it. Richard Ennis, a top level expert who has spent decades advising public pension trustees, agreed that our first-cut effort was reasonable and the anomaly was large enough to warrant CalPERS providing more information.
CalPERS is a public agency and is backstopped by California taxpayers. It is subject to disclosure requirements far in excess of private sector companies and investors, although CalPERS has been doing its best to ignore and evade those obligations. I waited two business days before posting, which is one day more than they had reason to expect. They couldn’t even muster up a content-free denial like “We stand by our numbers”. And I even told Pacheco in the e-mail that a 20 basis point deviation could be seen as noise, so all they had to explain was 38 basis points.
And if the cause was something as simple as you suggest, it should have been easy for CalPERS to describe that, and point to particular asset class, their return profile. and the approximate impact on the total return.
First, in case it wasn’t clear, I agree 100% that CalPERs should provide audited returns and blasting them for not doing so is totally legit. Especially for an organization with such a checkered history with the truth. I simply wanted to make clear that the discrepancy was not prima facie evidence of wrong doing (the lack of audited returns is however). And of course the lack of response and transparency is always problematic — peace.
I did not address the key reason that your scenario is not not applicable this year with CalPERS: it has not changed its asset allocation during this period and rebalances frequently (sometimes even daily) to meet its allocations. So it is not going to show anything other than very short term shifts in asset class weighting. That is why an expert of Ennis’ reputation regarded our approximation as reasonable.
I really am not trying to take away from your point the CalPERS reporting is problematic (I fully agree). But even with daily rebalancing funny things can happen when markets are volatile.
Here’s a quick (albeit extreme) example for illustrative purposes. Imagine you have two asses classes A and B. A and B both return 0% for the period, but where A stays the same for the whole period, B loses 20% at the beginning of the period and then gains 25% before the period ends. With daily rebalancing this will cause the final return to be 1.25% which is clearly higher than the 0% average.
In other words it doesn’t require big assets class shifts, high volatility with rebalancing can cause the same issue. Again, I’m not saying that is what happened here, just that the math is not as clear cut as made out to be.
CalPERS — given the fund management business it is in, which is providing long-term pay-outs from slowly accreting pools of contributions — doesn’t really want or need this kind of return profile. For one thing — given a 20-30 year contribution timeframe for most beneficiaries’, state and local governments’ contributions — followed by an equally long 20-30 year drawdown of the pension benefit — no-way do any sort of annual return breakdowns like the one you’ve mentioned mean anything. For a typical beneficiary, you’re looking at a 40-60 year investment and redemption timeframe.
It is inconceivable and simply unmanageable to have a fund management strategy for this kind of investment that depends on — every year or two — finding short-term “hot deals” that can (supposedly) pay out 5-7% annualised returns. Given the size of the funds under management at CalPERS, you’d need to do hundreds of such investments each year and there simply isn’t that number of uncorrelated investment targets out there. And of those there are, not all of them can hit their return targets anyway. It’s simply too much churn, too much swapping in and out of asset classes and instruments and too much overhead in having to always be either just about to enter a new short-term investment, just about to see it in run-off and try to find out what you’ve earned or just about have to find new deals to replace the expiring old deals.
The only sane investment approach for CalPERS given the profile of its contributions and liabilities is Long Term Buy and Hold (LTBH). For LTBH, the whole point is that income is unspectacular but steady (so one hopes). So it doesn’t matter a jot whether a particular investment target has yielded nothing for 6-9 months than everything comes in backloaded in months 9-12. CalPERS simply should not be interested in such metrics and should not be pursuing deals which perform this way.
Of course, herein lies CalPERS’ predicament: LTBH is yielding — if you’re lucky — 2-3% real returns or less. CalPERS has — having, I can only assume, spent too long in the California sunshine and got its collective brain addled — promised 7% returns to make the books balance and to keep Gavin Newsom (and his equally un-illustrious predecessors) off their backs.
It. Is. Never. Going. To. Work.
Spot on Clive! It’s all about the cashflow and not about the percentages. The US has lots of that nowadays as well. It’s known as LDI or Liability Driven Investment where cashflows are targeted to match liabilities. In the US, they use the old school buy and hold/maintain (LTBH) using government bonds mostly. In the UK, they like to use a bit of leverage and OTC. Also in the UK almost no pension scheme has those awful benchmarks like CalPERS does. It’s drives your investments in really stupid ways instead of concentrating on generating cashflows.
Yup, that’s what I was saying looong time ago. You’d aim to meet your cashflows, not some “investment performance benchmark”. I.e. to fit your assets to your liabilities over the long time.
But ALM/Actuary is not nearly as sexy as “investment management”.
Investment management makes sense in defined contributions pensions, not defined benefits (which is majority of CP pensions I believe).
> if the portfolio were more heavily weighted at the end of the year
As William Gibson remarked somewhere, “If that were going to happen, it would already have happened.”
In other words, were the explanation for the discrepancy as simple as you suggest, CalPERS would already have provided it. All they have to do is show their work!
To my simple mind, the following formula:
is just a wee bit problematic. I think Marcie has some ‘splainin’ to do. And the longer she takes to do it, the worse it looks.
Yves said in the post that “one would think it would be easy for them to describe the missing factor or factors that would explain the 58 basis point anomaly. “. They didn’t.
Given that they know Yves is on them, that can mean only one of two things:
– either they don’t have one
– or they do, but want Yves to look bad as if this is then picked up (on the back of the Meng scoop) and they can come with the “obvious” explanation trying to tank Yves’s reputation.
The first is really really bad.
The second one missed the IMO main point of the post – transparency. I’ll paraphrase what you say – “if you want a number, you’ll find a methodology”.
Which means, that as a public institution, you’d be extremely transparent on your methodology. You’d publish it, make sure you publish all constituets, and keep it consistent over time so you have a comparison.
Anything else, you’re engaging in make-believe games. And we know that Calpers under the current managemeng is wont to do that. If it’s so, then there’s a reason, and it’s likely not a reason conductive to the financial health of the beneficiaries.
So the point is not that “Calpers is lying! (again)”. The point is “Calpers is opaque (again), why?”
Seems like a large discrepancy CalPERS should examine. Where did it come from, what assumptions, what calculations, what numbers, etc.
Will CalPERS do the right thing here, re-examine the numbers, make transparent its calculations? (rhetorical question)
Another rhetorical question: isn’t making bonuses contingent on total investment returns sort of like paying CEOs in stock options?
Thanks for your continued reporting on CalPERS, PE, and pensions.
Geez, you people.
Have none of you taken the introductory course at the “Government School of Accountancy”?
The answer to the question “How much is 2+2” is, and always has been “How much do you want it to be”?
Simple fact is benefits are too high. Too many people collecting over $100,000/yr.
Too many public safety retirees collecting 80-100% of their highest salary, which they are allowed to game during their final years.
Too many hands in the pie earning profits. Who will blink first? Apparently not the incompetents.
The problem at CalPERS is not that it’s commitments are too high. Meeting those long-term promises was the task all along, to no one’s surprise. The problem is incompetence and mismanagement, and almost certainly malfeasance.
One might start by asking how reasonable it is to have a high school graduate manage the country’s largest public pension fund. Ms. Frost is deeply in over her head and thinks she can schmooze and compromise and hide her way out of it. CalPERS’s increasing and increasingly desperate lack of transparency is an attempt to hide how deep the rot goes.
CalPERS does not set benefit levels. The system’s employers, which are the State of California and many state municipalities, do. They are also responsible for funding the pensions.
But unreasonable targets do prompt unreasonable behaviour.
On the discrepancy: given the size of CalPERS PE book isn’t it possible that the prelim figures were based on excessive GP mark-downs compared to public markets and that this was bumped up once the actual public marks were available (and, thanks to the Fed, not as bad as first imagined)?
Doesn’t mean there isn’t a need for transparency in all this, esp if bonuses are on the line.
Hoo boy, you pack a lot of counterfactual assumptions into one comment.
First, you are confusing the 7% investment target (which did push Ben Meng to try to overreach) with the bonus target for staff, which this year is only 4.33%
Second, the performance targets are not unreasonable. It’s an open secret, and discussed by a handful of academics, that public pensions funds set the targets for their investments so as to be unduly easy to meet/beat. The classic example is that the benchmark for PE for decades was the S&P 500 + 300 basis points. The S&P 500 was then a flattering basis for comparison because private equity firms were (and are) smaller than S&P 500 members, so they can show more growth and thus higher returns.
Then in the era of super-cheap money, public companies goosed their prices with buybacks, plus the FAANG + Microsoft distorted the average. So the S&P was performing better than smaller cap or broader indices. So public pension funds moved away from the S&P 500. CalPERS had used a different set of equity benchmarks but also have moved to more favorable ones…along with lowering the private equity risk premium to a not defensible 150 basis points.
Third, private equity does not engage in “excessive mark-downs.” One of the reasons public pension funds like PE is that the funds lie about their valuations, which is widely acknowledged and politely called “smoothing”. One of the times they regularly do in bad equity markets. As levered equity, PE valuations should fall more than those of public stocks, but they are reduced on average markedly less.
Fourth, as to timing, I didn’t explain in the post, but CalPERS (and the entire public pension fund industry) reports PE and RE private fund results one quarter lagged as in March 31 results are reported along with June 30. CalPERS has to use those valuations, which were already provided by the PE firms. Doing anything else would be flat out fraud. On July 15, they would have no new fund valuations and would literally be making valuations up which would only make the obviousness of the fraud worse.
Finally, CalPERS uses March 31 benchmarks for PE, which would similarly reflect the unfavorable market then and therefore would also lower the bar staff had to hit to make bonuses, so it ought to wash out.
The point of this post appears to be twofold: exposing the utter lack of transparency at CalPERS, and exposing that the leadership is self-serving. Both points are made well.
But it is important to understand that the lack of transparency is not merely in service of executive bonuses. It is in service of the entrenched California political leadership who have been looting the Public Employees Trust Fund to the tune of $100 billion dollars, via high fee and “Mr. Market Had a Sad” investments laundered through their cronies in Real Estate and Private Equity.
Follow the Money…
https://twitter.com/JanGold_/status/1293590712747950081?s=20
Good find! That is the problem, isn’t it?