Lambert here: He’s b-a-a-a-c-k!!!! And I’m guessing no. Read all the way to the end, where you will see a glorious example of lack of agency in a policy recommendation. Readers?
By Alex Domash, Research Fellow, Mossavar-Rahmani Center for Business & Government Harvard Kennedy School of Government, and Lawrence H. Summers, Charles W. Eliot University Professor and President Emeritus Harvard University. Originally published at VoxEU.
In recent months, wage growth has showed signs of slowing despite an extraordinarily tight labour market, which has presented a puzzle for standard models of labour market slack. This column shows that contrary to what many have claimed, wage growth in the fourth quarter of 2022 was actually in line with what a standard Phillips curve model predicts. The authors argue that labour market tightness today implies wage growth that is roughly 1 to 1.5 percentage points higher than in 2019, and that without any additional softening in the labour market, this level of wage inflation is likely to continue in 2023.
The US labour market continues to be extraordinarily tight by nearly every measure of labour market slack. The unemployment rate – the most traditional indicator for labour market slack –is at a 50-year low at 3.4%. Other demand-side labour market measures such as the job vacancy rate and the quits rate, which recent research has shown to be better indicators of slack (Saez and Michaillat 2022, Furman and Powell 2021), suggest an even tighter labour market: there are nearly two job openings per unemployed, and workers are quitting at a faster rate than at any time before the Covid pandemic.
Despite historic levels of tightness, however, high-quality measures of wage growth have shown some signs of disinflation in recent months. In particular, the Employment Cost Index (ECI) for private salaried workers showed three-month wage growth slowing to 4.2% (annualised) in December 2022, compared to 5.1% over the previous 12 months. Given the recent slowdown in ECI wage growth, many have wondered whether views based on a traditional Phillips curve model are overly pessimistic as predictors of the likely course of inflation moving forward.
To evaluate this argument, we revisit the Phillips curve model used in our February 2022 paper (Domash and Summers 2022) and compare the model predictions for wage inflation in 2022 to realised wage inflation. Conditional on realised labour market tightness, our model predicted annual wage inflation in 2022 of 4.1% using the ECI for private salaried workers (versus 5.1% actual) and 4.9% using the average hourly earnings of production and nonsupervisory workers (versus 5.3% actual). While these predictions underestimate true wage inflation in 2022, they are consistent with wage growth over the last three months. These estimates are also closer to realized inflation in 2022 than the consensus Federal Open Market Committee’s (FOMC) summary of economic projections in December 2021 or the consensus forecast from the Federal Reserve Bank of Philadelphia’s Survey of Professional Forecasters (FRBP 2021), both of which projected core PCE inflation below 3%.
Contrary to what many have claimed, these findings suggest that wage disinflation in recent months can readily be reconciled with a standard Phillips curve model: wage inflation has begun to revert to trend after accelerating well beyond what would have been predicted by labour market slack in 2021 and early 2022. Specifically, labour market tightness today implies wage inflation that is roughly 1 to 1.5 percentage points higher than 2019 levels, which is what has been observed over the last three months. By the end of 2023, with no additional slack in the labour market, our model predicts annual wage growth to remain above 4% using any wage measure.
Wage Growth over the Last Year Has Been Unusually High
In Domash and Summers (2022), we compared alternative labour market indicators as predictors of wage inflation and found that vacancies and quits were better predictors than the unemployment rate. We then estimated a ‘firm-side’ unemployment rate from the unemployment rate that would have historically been consistent with observed levels of vacancies and quits, and found that this variable performed noticeably better than the actual unemployment rate in explaining wage growth from 2001 to 2019.
Figure 1 shows a traditional Phillips curve model with firm-side unemployment as the slack variable and wage inflation as the predicted variable (controlling for inflation expectations). Wage inflation is the 12-month percent change in ECI wages and salaries for private workers, and firm-side unemployment is the average firm-side unemployment rate over the previous four quarters. The blue dots denote observations before the second quarter of 2021, and the orange dots denote observations from the second quarter of 2021 to the fourth quarter of 2022.
Figure 1 Wage Phillips curve using firm-side unemployment as slack measure, 2001Q1–2022Q4
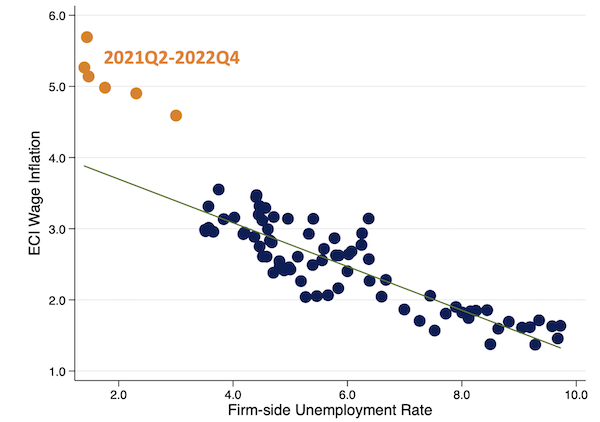
Note: The green solid line is the regression line for 2001–2019. Wage inflation is the four-quarter percent change in the ECI for private wages and salaries. Firm-side unemployment is the four-quarter (backward-looking) moving average of the unemployment rate consistent with the job vacancy and quits rates.
Sources: Bureau of Labor Statistics; authors’ calculations.
The scatterplot shows that between 2001 and 2019, a traditional Phillips curve model with firm-side unemployment as the slack indicator does a pretty good job of explaining annual wage inflation. However, over the last six quarters, year-over-year wage growth has been much higher than would have been implied by the historical relationship between labour market tightness and wage growth.
In Figure 2, we replicate the model used in Domash and Summers (2022) and show model predictions of 12-month wage inflation versus actual wage inflation for each quarter through 2022. The model used in the paper is a standard formulation of the Phillips curve, where wage inflation is driven by shifts in expectations, supply-side shocks, and demand-side factors. We use a four-quarter (backward-looking) moving average of the firm-side unemployment rate for our demand indicator, and a three-year weighted lag of CPI inflation to proxy for inflation expectations. The model is trained on pre-Covid data between 2001 and 2019 to avoid changes induced by the pandemic, and then predicts out-of-sample estimates for wage inflation post-2020 using the estimated coefficients on firm-side unemployment and inflation expectations.
Figure 2 Actual versus predicted year-over-year wage inflation, 2002Q1–2022Q4
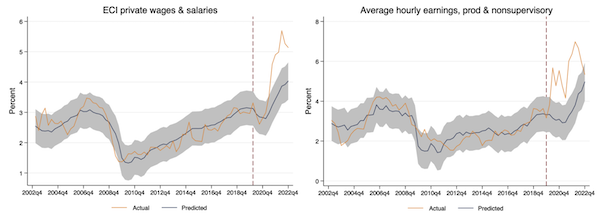
Note: The model regresses the four-quarter percent change in the wage measure on the four-quarter (backward-looking) moving average of the firm-side unemployment rate, and a 3-year weighted lag of CPI inflation (which applies a weight of 3 to inflation one year ago, a weight of 2 to inflation two years ago, and a weight of 1 to inflation three years ago) to proxy for inflation expectations. The model is trained on quarterly data between 2001Q1 to 2019Q4 to avoid changes in the relationships caused by the pandemic, and then used to predict out-of-sample estimates from 2020Q1 onwards. The 95% confidence interval around the predicted values is shown in grey. The model predictions are robust to a variety of different specifications for the lag length of the slack indicator and for the proxy used for inflation expectations.
Sources: Bureau of Labor Statistics; authors’ calculations.
The results above show that the model predicts wage inflation reasonably well before the pandemic, but has underpredicted wage growth over the last two years. Between the fourth quarter of 2019 and the fourth quarter of 2022, firm-side unemployment fell from 3.6% to 1.5%, while our proxy for inflation expectations increased from 2.0% to 4.4%. Together, these variables predicted an increase in wage growth from 3.0% to 4.1% using ECI private wages and salaries, and from 3.3% to 4.9% using average hourly earnings of production and nonsupervisory workers. The discrepancy between the model predictions and observed inflation suggests that some of the wage growth in late 2021 and 2022 was likely due to one-time effects like supply chain issues and reallocation shocks, which resulted in temporary wage inflation above what would be predicted by labour market slack and shifts in expectations alone.
In recent months, wage growth has showed signs of slowing compared to late 2021 and early 2022, which has led some to suggest that it’s possible to get further disinflation with less labour market slack than traditional models would indicate. We see two problems with this argument, however. First, our out-of-sample model predictions suggest that the slowdown in wage growth observed in the fourth quarter of 2022 is really just wage growth reverting to the pace that a standard Phillips curve model would predict. For example, ECI private wages and salaries grew by 4.2% (annualised rate) over the last quarter, which is roughly what our model predicted for ECI wage growth in 2022. Second, wage levels today remain roughly 2.5% higher (using the ECI) than what would have been predicted in 2019 given cumulative labour market slack. This suggests that some degree of mean reversion is to be expected under a standard Phillips curve model.
Outlook for Wage and Price Inflation Moving Forward
Table 1 presents a summary of actual versus predicted wage inflation in 2022, along with model predictions for wage inflation in 2023. Assuming no additional softening in the labour market, we predict annual wage growth to remain above 4% by the end of 2023 for every wage measure. Our predictions for wage growth in 2023 closely resemble observed wage growth over the last three months, and suggest that a further slowdown in wage growth is unlikely without additional slack in the labour market.
The table also presents the implied core PCE inflation rate that is consistent with our predicted wage inflation in 2023. Assuming underlying productivity and profit trends remain the same as they were in the two decades before the pandemic, our prediction for ECI wage growth would imply a core PCE inflation rate of about 3.5% in 2023.
Table 1 Summary of actual and predicted wage growth for 2022 and 2023
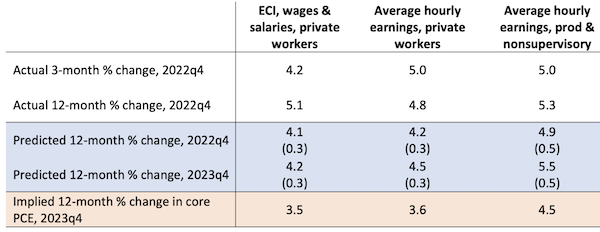
Note: The predicted 12-month percent change in wage growth in 2023q4 assumes that labour market tightness remains at the same level where it was in 2022q4 for the subsequent four quarters. Implied inflation is calculated using the average historical difference between 12-month wage inflation and 12-month price inflation from 2001 to 2019.
Sources: Bureau of Labor Statistics; authors’ calculations.
Overall, our results have shown that a standard Phillips curve model of labour market tightness has performed comparatively well in predicting wage inflation in 2022. Over the next year, our model predicts ECI wage inflation above 4%, and production and nonsupervisory wage growth above 5%. Without increases in productivity or margin compression, such high levels of wage growth are unlikely to be compatible with a 2% inflation target, which suggests to us that additional softening of the labour market is likely needed in the coming year.
References available at the original.


1. Do not question the 2% inflation target.
2. Do not consider that corporate profit margins might need to be reduced to accomodate the need for higher wages.
3. Do not question the idea that anything else might drive inflation other than a tight labor market.
4. Vanquish the idea that tight labor markets might drive firms to invest and improve productivity growth.
Gosh, I had thought that the Phillips Curve was a historical curiosity and did not even realise that it had traveled across the Atlantic. Although I guess the incorporation of inflationary expectations as a variable is part of how later economists brought it up to date.
Methodologically, I flicked through to the paper that comes up with the “firm-side unemployment rate” variable. It sounds convincing but I am a little sceptical as a starting point in all these regression type analyses that data mining to check out all sorts of other correlations has not also occurred too. Therefore, are we simply seeing some random correlation that the authors have chosen to report? Let’s assume not.
But when the model fails to predict current wage inflation accurately that then seems to be rationalised away as one off pandemic impacts. That may be true or it may simply mean the model is wrong to start with. Or perhaps one offs post the pandemic invalidate any attempts to extrapolate from the model, as the authors then proceed to do.
More fundamentally, my recollection is that rightly or wrongly the old Phillips Curve was used to argue that higher inflation as a policy choice was a way of enabling lower unemployment. This, of course, assumed amongst other things that wage inflation was a good proxy for the overall inflation rate and level of aggregate demand in the economy. However, the authors seem to have inverted this, as Lambert notes. Their final note seems to say that we need more unemployment to soften inflation. That seems a bizarre recommendation given that wage inflation does not equal price inflation, and that the interdependencies of monetary and fiscal policy, exchange rates, non domestically driven supply constraints, non labour driven supply constraints and so forth also impact recorded price inflation.
This is even more bizarre than the idea that raising interest rates somehow magically cures inflation.
Surely I have misread the article!
The hoary Phillips Curve claimed that you couldn’t let unemployment get too low or you’d get inflation. That’s right in line with Larry Summers’s basic theory about economics:
Whenever you let poor people get some money, The Invisible Hand will be angered, and He will curse the economy.
(For Larry Summers, The Invisible Hand must be a He. The job takes lots of math and hard stuff.)
I hate this stuff. Whenever there is a shimmering ghost on the horizon of wages actually reaching some sort of parity with profits then the sky is falling. But whenever profits are surging, well then that’s a good economy. WTF? And nobody is willing to approach the answer to, Why isn’t the economy working?
So after all the debate over the short run versus the long run trade off, the flattening of the Philips curve and what not, these guys are just dusting off this rather overwrought relationship and saying more job losses are needed? Why don’t we start with them?
LOL!!! The old economist joke is when does a recession start… when the economists are unemployed!
It was my understanding that the Phillips curve, like the NAIRU, had been abandoned due to a lack of empirical evidence for its existence, let alone its utility.
Summers’ attempts to resurrect the zombie are confirmation enough for me that the whole thing is at best a dead end, and most likely just another distraction in his ongoing efforts to provide justification for his plutocratic masters …
The Phillps Curve was almost valid for a short period, maybe in the 1960s (I don’t have my source with me at the moment)? Since then the points are a complete scatter.
The Farmer’s Almanac and your horoscope are more likely to be correct than Larry Summers, who thinks economic growth on a finite planet Earth will continue ad infinitum, along with his presence ad nauseam. Will no one rid us (figuratively) of this meddlesome pest?
Frankly the Phillips curve was more a statistical observation by Phillips than some iron law of economics that it was turned into.
His major interest was his hydraulic modeling of the British economy (he was an engineer by education), and the curve came out of that at some point.
The thing about this time period was that workers had little access to credit, thanks in part to the great depression and subsequent legislation.
Since he published his curve we have seen the repeal of said legislation and the introduction of credit cards etc.
Steve Keen has dedicated his life to similar modelling, and he has been talking for a decade now about the impact of consumer and business credit on the economy. More specifically that a change in the rate of issuing (delta) of credit has massive reverberations throughout the economy.
It is past time to just ignore Summers, shun him — to do otherwise just encourages him and others of similar skills, ability, and — I believe — integrity.