Yves here. As indicated in a post yesterday, falling gas prices and commodity prices offsetting inflation in other sectors, and arguably bolstering consumer spending, looks to be at an end. Wolf points to additional factors that suggest that inflation is far from tamed. Admittedly Wolf’s find today is mainly an artifact of measurement, but it will affect official reports and therefore policy responses.
By Wolf Richter, editor of Wolf Street. Originally published at Wolf Street
The Consumer Price Index (CPI) jumped by 0.40% in September from August, despite the still ongoing ridiculous monthly adjustments to the health insurance CPI that caused it to collapse by 37.3% year-over-year. Today’s CPI release is the last month with that adjustment; with the October CPI, to be released next month, the health insurance CPI will flip, adding further upward momentum to the CPI readings, instead of pushing them down.
The health insurance adjustment has caused CPI, core CPI, and core services CPI to be understated to an increasingly significant extent since October 2022, when the monthly health insurance adjustment started, one of the biggest data distortions resulting from the data chaos of the pandemic (more in a moment).
Core CPI, month-to-month accelerated to 0.32% in September from August even though it was held down by the collapse of the health insurance CPI:
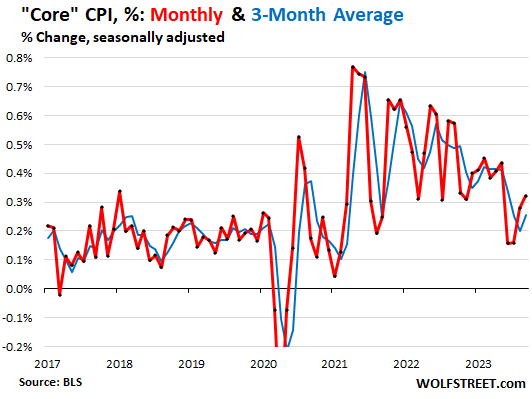
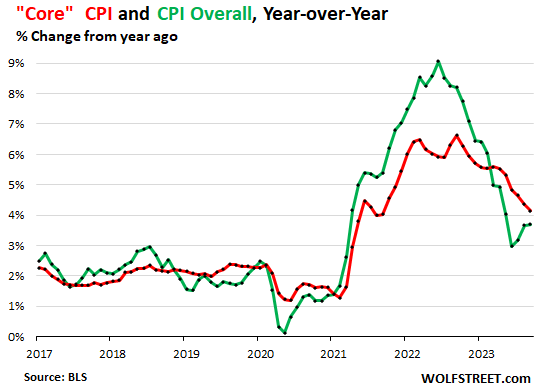
The year-over-year CPI accelerated to 3.70%, the third year-over-year acceleration in a row, after it had accelerated to 3.67% in August, and to 3.18% in July, from 2.97% in June, according to the Bureau of Labor Statistics today (green in the chart below).
The year-over-year “Core” CPI, which is designed to track underlying inflation by excluding the volatile food and energy products, rose by 4.1% year-over-year in September, seriously dragged down by the 37% year-over-year plunge in the health insurance CPI due to the odious adjustments that finally ended with September.
Fuel Prices Are Rising
After a steep hard plunge in energy prices in the second half last year, the process reversed this year, and in September overall energy prices rose 1.5% from August, and nearly wiped out the year-over-year plunge that had persisted since late last year.
On a month-to-month basis, gasoline prices have been surging all year – they jumped 2.1% in September from August and turned positive year-over-year (+3.0%). Gasoline accounts for about half of the total energy CPI.
Fuel prices – gasoline, diesel, jet fuel – also make their way into consumer products that are shipped by delivery van, truck, rail, or air as are nearly all consumer products. Jet fuel also makes its way into services via air fares. These products and services are included in core CPI, which is how core CPI reacts indirectly to rising energy costs.
| CPI for Energy, by Category | MoM | YoY |
| Overall Energy CPI | 1.5% | -0.5% |
| Gasoline | 2.1% | 3.0% |
| Utility natural gas to home | -1.9% | -19.9% |
| Electricity service | 1.3% | 2.6% |
| Heating oil, propane, kerosene, firewood | 4.8% | -5.6% |
The 37% Collapse of the Health Insurance CPI
September (this CPI release!) was the last month of the monthly push-down adjustments to the health insurance CPI, which started with the October CPI last year. For the October CPI, to be released in November, the adjustment will swing (I discussed the gory details here).
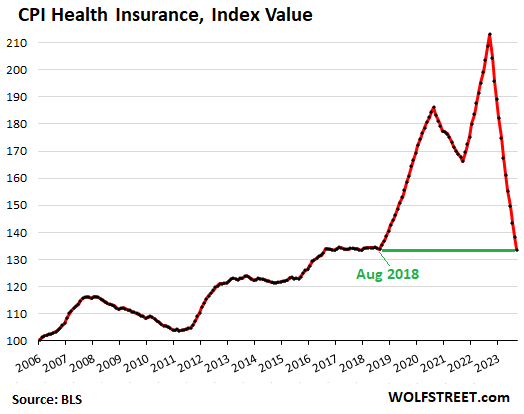
The adjustment pushed down the health insurance CPI every month on a month-to-month basis by 3.4%-4.3%, which has now caused the year-to-year health insurance CPI to collapse by 37.3%, despite widespread and big price increases of health insurance.
A 4% month-to-month plunge, as opposed to a 1% month-to-month rise, as would be the case, represents a month-to-month swing of 5 percentage points!
The 37.3% year-over-year collapse, instead of something like a 12% increase, as would be the case, represents a swing of nearly 50 percentage points!
The more we narrow down the CPI metrics – overall CPI to core CPI to services CPI to core services CPI – the worse this adjustment distorts the narrowed-down figures.
The health insurance CPI as a price index itself (not percent change) in September collapsed to the price level of August 2018, despite big health insurance increases since then. This adjustment has understated “core CPI” and even more so “core services CPI.” Mind-bendingly nuts:
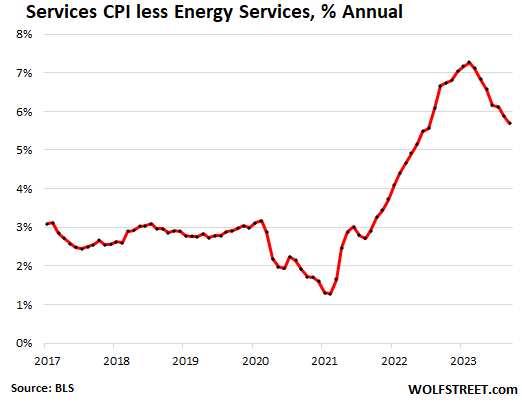
Core Services CPI Spiked Month-to-Month, Despite Collapse of Health Insurance CPI
The index for core services (without energy services) accelerated to 0.57% in September from August, the biggest increase since February, and the third month in a row of acceleration, despite the odious adjustment to the CPI for health insurance that weighs so heavily in this index.
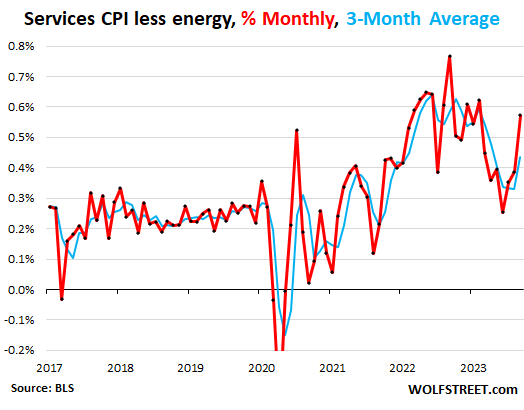
Year-over-year, the core services CPI rose by a still red-hot 5.7%, despite the 37.3% collapse of the health insurance CPI within it, and also due to the base effect related to the surge of the index a year ago:
Services CPI by Category
The table shows how hot many price increases in services are. The table is sorted by weight of each service category in the overall CPI. The CPI for medical services is the third largest item, with a weight of 6.3% in overall CPI, and over 10% in the services CPI, and it has been repressed by the collapse of the health insurance CPI within it, and turned negative year-over-year (-2.6%):
| Major Services without Energy | Weight in CPI | MoM | YoY |
| Services without Energy | 61.3% | 0.6% | 5.7% |
| Owner’s equivalent of rent | 25.6% | 0.6% | 7.1% |
| Rent of primary residence | 7.6% | 0.5% | 7.4% |
| Medical care services & insurance | 6.3% | 0.3% | -2.6% |
| Education and communication services | 4.8% | 0.1% | 2.5% |
| Food services (food away from home) | 4.8% | 0.4% | 6.0% |
| Recreation services, admission, movies, concerts, sports events | 2.2% | 0.3% | 0.2% |
| Motor vehicle insurance | 2.7% | 1.3% | 18.9% |
| Other personal services (dry-cleaning, haircuts, legal services…) | 1.5% | 0.6% | 6.8% |
| Motor vehicle maintenance & repair | 1.0% | 0.2% | 10.2% |
| Hotels, motels, etc. | 1.1% | 4.2% | 8.0% |
| Water, sewer, trash collection services | 1.1% | 0.2% | 5.2% |
| Video and audio services, cable | 1.0% | 0.2% | 6.3% |
| Airline fares | 0.5% | 0.3% | -13.4% |
| Pet services, including veterinary | 0.6% | 0.0% | 7.0% |
| Tenants’ & Household insurance | 0.4% | 0.9% | 2.8% |
| Car and truck rental | 0.1% | 0.0% | -8.6% |
| Postage & delivery services | 0.1% | 0.5% | 4.6% |
The Two CPIs forHousing as a Service (“Shelter”).
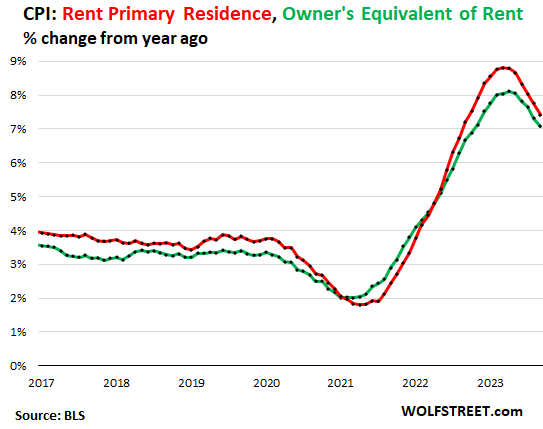
“Rent of primary residence” accelerated to +0.49% for September (6.0% annualized), matching May, and both were the highest since June. There has been no slowdown at all since June, which disappoints a lot of folks, including Powell, who’d said for well over a year that rents were lagging, and that we’d soon see this slowdown back to normal levels any moment now.
What did happen was a slowdown from the 8% year-over-year range to the 6% range, and it has gotten stuck at the 6% range over the past five months.
Year-over-year, the CPI for rent increased by 7.4% (red in the chart below).
The survey follows the same large group of rental houses and apartments over time and tracks what tenants, who come and go, are actually paying in these units.
Owners’ equivalent of rent accelerated sharply to 0.56% in September from for August (6.9% annual rate), the biggest increase since February, and there has been no improvement since February.
Year-over-year, the OER index increased by 7.1% (green). This is based on what a large group of homeowners estimates their home would rent for:
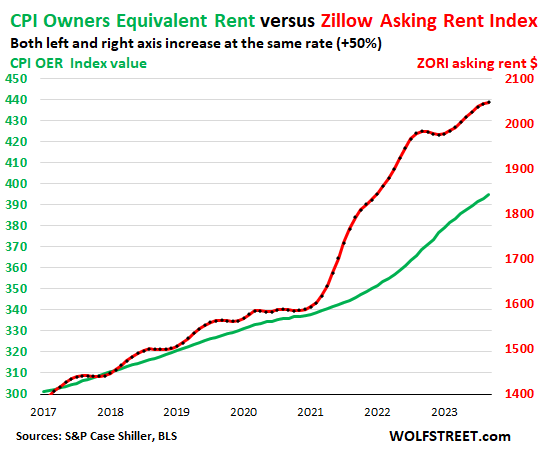
“Asking rents…” The Zillow Observed Rent Index (ZORI) and other private-sector rent indices track “asking rents,” which are advertised rents of vacant units on the market. Because rentals don’t turn over that much, the ZORI’s spike in 2021 through mid-2022 never fully made it into the CPI indices, as not many people actually ended up paying those spiking asking rents.
In late 2022, asking rents in dollar-terms began to dip, but then began to rise again this year, and started hitting new records in dollar-terms.
Asking rents are very seasonal, though actual rents don’t show much seasonality. This time of the year is normally the slowest time for asking rents. In a number of Septembers before the pandemic, the ZORI showed actual declines from the prior month. This September, the ZORI rose 0.2%.
The chart shows the OER (green, left scale) as index values, not percent change; and the ZORI (red, right scale). The left and right axes are set so that they increase each by 50%, with the ZORI up by 47.7% since the beginning of 2017 and the OER up by 31.2%:
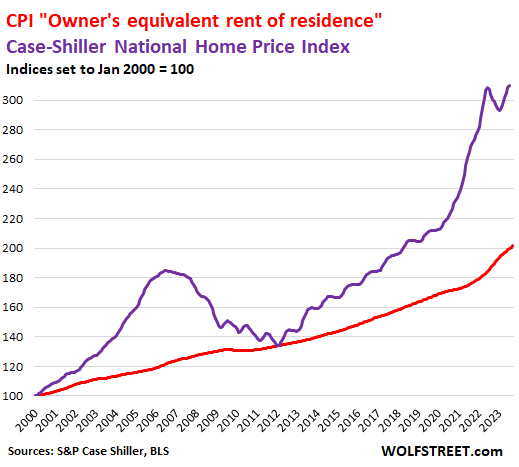
Rent inflation vs. home-price inflation: The red line represents the OER. The purple line represents the Case-Shiller Home Price Index. The CS index lags about three months. Both lines are index values set to 100 for January 2000:
Durable Goods Prices Drift Lower from Nosebleed Levels
The CPI for durable goods, after blowing to astronomical zone, has been meandering lower:
| Durable goods by category | MoM | YoY |
| Durable goods overall | -0.4% | -2.2% |
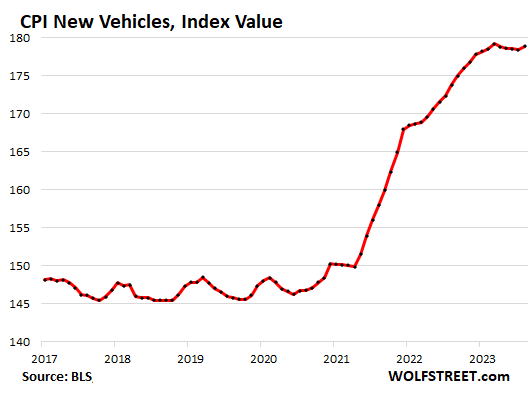
| New vehicles | 0.3% | 2.5% |
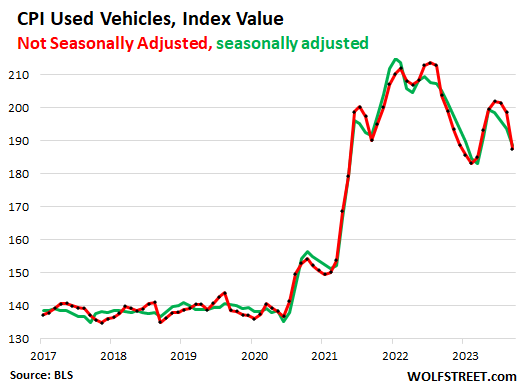
| Used vehicles | -2.5% | -8.0% |
| Information technology (computers, smartphones, etc.) | 0.3% | -7.9% |
| Sporting goods (bicycles, equipment, etc.) | 0.0% | -0.1% |
| Household furnishings (furniture, appliances, floor coverings, tools) | -0.3% | 0.9% |
New vehicles CPI rose for the second month in a row in September from August (+0.4%), and the index value set a new all-time high and was up 2.2% year-over-year.
For many years before the pandemic, the new vehicle CPI was essentially flat with some ups and downs, despite large increases of actual vehicle prices. This is the effect of “hedonic quality adjustments” to the CPIs for new and used vehicles and also other products (here’s my chart and detailed explanation of hedonic quality adjustments).
Used vehicle CPI has gyrated all over the place after the historic spike in used vehicle prices that started in 2020 and peaked at the end of 2021. The used vehicle CPI fell by 2.5% seasonally adjusted in September from August, and by 8.0% year-over-year. From the peak, it has now fallen by 12%, but it’s still up by 35% from September 2019.
Note the effects of the hedonic quality adjustments in keeping prices level in the years before the pandemic even as actual used vehicle prices rose:
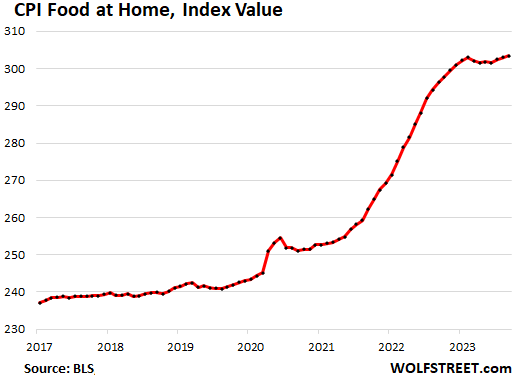
Food at home: price increases calmed down, prices remain very high.
Price increases of food bought at grocery stores and markets have calmed down but prices remain astronomically high, following the 24% spike during the pandemic.
The CPI for “food at home” rose by 0.1% month-to-month, and by 2.4% year-over-year, the least in over two years.
| Food at home by category | MoM | YoY |
| Overall Food at home | 0.1% | 2.4% |
| Cereals and cereal products | 0.2% | 3.6% |
| Beef and veal | 0.6% | 7.0% |
| Pork | 1.6% | -1.7% |
| Poultry | 0.4% | -0.4% |
| Fish and seafood | -1.2% | -1.5% |
| Eggs | 0.9% | -14.5% |
| Dairy and related products | 0.1% | -0.2% |
| Fresh fruits | -0.1% | 0.1% |
| Fresh vegetables | -0.4% | -1.2% |
| Juices and nonalcoholic drinks | -0.4% | 4.4% |
| Coffee | 0.7% | 1.6% |
| Fats and oils | -0.5% | 2.7% |
| Baby food & formula | 2.3% | 9.2% |
| Alcoholic beverages at home | 0.8% | 2.9% |


> hedonic quality adjustments – from Wolf’s link
ten speed computer controlled transmissions = junk
When that breaks, prepare for a $15,000 hit to the wallet or scrap the car.
In my book, no car newer than the mid 2000’s is worth owning. All of them are overly complex shitboxes.
An acquaintance got a Honda Insight hybrid compact, and is very pleased. For driving exclusively in town, gas bill is sharply down, although the insurance for hybrid is higher, and it is a neat car. Perhaps short of zoom and zazz?
OTH, the value of hedonistic adjustment is personal. E.g. some people cannot live without GPS, I am fanatic about memorizing maps and I often dislike routes suggested by, say, Google Maps.
Aren’t all the hedonic quality adjustment prices bogus. At the time, 3-speed automatics were the state of the art and the pricing reflected that and prices weren’t adjusted compared to a manual transmission for CPI calculations used to lower Social Security and other increases. The same with cell phones. The 25 year old Motorola was state-of-the-art at the time and very expensive compared to land line phones. There was no hedonic quality adjustment to the CPI at the time. In real dollars, the price of the old Motorola phone was probably higher than the new model smartphones adjusted for inflation. The PTB need to eliminate this bogus “adjustment” like they did with the health version.
OTOH, I was astonished when I needed to replace a 10YO hard drive that crashed after about 10 year of use.
1Tbyte was $29.99. Everything else sure is expensive but that was a happy surprise.
But you will need to buy several to run in RAID and/or a samsung SSD because new disk drives are much less reliable than oldies.
Health insurance down 37%! Biden should run for re-election on that alone. And of course this means car insurance will drop, too. Slogan: “Who cares we’re sending billions to Ukraine and Israel and your children wont get jobs because cheap labor immigrants will choke them out the job market…when your Healthcare just went down by 37%!”
Well the Social Security cost of living increase was determined with the figures released yesterday. And as they try to say inflation isn’t so bad they can use that number.
The thing is people know the various price indexes are full of it. There are some not obscenely wealthy individuals who don’t have to really worry about increased prices, but there are less and less of them every year. It isn’t just Biden who has to worry about it
There was an article the other day wondering why Republicans aren’t running on the economy. If even half of what this suggests happens, every one running against an incumbent should run on the economy.
Republicans are. They don’t want to get caught on anything, so they are running on immigration, they took our jobs. Noise is important as they don’t want to eat too specific, but they want to attract every tech worker and so forth, immigrants who are entrenched, people in urban cores who are above the federal poverty line, maybe not the local equivalent.
Probably zero percent of the immigrants coming under refugee status (coming across the southern border mostly) are not tech educated to take those tech jobs. It’s the worker visa programs championed by the tech executives that result in the loss of tech jobs to the tech skilled low wage foreign worker immigrants.
Team Blue, run on this: “We reduced your Healthcare costs 37%! Re-elect us!” It will definitely stand up to fact checkers by default especially if they start talking about hedonic quality adjustments.
Except for everyone they threw off Medicare, Medicaid etc.
And they wonder why no one likes them…
Health care insurance got less expensive?
LOL. Pull the other one. They aren’t even pretending any concordance with reality.
Strip out ‘volatile’ food and energy costs. Well, first off, they they are not volatile. Like interest rates, they take the rocket up, and the 1:18 inclined plane down.
I was just thinking about the adage I first saw here— 100% of debts that cannot be paid will not be paid.
It seems there is a brutal corollary: 100% of the items that are beyond the reach of the low-income wage earner will be foregone— food, energy, and health care and/ or health insurance. Good these are not integral to life! What. A. Country.
Austerity, moralism, and self-righteous and self-lefteous punishment by the Power People. I’m ’bout had it.
PS… the data is so disingenuous… couple this with things like the mRNA covid vaccine debacle, cdc and public health vaccuums/ voids and very mixed messaging. Confidence is at an all time low and cynicism is on the rocket ship with interest rates, food, energy and health care costs .
My projection has been inflation will come back again, my guess is from higher oil prices. There has been extreme volatility in the oil trades which has kept the price down, its almost not tradeable. Spidy senses have been that the Eurozone has been exercising that for obvious reasons considering their energy crisis. That said the lack of capex in oil just seems like it has to hit us here eventually. Yes I’m talking near term, not for you peak oilers.
I’ve also been entirely wrong since the Ukraine invasion by saying since day 1 oil prices would go to the moon and have been mostly wrong to my surprise…
Nonetheless it seems like inflationary periods are never one and done, with swings back and forth as monetary policy changes.
I’m thinking Arab Oil Embargo part II.
“Acceleration of Inflation Continues … “. From the data and laws of mechanical physics, the inflation is not “accelerating”. Some graphs show deceleration as if it has peaked. It is just remains sustained at a velocity higher than we wish, costing us more than we wish.