Yves here. I trust readers will be able to recontextualize what many will see as a self-discrediting throwaway remark by the author at the top of the post. Anglosphere economists have still not gotten the memo from Alex Vershinin’s 2022 paper, The Return of Industrial Warfare: that it would take a decade for the West to catch up with Russian weapons manufacturing capability. Andrei Martyanov has documented in a series of books that the US is a declining military power (this before Ukraine turned into a demonstration) and that GDP and military spending measures do not capture effectiveness (which is particularly true given how the US arms-as-pork- machine is great at producing expensive fussy weapons that often prove to be fragile in the field).
So the way to think about this piece is that even using conventional spending metrics that likely understate China’s position, it’s already become number one in manufacturing. And by a healthy margin.
By Richard Baldwin, Professor of International Economics IMD Business School, Lausanne; VoxEU Founder & Editor-in-Chief VoxEU.org. Originally published at VoxEU
The US is the world’s sole military superpower. It spends more on its military than the ten next highest spending countries combined. China is now the world’s sole manufacturing superpower. Its production exceeds that of the nine next largest manufacturers combined. This column uses the recently released 2023 update of the OECD TiVA database to paint an eight-chart portrait of China’s journey to superpower status and the asymmetric impact that its dominance has had on global supply chains.
I’m not an expert on China, but during ongoing work on global supply chain disruptions with my co-authors Rebecca Freeman and Angelos Theodorakopoulos, I’ve noticed a stark fact that I don’t think is as widely known as it should be. China is the now world’s sole manufacturing superpower.
This column uses the OECD’s recently released 2023 update of their invaluable TiVA database to show, in eight charts, how this came to be. I will skip the historical Chinese reform narrative as that has been well covered by real China experts (e.g. Wang 2023, World Bank 2013, Ranganathan 2023).
The World’s Big Players in Manufacturing
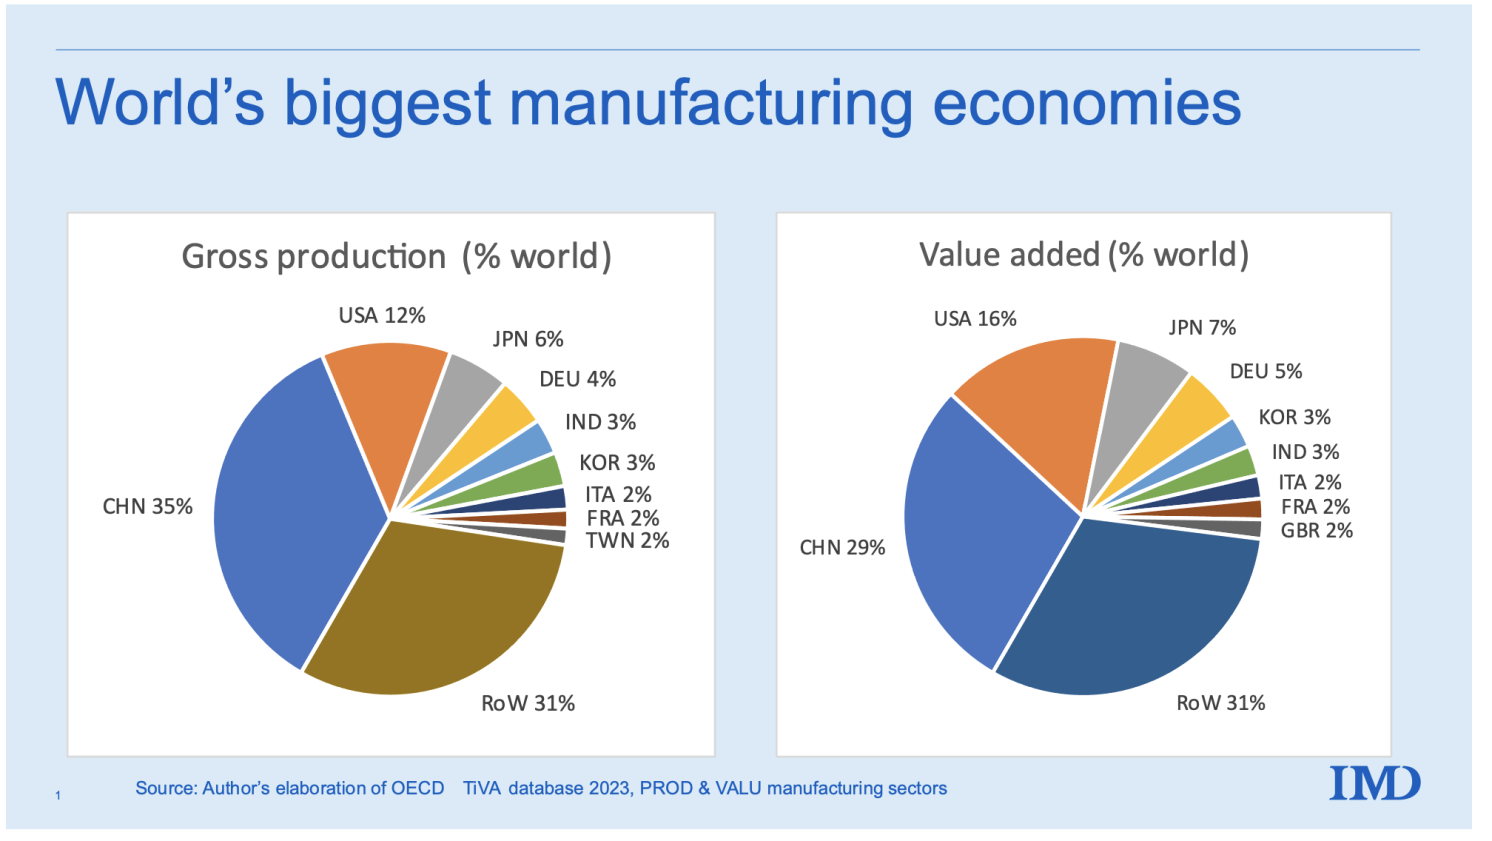
The charts in Figure 1 show two views of global manufacturing shares in 2020 (the latest year in the database). The left panel displays world shares in terms of gross production; in the right panel, the same is shown in terms of value added. The distinction is in intermediate inputs: Chinese gross production equals the total sales of Chinese manufacturers; Chinese value added is their gross production minus the purchased intermediates.
Figure 1 Slicing the global manufacturing pie, 2020, gross production basis
Source: OECD TiVA database, 2023 update.
Six nations manufacture at least 3% of the world total. China is followed by the US, Japan, Germany, India, and South Korea. Note how the world has changed. Only three of these are long-established industrial economies; the other three are newly industrialised economies. Four of the G7 don’t make the cut. The chart separately identifies nations with shares of at least 2%, and on the left, this includes Italy, France, and Taiwan (two of the G7, the UK and Canada, don’t make the cut). In the right panel (value-added basis), the UK makes an appearance with a share just above 2%.
When it comes to gross production, China’s share is three times the US’ share, six times Japan’s, and nine times Germany’s. Taiwan, Mexico, Russia, and Brazil now have higher gross output than the UK. Canada is further down the ranking, in 15th place.
Unprecedented Industrialisation
China’s industrialisation is unprecedented. The last time the ‘king of the manufacturing hill’ got knocked off the throne was when the US surpassed the UK just before WW1. It took the US the better part of a century to rise to the top; the China-US switch took about 15 or 20 years. China’s industrialisation, in short, defies comparison.
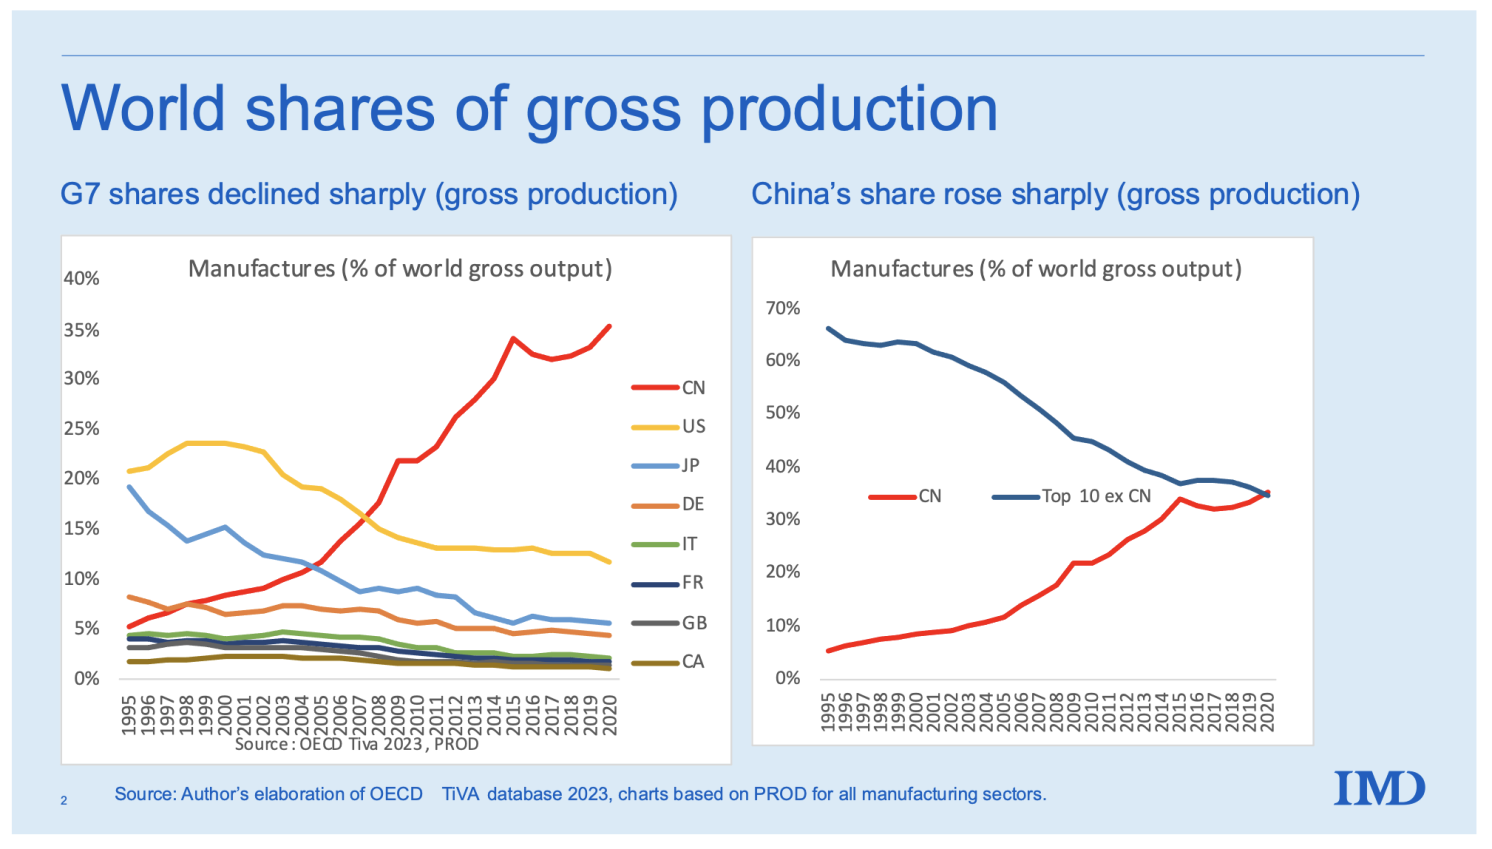
Figure 2 portrays how China dethroned the king of the hill. If we think of this as a 25-lap horserace – one lap per year – all the excitement was in the first 13 laps. Since data only go back to 1995, China started the race a bit ahead of Canada, Britain, France, and Italy. China passed Germany in 1998, Japan in 2005, and the US in 2008. Since then, China has more than doubled its world share while the US’s share has fallen by another three percentage points. If this were a live horserace, boredom would have driven most of the audience away years ago.
The right panel shows that China’s share now exceeds that of the next largest manufacturers combined. This remarkable fact helps us to understand current US-China trade tensions, and the magnitude of supply chain disruptions that occurred when China dialled down its production during Covid. India (not shown separately) was the second fastest share gainer: its global share of manufacturing production rose by two percentage points since 1995.
China’s rise has slowed and looks to have stagnated at about a third of world output. To confirm this, however, we will need more recent data since the last two years in the sample are muddled by events related to the Covid-19 pandemic. The World Bank’s World Development Indicators (WDI) has data to 2022 for value added, and these conform to the flattening narrative, but the WDI do not report gross production data.
Figure 2 China’s meteoric rise in manufacturing, 1995-2020 (world gross production shares) 1
Source: OECD TiVA database, 2023 update.
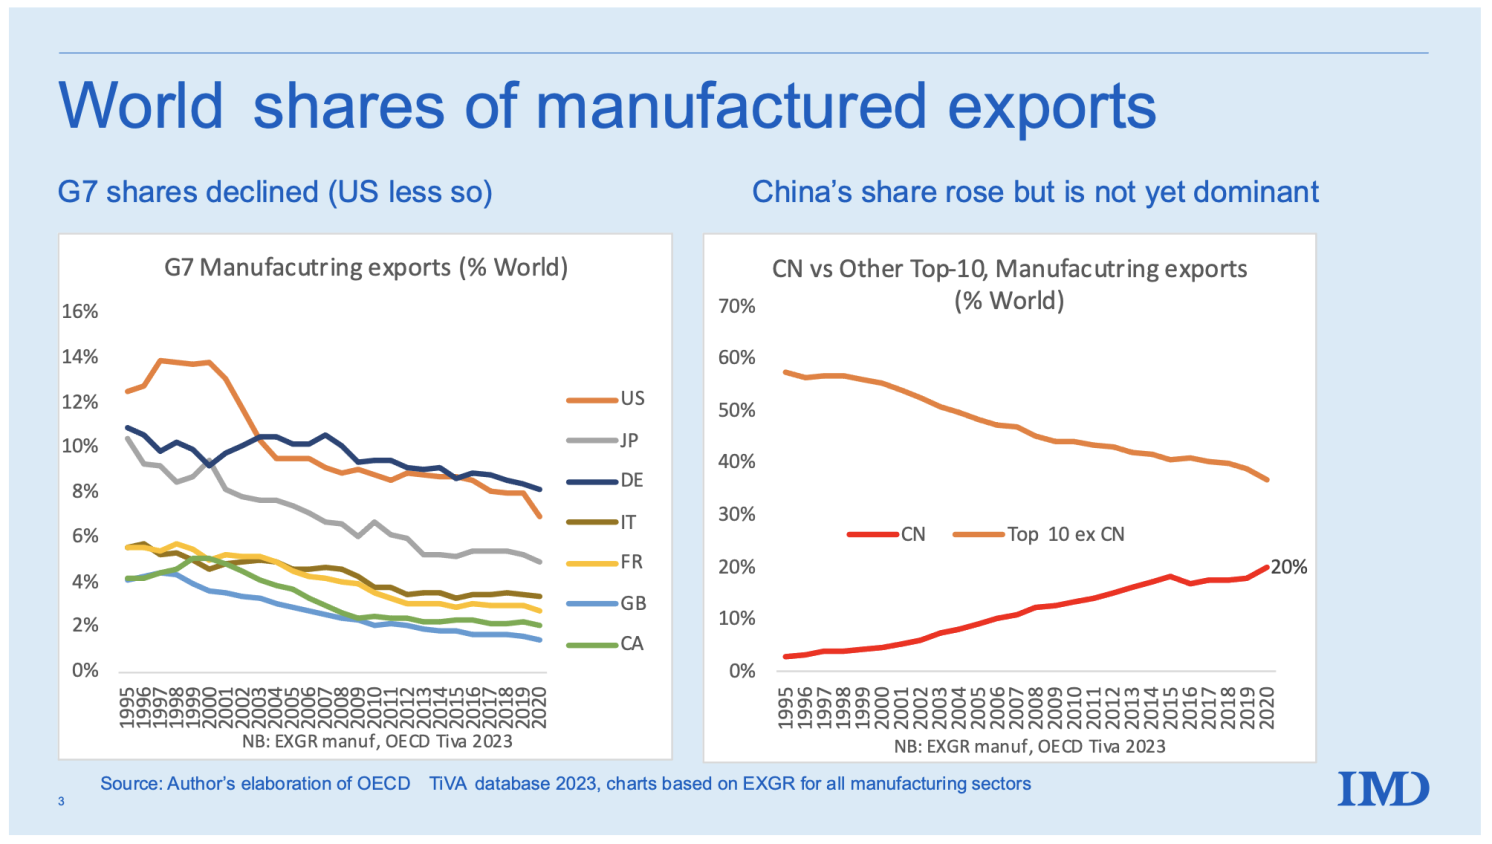
China’s dominance is less stark in exports (Figure 3), though the rise is equally amazing. In 1995 China had just 3% of world manufacturing exports, By 2020, its share had risen to 20%. The corresponding fall in the G7 share was less dramatic than for its share of production. This is explained by the meteoric rise in Chinese domestic consumption, which has absorbed an increasing share of its manufacturing production since 2004. Not shown in the charts is that China’s export to production ratio, having peaked at 18% in 2004, is 13% in 2020 – almost back to its 1995 level of 11%. The same diagrams in the Annex are shown for a value-added basis.
Figure 3 China’s share of world manufacturing exports, 1995-2020
Source: OECD TiVA database.
Asymmetric Supply Chain Exposure: G7 and China
The global supply chain indicators that Rebecca Freeman, Angelos Theodorakopoulos and I developed last year (Baldwin et al. 2022) provide a convenient way of identifying foreign production exposure in supply chains (eight of our new indicators can be found in the TiVA 2023 update). Two of our new indicators are particularly intuitive when it comes to portraying global supply chain exposure.
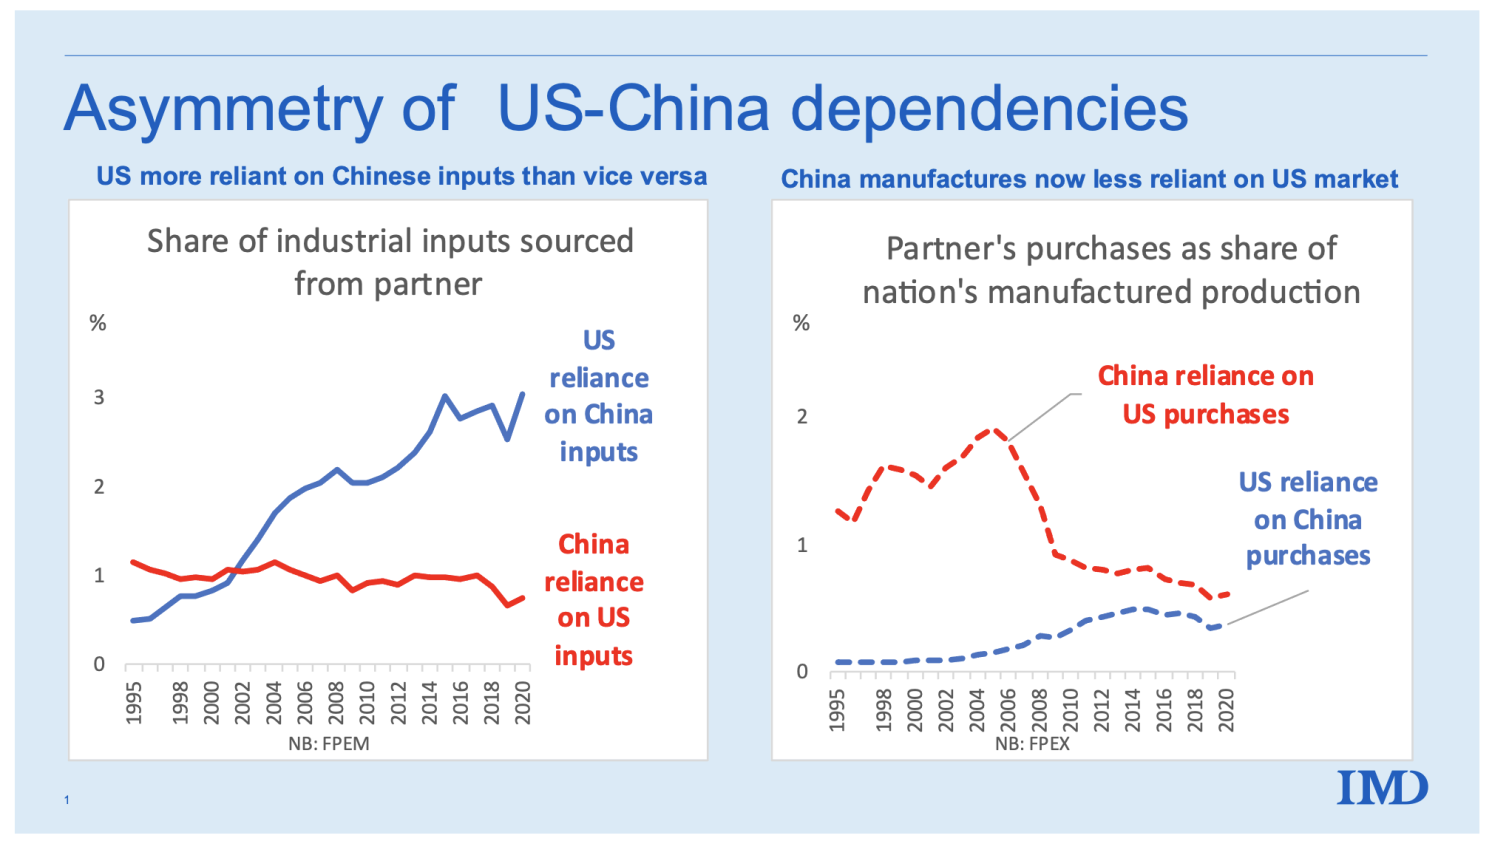
- Foreign Production Exposure: iMport side (FPEM). This shows the share of all industrial inputs (including domestically sourced inputs) that one nation sources from another on a scale of 0 to 100. FPEM accounts for exposure on a look-through basis in the sense that it looks through the suppliers-to-suppliers veil to discover the purchasing nation’s reliance on production in the selling nation.
Figure 4, left panel, shows that the US relies far more on Chinese manufacturing production than vice versa. 2 While shocking at first sight, this should not be unexpected. It is natural that a country with 11% of the world output buys more from a country that produces 35% than vice versa, but the numbers are astounding. China was more exposed to US inputs before 2002, but the US has had greater exposure since then. In 2020, the US was about three times more exposed to Chinese manufacturing production than vice versa.
- Foreign Production Exposure: eXport side (FPEX). This indicator reflects the share of a nation’s gross output of intermediate goods that is exported to a particular partner. It is a measure of exposure on the sales side.
Figure 4, right panel, shows the expected result: China is and always has been more reliant on sales to the US than the other way round. In the mid-2000s, China’s dependence on the US was ten times the reverse dependence, but the asymmetry has narrowed substantially.
Putting together the pieces, this shows a remarkable, historical, world-shaping asymmetry in supply chain reliance between China and other major manufacturing countries. Politicians may wish to decouple their economies from China. These data suggest that decoupling would be difficult, slow, expensive, and disruptive – especially to G7 manufacturers. For explicit estimates, see the simulation studies by Felbermayr et al. (2023) and Goes and Bekkers (2022).
Before closing this chapter on the China rise story, it is important to say that the massive asymmetry has nothing really to do with China. It has to do with China’s superpower standing in manufacturing. To see this, imagine what the charts would look like if they displayed the facts for OPEC and the G7 in the petroleum sector. We would see that the G7 is massively more dependent on OPEC supplies than vice versa. The next chapter of the story redirects the spotlight to the China level.
Figure 4 China and US bilateral FPEM and FPEX, 1995-2020
Source: OECD TiVA database.
China’s Balance of Trade by Sector, Supply Chain Engagement, and Openness
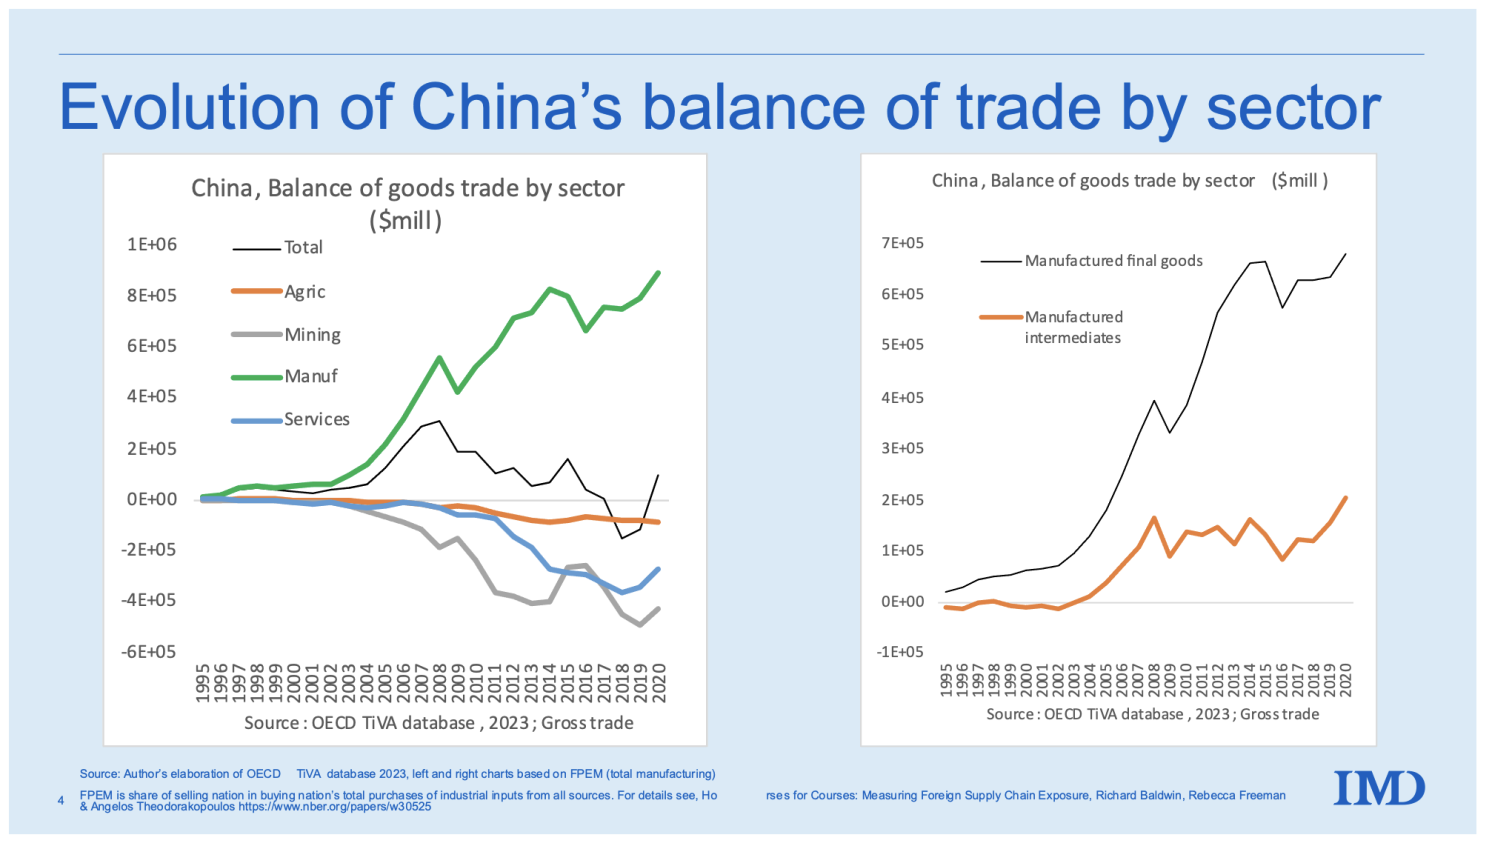
What does the rise to superpower status look like from the shores of China? One convenient, if simplistic, yardstick of a country’s competitive profile is its balance of trade by sector.
The left panel of Figure 5 shows the balance of exports less imports in the major sectors: manufactures, agriculture, mining, and services. The overall trade balance, which is just the sum of the sectoral balances, is shown with the thin black line. The pattern is as clear as it is unsurprising. China is a net exporter of manufactured goods and a net importer of everything else – agriculture goods, mining goods and fuels, and services. Both the positive and negative net balances have been growing quickly. Plainly, China is a big importer and a big exporter. Overall, it ran surpluses in the late 2000s, which then decreased and turned negative in 2018 and 2019 (black line).
The right panel provides important hints about the evolution of China’s manufacturing. It charts the evolution of the country’s net exports of intermediate inputs and final goods. Until the mid-2000s, China was a typical offshore destination: a net importer of intermediate inputs and a net exporter of final goods that embodied the imported inputs. From about 2002, China became a large net exporter of intermediate goods as well as final goods.
Figure 5 Net exports by sector, China, 1995 to 2020
Source: OECD TiVA database.
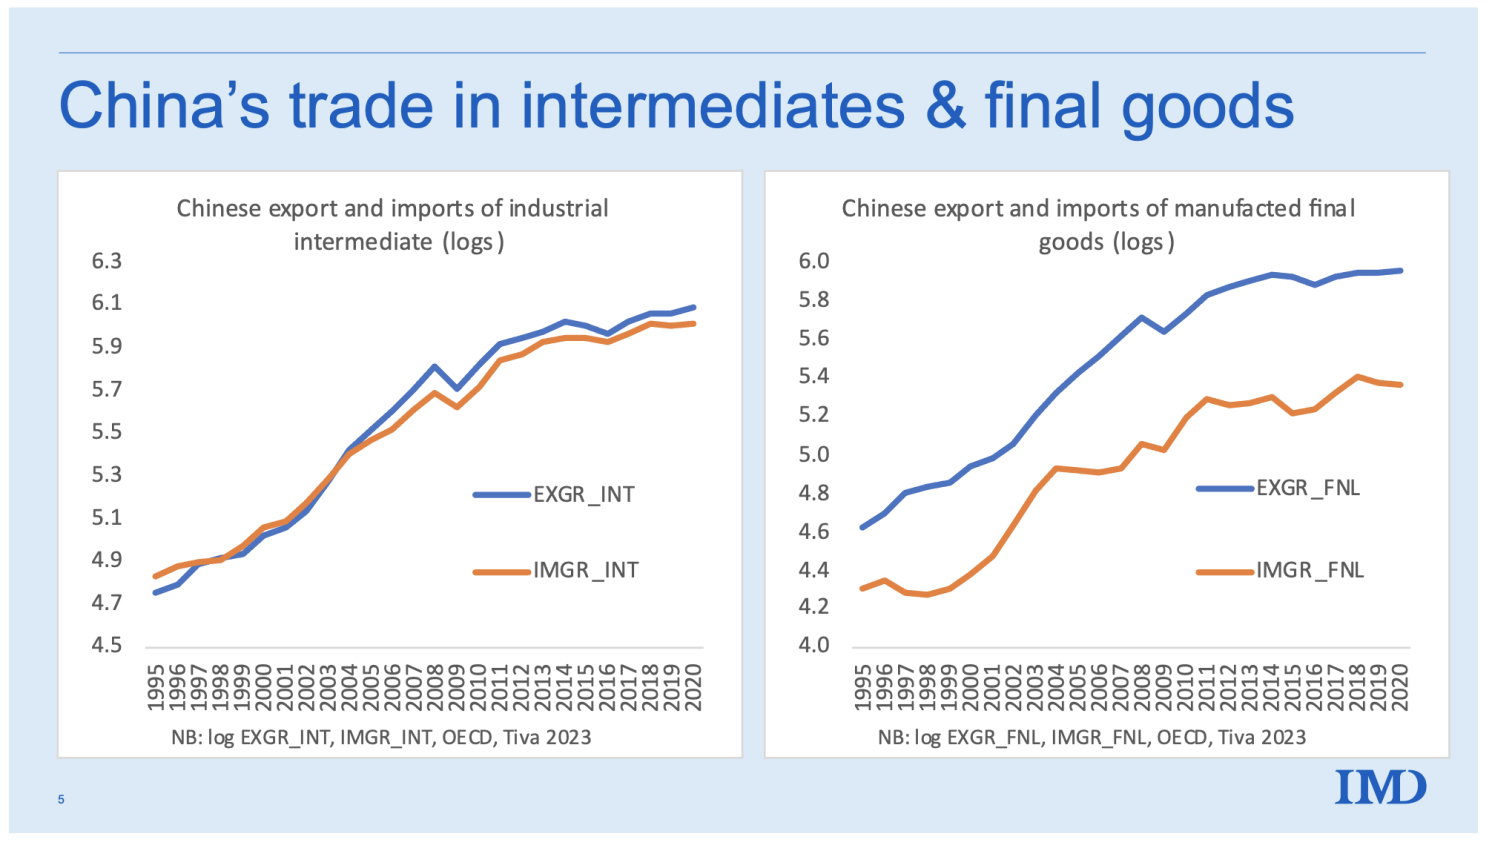
Aggregate balance-of-trade numbers like those in Figure 5 can hide the evolution of the constituent parts. Figure 6, which focuses on manufactured goods, shows exports and imports separately. In the left panel, we can observe that China’s engagement with global supply chains was extremely vigorous until the mid-2000s. Imports and exports of industrial parts and components were growing rapidly, and imports and exports were growing in tandem. Afterward that, exports grew faster, and this difference has produced the positive balance in manufactured goods..
The right panel shows a different picture for final manufactured goods. Here, exports have always exceeded imports, with the imbalance growing rapidly in the 2010s.
Figure 6 Trade in intermediates versus final goods, China, 1995 to 2020
Source: OECD TiVA database.
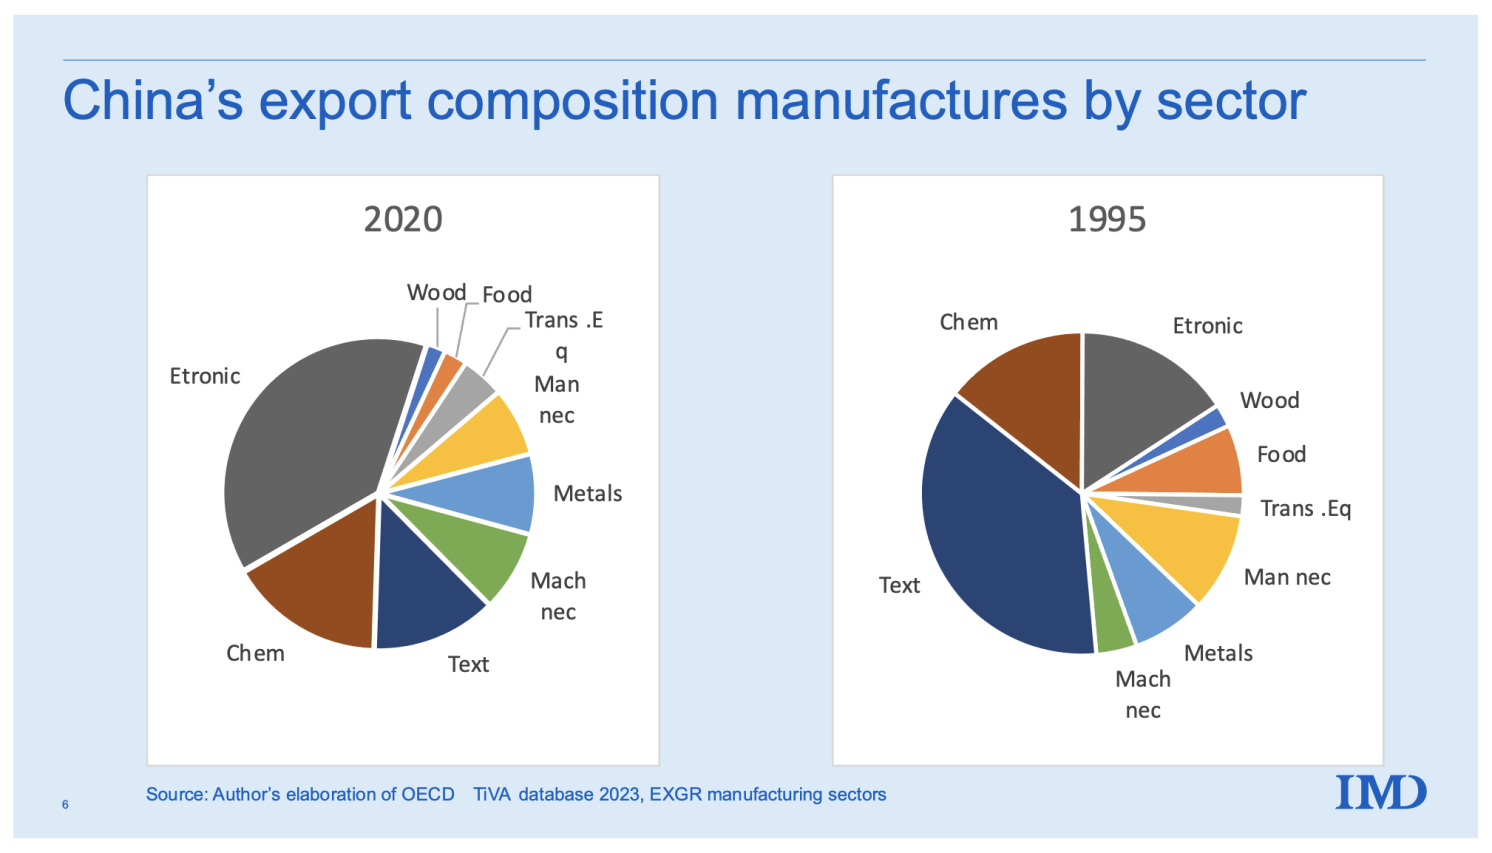
The next pair of charts shows the change in the sectoral composition of China’s exports.
Figure 7 presents the sectoral shares for 1995 (first year in the database) and 2020. It shows that China has moved from being relatively reliant on simple manufacturing sectors like textiles and clothing to more sophisticated sectors like electronics, basic and fabricated metal products, and chemicals and pharmaceuticals. A telling factoid is that textiles accounted for the biggest share in 1995, but electronics did so in 2020.
Figure 7 China’s export basket, 1995 versus 2020
Source: OECD TiVA database.
Globalisation Ratio
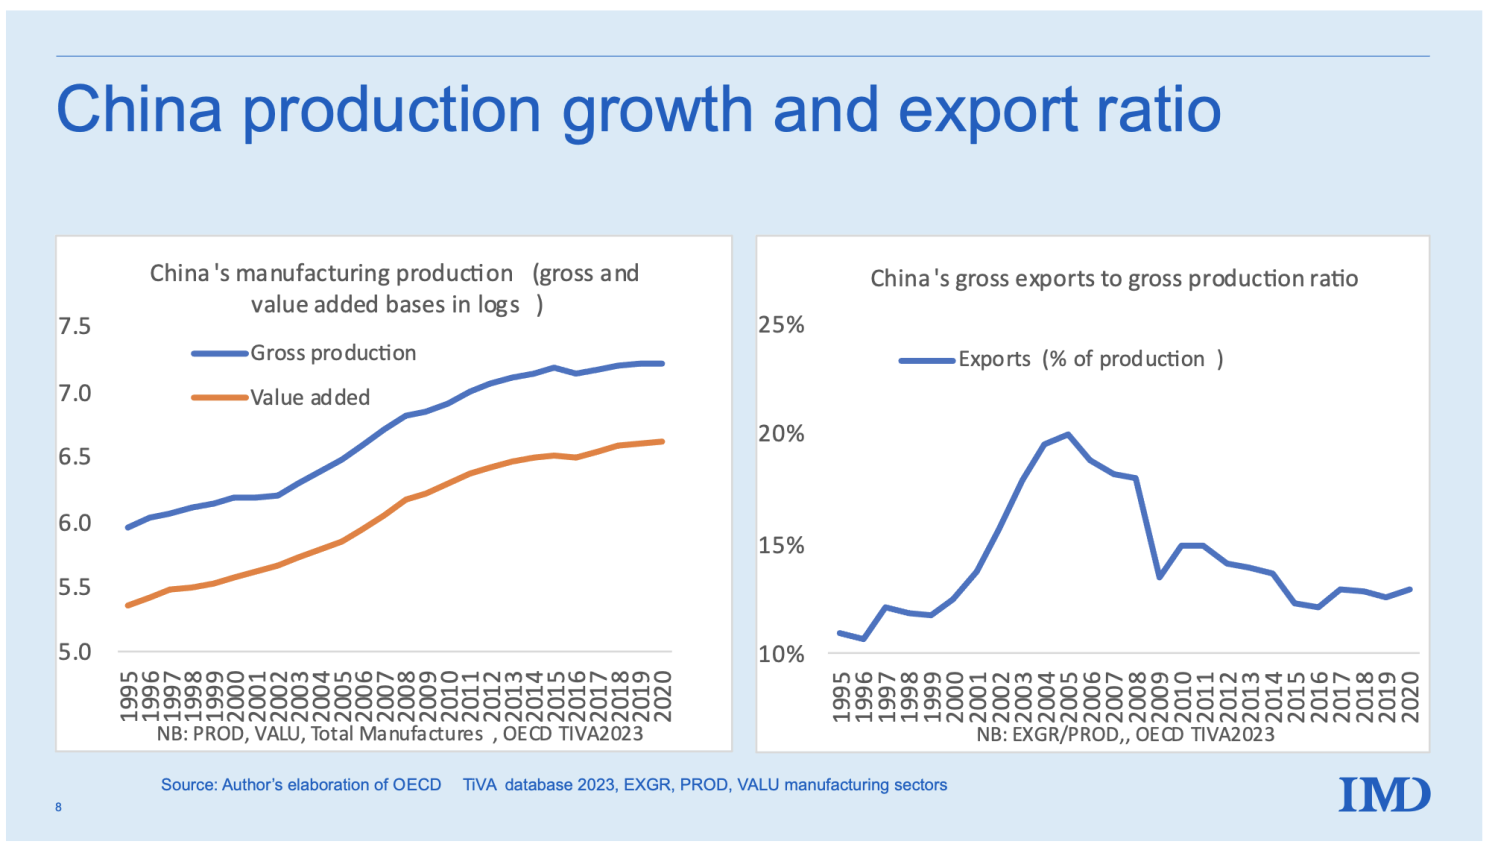
Finally, consider China’s globalisation ratios (Figure 8). The right panel exhibits the country’s gross globalisation ratio (GGR) in manufacturing. This is the share of manufactured production that is sold abroad, where production is measured as the total sales of all China-based manufacturers. It differs from manufacturing GDP since it includes all sales, not just final good sales.
Turning to the facts, we see that during its rise to manufacturing superpower status, China’s GGR rocketed up – almost doubling – in the first decade of the data. Indeed, most of the action came between 1999 and 2004. That period was an extraordinary feat of globalisation, and it is probably why so many think of China as an economy that is incredibly dependent on exports. But the story doesn’t end in 2004.
Since 2004, China’s GGR has been falling steadily. And don’t miss the fact that it is, in 2020, not far above where it started in 1995. Chinese manufacturing, in short, is no longer as dependent on exports as many might believe. True, the first part of the rapid growth period involved exports growing faster than production (so the GGR rises). But then production grows faster than exports, implying that domestic sales were becoming relatively more important, compared to export sales – even though domestic and foreign sales were both booming throughout the high-growth episode. This dispels the myth that China’s success can be entirely attributed to exports. From around 2004, China increasingly became its own best customer.
The takeaway is simple: China’s openness, as measured by the GGR, has fallen rapidly. By 2020 it was only slightly more dependent on export sales than it was 1995.
Figure 8 China’s manufacturing growth and Gross Globalisation Ratio (GGR)
 >
>
Source: OECD TiVA database.
Concluding Remarks
China is now the world’s sole manufacturing giant. As its recent success in electric vehicles demonstrates, its wide and deep industrial base can help it gain a competitive edge in virtually all sectors. The exceptions are the most advanced sectors, where the G7 countries still dominate.
Politicians who indulge in loose talk about decoupling from China need a clear-eyed look at the facts. As we have shown (Baldwin et al. 2023), all the major manufacturers in the world source at least 2% of all their industrial inputs from China. Decoupling would be difficult, to say the least.
See original post for references


During another lifetime ( the mid ’90’ s) I manufactured doors and door assemblies for local buildimg contractors. I had a favorite Stanley hinge that I bougjt in case lots. One day I went to my supplier to purchase more stock to find that the hinge model was no longer available. I was shown its Stanley replacement only to reject them due to poor design and craftsmanship. My salesman then showed me a Chinese made model which I decided to purchase, their being nearly identical to the Stanley model I previously purchased, if not made by the very same machinery.
With that anecdote, you now have me wondering. Using your story, consider this scenario. The US made Stanley hinges and was good at it. Because they are only a low-tech, engineering product, the Chinese then make their own version of those Stanley hinges as they have doors in China too. But supposing, just supposing, that Stanley decides to cut costs in its production line like so many other industries have and now makes a crapified version of those hinges which you encountered in the mid 90s. This was done to make Wall Street happy for a day followed by the appropriate bonuses. Meanwhile the Chinese are still knocking out the original Stanley hinges which you found. And you would not have been the only manufacturer that did so. So is this one of the reasons why China has been drinking America’s milkshake? By still making a good product? Some Chinese manufacturers still make shoddy products but maybe enough are discovering what the Japanese did after WW2 – that if you create a quality product, the world will beat a path to your door.
I don’t think I’d go so far as to say China is consistently manufacturing high quality products. Just went to the local coffee shop where one of the guys who works there displays his handmade guitars for sale. He was complaining about a low quality guitar pickup he used on one that came from China.
But I would imagine Chinese factories must manufacture goods for export to the US according to US specs. Walmart for example is the one telling them to make a stuff quick and cheap. I think you are correct that there is a burgeoning market for quality products since everyone can now see a few decades into this neoliberalism thing just how crapified everything has become.
From my experience with various products on Aliexpress, I think I have come to the conclusion that the Chinese make their products to their client’s exact specifications. If the dollar store wants some thing that will break after a few uses, you got it. If you want a high end phone, you can also get that.
Likely because China do not really enforce IP at this time.
If someone starts making big bucks with a product, a number of companies will come out with cheap “knock-offs” in short order.
And it will all be unbranded, making it hard to tell one from the other.
Ten years or so ago I met a small manufacturer of specialist ironmongery for the building trade who told me the Chinese were selling finished products in the UK cheaper than he could buy the steel never mind fabricate it.
How can this be? Four possibilities:
a) High VAT (Value Added Tax) and high payroll tax.
b) Monopoly/oligopoly in steel/materials supply chains.
c) Lack of capital investment/automation in supply chains.
d) Limited economies of scale.
Any others? It was only a brief meeting so I didn’t discover what he ascribed the problem to.
Back in the 90’s, used to be involved with manufacturing computer stuff. We tried to build in the states, but …. Our cpu (from Motorola) cost us $2.40 in California, and $1.50 in HK. For the same part, literally. It had our firmware burned into it, from the same Motorola factory. We specified a particular spec of GE ABS for the housing. In that case, the raw material cost differential was more than 2x. Every other part had similar cost differentials. The labor cost was inconsequential. Yes, the China labor rate was much much lower, but their labor could have been free and it wouldn’t have mattered – the labor component was much less than 5% of the BOM cost. It was the markups that mattered. (and that the markups compounded).
All the noise about competing with ‘cheap labor’ China is just making excuses. The real reason is the US cost structure had too many CEO bonuses (and debt servicing interest) padding the margins at every layer. All those sales dinners and rounds on the golf courses had to get paid for somehow.
When USSR collapsed the capitalists; had won. So they no longer needed to support the expensive made in american model,they no longer funded pensions, they moved production to location where sources of labor were cheap, no unions. The capitalists then became globalists and left you in the dirt. the capitalist aka the corporation has no allegiance to you or your community only to profit.
Prominent American economists recently belittled and dismissed Chinese accomplishments in shipbuilding, since the Chinese accomplishments were by state-owned rather than private companies:
https://news.cgtn.com/news/2024-01-15/China-ranks-top-in-global-shipbuilding-sector-for-14-years-1qnyiiAqUyQ/p.html
January 15, 2024
Robust growth in 2023: China maintains top position in global shipbuilding sector for 14 years
China witnessed strong expansion in output, new orders and orders on hand in the past year, with the three major indicators securing the top position in the global shipbuilding market for 14 consecutive years, according to data released by the Ministry of Industry and Information Technology (MIIT) on Monday.
China has also become the only country in the world to achieve comprehensive growth in the three indicators.
https://news.cgtn.com/news/2024-01-15/China-ranks-top-in-global-shipbuilding-sector-for-14-years-1qnyiiAqUyQ/img/9ea270ec3349439cad66909ec87e861b/9ea270ec3349439cad66909ec87e861b.png
In the past 12 months, China’s shipbuilding output reached 42.32 million deadweight tonnes (dwt), a year-on-year increase of 11.8 percent, accounting for 50.2 percent of the world’s total.
The new orders rose 56.4 percent year on year to 71.2 million dwt during the period, taking up 66.6 percent of the world’s total.
By the end of December, the volume of orders on hand was 139.39 million dwt, up 32 percent year on year, accounting for 55 percent of the world’s total.
In 2023, five Chinese shipbuilding enterprises ranked in the global top 10 in output, seven in top 10 for new order volume, and six for holding orders, said the MIIT.
‘Three pearls’ bagged …
Russia outproducing all of NATO and the EU plus Japan and South Korea in armaments really should have Made even the dumbest of fools realize how completely illusiory and hollow the whole idea of the supposed superiority of private, “free market” enterprise really is (at least outside some limited, mostly consumer goods related sectors).
The only people still not getting it are those paid to not get it.
Even the Neocons and the Pentagon increasingly do, with Sullivan starting to demand more state control, direct investment, coordination and planning while the military only manages to increase the output of shells by bypassing the contractors and building it’s own factories.
The free market only really work when you are dealing with simple, fungible, products where the customers have intimate knowledge of the product and the time to compare price and quality.
All in all, this is pretty much impossible outside of Adam Smith’s proverbial pin factory.
And we see this up and down economics as a “science” (and maybe also most of the other social sciences), where again and again some conceptual ideal replace the far messier real world.
https://news.cgtn.com/news/2024-01-15/China-ranks-top-in-global-shipbuilding-sector-for-14-years-1qnyiiAqUyQ/p.html
January 15, 2024
Robust growth in 2023: China maintains top position in global shipbuilding sector for 14 years
‘Three pearls’ bagged
China’s shipbuilding industry rounded off the past year after bagging the third “pearl in the crown.”
Large liquefied natural gas carriers, aircraft carriers and large cruise liners are known as the “three pearls” for their intricacy and complexity.
With the delivery of Adora Magic City, the country’s first independently built large cruise ship, China claimed all the “three pearls” in 2023.
The superliner just finished the inaugural commercial voyage earlier this month, taking more than 3,000 passengers to Japan’s Nagasaki and Fukuoka and South Korea’s Jeju Island during a seven-day, six-night trip.
It will expand the routes to include more options in the future, such as Southeast Asian and Belt and Road partner countries.
https://news.cgtn.com/news/2024-01-15/China-ranks-top-in-global-shipbuilding-sector-for-14-years-1qnyiiAqUyQ/img/0825b7eb20c64a6a8ba8a2e66436c707/0825b7eb20c64a6a8ba8a2e66436c707.jpeg
Building a large cruise ship is veritably giant engineering. Adora Magic City, for example, consists of more than 25 million components, five times that of the C919 aircraft and 13 times that of the Fuxing high-speed train.
The large amount of engineering materials, high technical difficulty and complex supply chain coordination make its design and construction extremely complicated, which has long been monopolized by a few European shipyards.
Chinese researchers had been devoted to making breakthroughs in key technologies concerning fields like weight control and gravity, vibration and noise, as well as navigation safety. It took eight years of scientific research and five years of design and construction before the ship was delivered in November 2023….
I am going to go to the practical consequences and what Janet and I are doing about it. We are committing serious resources to this perspective.
Let’s start with what our rival says. General Qiao Liang co-wrote ‘Unrestriced Warfare’ in 1999, which was China’s blueprint for what the US refers to as Full Spectrum Warfare. In 2015, he wrote ‘One Belt One Road‘:
> Americans believe that there will be no war between the two countries within the next ten years. After recent American studies on China’s military development, they believe the US’s existing capacity is not sufficient to offset some advantages the Chinese military has established, such as the ability to destroy space systems or attack aircraft carriers. The United States must then come up with ten years of development and a more advanced combat system to offset China’s advantages. This means that Americans may schedule a war for ten years later.
Well, next year is ten years later. So here we are.
The Unrestricted/Full Spectrum part of the conflict is that it’s a fight over the control of capital:
> Now the US claims it can hit any part of the world within 28 minutes, so no matter where capital is concentrated, it can hit anywhere in the world. As long as the United States does not want a particular place to have capital, a missile can get there in 28 minutes. And when the missile goes down, capital can be still quietly and nicely withdrawn.
So a missile strike becomes a capital strike.
The urban/rural split in the US correlates well with political Red/Blue. Recall Lambert’s comment:
> Interesting to think of Trumpism as a conservative reaction to a capital strike in small-town and rural America.
How can the rural areas of American respond to this capital strike? Qiao Liang:
> 3D printers also represent a future direction and will bring a fundamental changes in the mode of production in today’s society.
First, 3D printing can be widely distributed, not concentrated enough to make a missile strike worthwhile. In our more normal lives, they can be quickly responsive to a local need. A mother-in-law came from a family that once ran a foundry in Evansville, on the Ohio River. A ships part might break, they could bring the pieces to the foundry and they could cast a replacement in a day. The business is gone, and so is the responsiveness.
They can also spawn direct innovation of the sort Americans are theoretically good at. They can rapidly iterate a Palchinsky Principle loop, testing alternatives at low cost. Our two godsons work well together, an engineer and a grease-on-hands contractor. They have already made a modular hydroponic garden tower which has gone through several updates and is just beautiful.
A final point: these are not robots assembling thousands of parts, and that makes a difference in the social structure of the company. Randall Collins:
> 2. Mass production involves making many small, routine items and then assembling them (as in automobiles and other machiner) The resulting structure is pyramidal, with many unskilled and semiskilled workers, and a tall, narrowing hierarchy of managers who coordinate the various areas. Relationships are formal and bureaucratic, with many rules, reports, and much record-keeping paperwork; staff and line positions are clearly divided; and there is much conflict among both different sectors and different levels.
> 3. Process or continuous line production involves taking the same materials through a series of operations and mixtures (as in oil refining, chemicals, or food processing). Here, much of the unskilled labor and a great deal of the coordination is done by the organization of the machinery; the core of the organization consists of a few skilled workers who check the process and troubleshoot the difficulties… The hierarchy has few problems of coordinating production or dealing with reciprocal adjustments; hence, it can run in a fairly standardized bureaucratic fashion, but under low pressure and with a low level of conflict.
[Conflict Sociology, p.322]
“They can also spawn direct innovation of the sort Americans are theoretically good at….”
Those were “Americans” that had more curiosity than distractions.
But are those two statements factually related? We also spend more on so-called health care than any other country, but that doesn’t make us a health care superpower.
Our military is very good at killing civilians and random people who look like maybe they are irregular fighters, but when was the last time it had any success against a “near peer” military? Gulf War I? That was almost two generations ago. Even 15 years ago Winslow Wheeler had a book America’s Defense Meltdown criticizing the weapons systems that money is allocated toward, the procurement process, and the undue influence of political actors on how our military is directed. I would guess things are even worse today. And the recruitment problems of recent years are not helping matters. We may still be major military power, but not because of how much we (borrow and) spend, and how we would come off in a conventional war with either Russia or China is very much in question.
I’d imagine the difference in verbs was deliberate in the intro – the US spends more on military but China produces more manufactured goods – so I think you are on to something.
I will note that the authors do not use PPP, inflating US manufacturing, particularly if one considers the all-important contribution of military spending at over-inflated prices (and largely ineffective). I propose that much of the value added is due to inflation or monopoly price gouging (or a dysfunctional internal supply chain).
Example, I can get a trailer made in China at tractor supply (best price) for $3500. In 2019 it was $2100. I can get 10 trailers, delivered, on aliexpress for around $6000. So I assume in the value-added chart, we have $29000 of value added by the US by putting a license plate on it. And on a PPP basis, this value added gets me a lot less value in the US than a similar value added in China.
However, he supports well his main point that politicians pushing decoupling as easy are living on a parallel earth.
Since Obama’s “Pivot to Asia” but especially since Trump’s trade war with China, the US is importing less from China. However, with China being the manufacturing superpower that means moving away from the country that has the most efficient and cost effective production. That means higher costs for goods and inflationary pressure. Hmm, this is at a time when the US has $34 trillion in national debt and each 1% of interest means $340 billion to American taxpayers, about $1000 per citizen – just on the national debt. Maybe the US should find another strategy, other than belligerence, to deal with China.
The US military has thought since the 70s that any great power war would be over quickly. They even called it ‘come as you are’ warfare. The hubris behind that explains much about American military misadventures since. If the Chinese sink many US ships in a Taiwan conflict it will take min of 5 years to build new ones, especially carriers. And that’s if we can get all the electronics we need.
The greatest mistake the US made (after Iraq, maybe) of the last 30 years was giving CN PNTR and letting them into WTO. With near-zero tariffs on imports from CN, corporate US moved everything they could there. Lenin was right: the capitalists did sell the rope to be hung with.
Another accomplishment of the Clinton administration.
The dream that with material prosperity would come cries for neoliberal “democracy”.
Humans have again and again put up with dictators and like as long as they have been housed and fed.
really you can’t fix stupid. service was a spinoff of manufacturing. bill clinton and his country club GOP allies free traded away 200 years of america manufacturing wealth, skills, machinery, factories, unions etc., and gutted the new deal so that wall street parasites can make more quick bucks.
so lots of empty factories, gutted supply chains and gutted value added, lots of unemployment and poverty was the results, and the dim wits thought that cheap money and service would carry the economy.
we can never recover let alone reform, as long as free trade which is a billionaire minting machine remains in place.
getting rid of free trade is simply the first step, in a long long line of steps that need to be made.
https://truthout.org/articles/free-trade-and-unrestricted-capital-flow-how-billionaires-get-rich-and-destroy-the-rest-of-us/
Free Trade and Unrestricted Capital Flow: How Billionaires Get Rich and Destroy the Rest of Us
The bottom line is simple: A u201cfree tradeu201d system is a regime in which capital always wins, everywhere.
By
Gaius Publius ,
AmericaBlog
Published
March 27, 2013
“My point is about unrestricted free trade and capital flow in general and why understanding both is crucial to understanding:
There’s a straight line between “free-trade” — a prime tenet of both right-wing Milton Friedman thinking and left-wing Bill Clinton–Robert Rubin neoliberalism — and wealth inequality in America. In fact, if the billionaires didn’t have the one (a global free-trade regime) they couldn’t have the other (your money in their pocket). And the whole global “all your money are belong to us” process has only three moving parts. Read on to see them. Once you “get it,” you’ll get it for a long time.”
“At its heart, free trade doesn’t mean the ability to trade freely per se; that’s just a byproduct. It means the ability to invest freely without governmental constraint.”
“Free trade is a primary tool of wealth extraction.”
I thought this article would mention the other recent report on China,that it is the sole country to make *everything* in the world (where everything means every category and subcategory etc of some international standard classification of goods that was used in the study). Nobody else made everything.
Obviously, strategic autarky may be more achievable for Russia, who makes many things but not everything, than China, who imports her energy and food. But geopolitical bargaining for raw materials is a lot easier if you have at least one of every something everybody needs.
Interesting article. Funny how all the Western media headlines I have seen today pooh-pooh China’s “weak” growth of 5.2% last year. Surely, the West would thrilled to have this?
The long slow boil of the reserve currency curse?
Thanks for this, Yves. To drill down further to the level of key , fundamental products that are the “tangible” building blocks of a modern economy (e.g. electricity production, long considered a proxy for size of economy; steel, plastics, cement, ammonia- the four pillars as per Vaclav Smil and others, as well as autos, wheat, etc, etc), China is number one, by a huge margin in many cases. What may be even more interesting, and throws some light on the recent geo-political-economic developments – the BRICS getting energized and the Russian economic resilience – is who are the others in the top 5 in these categories after China. Steel: India, Japan, US, Russia; Cement: India, Vietnam, US, Turkey; Wheat: India, Russia, US, France; Electricity: US, India, Russia, Japan; Ammonia: Russia, US, India, Indonesia; Plastics: US, Germany, Saudi, Korea