Yves here. We have regularly criticized the Green New Deal and other initiatives to try to limit carbon emissions and thus climate change because they are based on the feel-good falsehood that the mere adoption of new tech will enable humans to keep modern lifestyles. The only very faint hope, which if more countries don’t embrace it, will be forced upon us via collapse, is radical conservation.
By Robert Rapier, a chemical engineer in the energy industry with 25 years of international engineering experience in the chemical, oil and gas, and renewable energy industries. Originally published at OilPrice
- Global carbon emissions reached a new all-time high in 2024, hitting 40.8 billion metric tons of CO2-equivalent emissions, despite significant growth in renewable energy and numerous international climate pledges.
- China, the U.S., and India are the three largest carbon emitters, collectively accounting for over half of global emissions, with the U.S. showing significant reductions since 2000 while China and India have seen substantial increases tied to economic development and continued fossil fuel reliance.
- The article concludes that while clean energy is expanding, it is not yet replacing fossil fuels at the scale needed to reduce total emissions, indicating that global demand growth or significant displacement of fossil fuels is necessary for emissions to decline.
In late June the Energy Institute (EI) released the 2025 Statistical Review of World Energy, which was published previously for more than 70 years by BP.
Here is the link to the full 2025 Statistical Review of World Energy.
The Review confirmed that a troubling trend continues. Despite historic investments in renewables and net-zero pledges from nearly every major economy, global carbon emissions hit a record high in 2024. This article is the first in a series breaking down the key findings—and what they mean for the global energy sector.
Defining Carbon Emissions: What’s Included and Why It Matters
The Review breaks down carbon emissions into several categories, but the most comprehensive metric is total carbon dioxide equivalents (CO2-equivalent emissions). This includes emissions from energy use, flaring, industrial processes, and methane associated with fossil fuel production, transportation, and distribution. As defined in the Review, CO2-equivalent emissions represent the sum of carbon dioxide from fossil fuels, flaring, and industrial processes—plus methane emissions converted into their carbon dioxide equivalent.
This approach provides a fuller picture of each country’s contribution to atmospheric carbon levels. While land use changes like deforestation are not included, the inclusion of methane—a far more potent greenhouse gas than CO2—makes this a more accurate measure of atmospheric impact.
Global Emissions Rise Again Despite Renewable Growth
Global carbon emissions hit a new all-time high in 2024, reaching 40.8 billion metric tons of CO2-equivalent emissions. That’s up from 40.3 billion metric tons in 2023—an increase of 0.5 billion tons from the previous year, despite record investments in renewables and aggressive net-zero pledges from countries and corporations alike. The growth trend has continued at a relatively consistent rate since 2021.
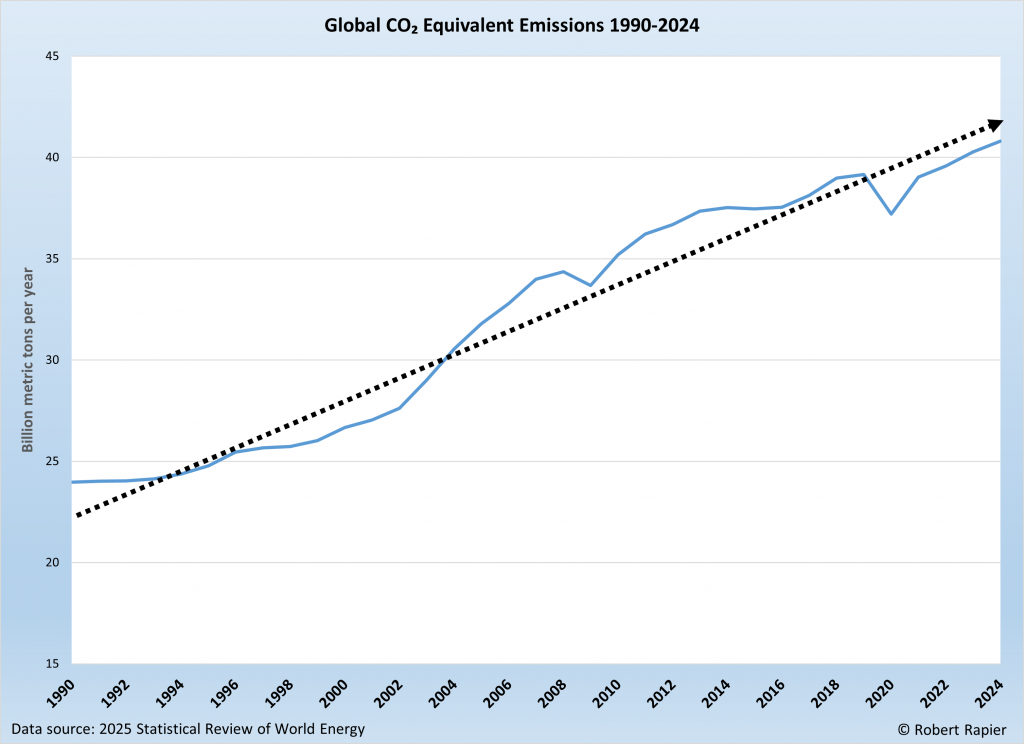
Over the past decade, global emissions have increased by nearly 1% per year on average, despite a growing list of international climate pledges. Although 2024 saw numerous headlines highlighting record growth in wind and solar—topics I’ll explore in upcoming articles—the emissions data tells a clear story: clean energy is expanding, but not fast enough to keep up with rising global energy demand.
Breaking Down the Big Three
The three largest carbon emitters in the world are China, the U.S., and India. Together, they account for over half of all global emissions. However, they have taken very different paths over the past few decades.
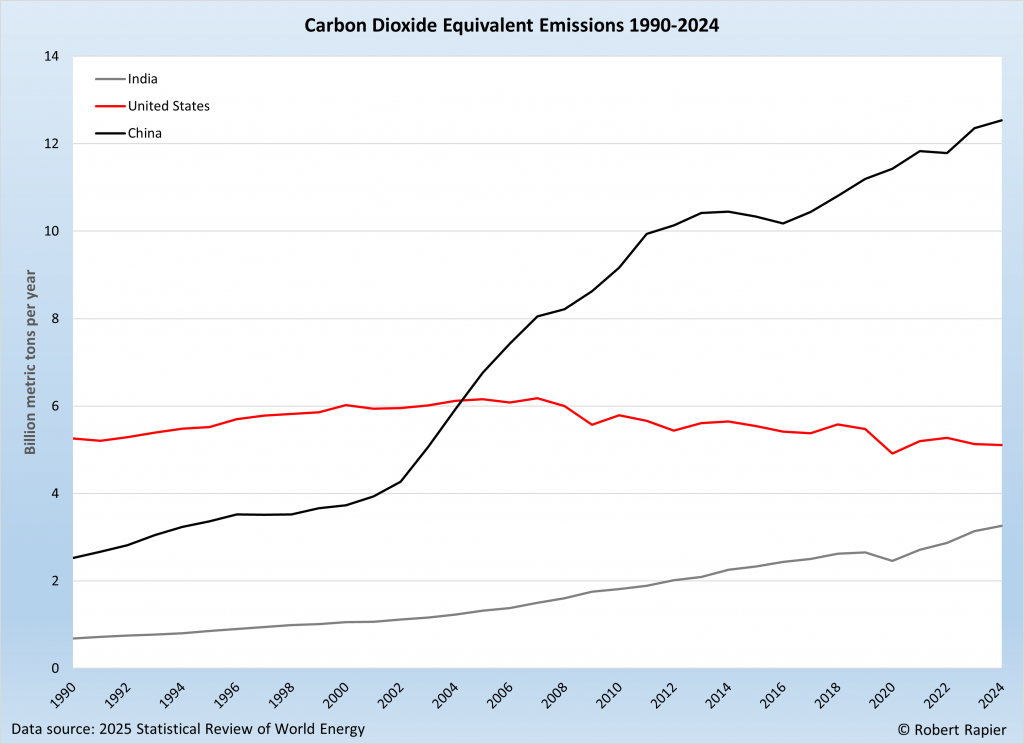
Despite a 37% increase in population over the period, U.S. carbon emissions in 2024 were lower than they were in 1990. Over the past decade, they’ve declined at an average annual rate of 1.0%. No country has reduced its carbon output more this century. Since 2000, U.S. emissions have fallen by 913 million metric tons—far surpassing second-place Germany, which saw a 292 million metric ton decline. While it’s true that the U.S. started from a higher emissions baseline, the scale of the reduction remains a significant achievement.
The most significant reduction in U.S. carbon emissions began around 2007, driven by two key shifts: the shale gas boom, which made natural gas cheaper and led utilities to switch away from coal; and the rapid growth of renewable energy, which chipped away further at coal’s dominance in the power sector.
In contrast, China’s carbon emissions have quintupled since 1990, rising by a staggering 8.8 billion metric tons since 2000 alone. In 2024, China emitted approximately 12.5 billion metric tons of CO2—nearly 31% of the global total—more than the combined emissions of North America and Europe.
Despite being the global leader in solar and wind deployment, China is also the world’s largest consumer of coal. That contradiction—leading the clean energy buildout while still relying heavily on fossil fuels—helps explain why global carbon emissions continue to rise, even as renewables grow at record rates.
India’s emissions have also quintupled since 1990, with an increase of 2.2 billion metric tons since 2000—second only to China in absolute growth. In 2024, India emitted 3.3 billion metric tons, up 24% over the past decade.
India’s rising emissions are closely tied to economic development. As millions move out of poverty and into the middle class, energy demand increases. Much of that demand is still met by fossil fuels. India’s situation reflects the biggest challenge of the global energy transition: how to decarbonize while still expanding access to affordable energy.
Global Disparities
A regional view of the data reveals deeper structural imbalances. Over the past decade:
- Africa saw emissions jump by 25%.
- The Middle East’s emissions rose by 15%.
- The Asia-Pacific region, which includes China and India, added over 9%.
- Even South and Central America, often overlooked in these discussions, recorded a 9.3% increase.
In addition to North America, Europe showed a clear decline in emissions, which fell an average of 1.4% per year over the decade. The European Union’s emissions fell to 3.7 billion metric tons in 2024, down 15% from a decade earlier. Countries like Germany and the UK continue to make strong progress through a combination of policy, electrification, and energy efficiency.
But that success is uneven. In Eastern and Southern Europe, emissions are flat or even rising, and economic pressures have delayed some planned coal phase-outs. While Europe is often heralded as a climate leader, its internal divisions show how difficult it is to maintain momentum across a diverse bloc of nations.
These trends reflect varying levels of policy ambition, but also where population and economic growth are occurring. Much of the world’s energy demand growth is from countries that are still building basic infrastructure, expanding transportation networks, increasing industrial output, and expanding the middle class.
Final Thoughts: More Clean Energy, But Not Enough Subtraction
The data suggest that the much-hyped energy transition is still happening too slowly to halt emissions growth. Wind and solar are scaling, but they’re not yet replacing fossil fuels at the level needed to reduce total emissions.
We’re adding clean energy to the mix, but we’re not yet subtracting fossil energy. That’s why global emissions continue to rise, even as headlines trumpet climate breakthroughs. Until global demand growth levels off—or renewables begin displacing fossil fuels at scale—emissions are likely to keep climbing.


Jevon’s Paradox. Increased efficiency in power production just leads to more power demand.
The USA carbon emissions will soon be back on the rise. Data centers for AI and the Cloud already consume nearly 5% of domestic electricity production according to a DOE study that was out the door just before the Trumper denialists took power. Goldman Sachs projects this data center demand to increase rapidly:
The USA has offshored much of its manufacturing to China, a significant part of the explanation for the small reductions in the USA’s national carbon footprint (unmentioned in the article), but these data centers can’t be offshored because of AI’s military applications. This growth in power consumption will stay here as the carbon emissions go into the atmosphere.
The billionaires are now siting these data centers near populations of poor, politically powerless communities so they can pollute their air while stealing their water and power resources. Musk’s huge data center outside Memphis is a good example. Data centers also consume huge amounts of water which they treat with chemicals that make re-use of this water for human purposes very expensive if not impossible.
As awareness of these impacts has spread, AI companies have made some attempts at mitigation. Microsoft is now using closed loop cooling systems that reduce water usage to a one-time hit, but that shifts resource consumption to the additional power needed to cool the water again and again rather than relying on the ambient temperature of underground water to provide the cooling. The massive power requirments can’t be met by renewables because they supply power intermittently while data centers must be powered fully at all times. So the billionaires’ answer are nuclear plants, and the Trump administration agrees.
We humans are going to be suffering more and more with brownouts and watering bans for the sake of the exponentially increasing water and power demands of these data centers. The only hope of ameliorating those effects is having a nice, hastily built and lightly regulated nuke plant in your neighborhood. And what are these data centers and their resident AIs going to be used for? Not the sales pitches of curing cancer and even the climate crisis (LOL, which they in fact are massively worsening). They’re going to be used to eliminate our jobs, increase the surveillance on us, and in any time left over, they’ll be used for nutty billionaire dreams of creating a silicon God, making the billionaires immortal and going to Mars.
Localities are trying to protect themselves with zoning laws and regulations, but we know how that goes because of the history of fracking. States pass law pre-empting local regulation, and eventually, feds do the same as almost happened with the Big, Beautiful Bill.
Options are limited for protecting ourselves from rolling blackouts, water shortages and nuclear meltdowns in this TechBro oligarchy.
Thank you. The Data Center (surveillance-control state) thing is why I suspect most of the Tech Bros switched sides. Well, that and taxes.
Agree with everything except where this all leads. And I only disagree with you on that point as before the tech bros can have their new alters built and trips to Mars, human civilization will have collapsed and most people will be dead.
Several climate tipping points have been reached and I feel serious environmental collapse is within several decades, not centuries, as studies have been woefully inadequate on mapping out worst case scenarios.
I have read that in some industrial processes, “waste heat” from one stage of the process (for example an exothermic reaction step in a chemical process) can be used in other stages (such as an endothermic reaction in a different step of the process) and that the $ value of the energy savings through re-use of process heat can be comparable to the net earnings generated by the entire process.
Is there no economic value to the heat output of data centers? Perhaps it is too costly to build the plumbing required to make this energy available. Imagining freely, one could imagine a data center providing hot-water heat to a nearby community during cool and cold weather. One could heat greenhouses in cold weather.
I’m sure I’m missing important things, but it seems to me a big waste to just dissipate waste heat by mixing it into the environment. Is there another solution to this pollution, aside from ‘dilution’?
It is just a hunch, but in data centres heat is generated throughout the premises by vast numbers of processors (whether CPU, GPU, or ASIC) and storage devices (flash memories, hard disks, tape drives) and is therefore diffuse and hard to reuse (one would have to configure the entire building to somehow capture, conduct, and concentrate that heat somewhere).
In industrial processes, heat is generated in a concentrated manner, on specific work stations, so that it is easier to set up devices to recuperate waste heat and lead it somewhere else to be reused by other operations.
I heat my house with the “waste heat” from a Bitcoin miner. It consumes 3300 watts, and that makes enough heat for most winter days.
This is obviously a micro data center.
The key is that the data center needs to be integrated into the basement or first floor of a commercial building so that the heat rises. And of course, you’d want to shut off the data center in the summer, which probably isn’t very palatable. (Or vent it outside.)
This basically excludes most opportunities to reuse the heat generated by data centres.
For a number of reasons (security, energy supply, zoning plans), data centres are standalone buildings with no mixed usages, no floors above them. This means no heating household or office spaces. For the same reasons and additional technical ones, this also means no reuse of generated heat for different industrial usages.
Old-fashioned corporate computing rooms where located on premises and there generated heat could serve to heat offices (a situation similar to the one you describe). When computing takes place in the cloud, then all that generated heat is just dissipated far away, in massive, specialized, isolated buildings.
I would caution overusing the Jevons Paradox – it only applies in fairly restrictive circumstances. It assumes that energy efficiencies lead to growth in consumption, but makes no predictions for when the source of energy is changed (i.e. from fossil fuels to other sources). It only generates additional production if that process saves money, which we are told constantly that it doesn’t (in many cases it does, but thats a different story). In any event, the Jevons Paradox is clearly breaking down in many economies, including the largest ones. The reasons are complex, but the key ones are clear to see, especially where renewables are making major inroads. In Ireland, for example, CO2 emissions are reducing despite high levels of economic growth, high population growth, and an extremely large data centre industry. . All other things being equal, replacing fossil fuel energy with renewable energy does reduce emissions, and the Jevons paradox does not change this unless the process actually creates economic growth.
I’d also caution about a fixation on data centres. All available evidence suggests that this is a short term thing, with only minor implications for overall global energy use (it will probably peak at around 5% of global energy demand). It is still, and always will be, dwarfed by the traditional big emitters – agriculture, transport, space and water heating. The impacts of data centers on grids and demand are localised and regional, not global.
“it will probably peak at around 5% of global energy demand”
My point was not about global demand but instead about the assertion that USA power demand would continue to slowly decline. According to that recent DOE report, data center demand for power is expected to increase its share of total power demand:
The one way of stopping the operation of Jevon’s Paradox is to shut down an existing fossil fuel power plant before new renewable power sources are brought on line. Of course, the squawk that would arise would be deafening.
Data centre demand has certainly had a very negative impact, although I’d argue its more that the unexpected speed and intensity of the demand has made life very difficult for grid managers, hence the need for a rapid roll out of gas peaking plant (with associated diesel back-up). But I do believe that it is essentially a ‘blip’ in overall trends, which is for fossil fuel use to be displaced rapidly (albeit largely too late and not fast enough). Unfortunately, thanks to Trump (especially his tariffs), Ukraine, and Israel, there are so many interruptions to normal trends it’s hard to really assess the speed and direction of the energy supply system.
My overall point is that it’s important for energy/CO2 watchers to keep an eye on the big picture and not get too tied up in the noise.
I suspect that if you included oil and gas exports as emissions, the US would look rather different.
Well, at least its nice to see an article related to Climate Change, a topic that more or less has disappeared from the MSM. We are more and more like those mythical lemmings, heading over the cliff. Our relentless exploitation of resources so we can consume until nothing is left will be our sad legacy, that is if there will be anyone around to read about it.
And to think the solution is fairly simple. We all experienced it during the initial phases of the pandemic. That glorious few months when most people stayed home, most cars stayed in their driveways, only necessary travel, only necessary or critical businesses such as grocery stores remained open. Are we moving to a world where the climate itself will force this on us? Only this time there won’t be outdoors walking and exercising and such?
The permafrost melts, the methane escapes.
This process is occurring over a trillion hectares in the far north, across three continents.
No human efforts can prevent this, afaik.
Um, according to the CIA World Factbook, the surface area of the earth, excluding sea, is around 148.9 million km^2, which is around 14.89 billion ha. And given that the far north isn’t going to equate to even 10% of that, you’re only off by a factor of around 500 or more.
This illustrates the fallacy of focusing on national emissions (and policies) for a global problem. The fact that the atmospheric CO2 trend shows steady, unchanging growth from 1992 to 2024, i.e., humanity is no better today (on this topic) than in the 1990s, despite decades and decades and decades of talk and green energy and more talk.
How to explain? Well, first off, one should look at per capita emissions–disadvantage West–which is far more explanatory as to why overall emissions are rising (Who is the West to say only it can benefit from high per capita oil consumption (~50 bbl/yr US). The Global majority (87%) will approach Western usage rates. Macron tried that in France and got the yellow vests and backed off. Trump tapped the same zeitgeist – high elite energy utilization; austerity for the masses is unsustainable.
Secondly, supply chains are global, so it is unsurprising that rather than actually reducing emissions, the West exported its emissions— good virtue signaling, bad environmental policy. This also explains why, per the intro, hard collapse is the most likely projection of how emissions (and energy usage) will reduce.
Absent a massive, subsidized, and very low-cost transfer of green technologies to the global south (which the West has shown zero interest in enabling, another reason China is winning), the CO2 trend will continue. And this is all outside the long-term damage the Trump administration is hell-bent on implementing to slow and derail the energy transition.
The increase in wildfires will lead to increase CO2 emissions as well. For instance Canada signed to all those climate protocols only after wildfire emissions were cleaned off of its slate…
The agreement applies only to regulatable emissions—geological emissions, wildfires, wetlands, forests, svannahs, estuaries, and other natural emissions are not regulated and not addressed in agreements (they can’t be otherwise you get perverse incentive to cut down the forests as (thankfully ineptly) under Reagan that leads to ecological collapse).
rant
Correct me if I am wrong, but the USA and Europe have reduced emissions by offshoring much of their energy intensive manufacturing to China, India and other countries in Asia and the Global South. It is no surprise that China is the biggest emitter when it produces just about everything we use. The USA needs just enough energy to keep those banks and stonk market computers going.
/rant
Article leaves out the elephant in the room- The reason China’s emissions ballooned was because the emissions from USA & Europe were exported to China. A large proportion of China’s emissions should be assigned to Europe & the settler states.
Meanwhile
annual solar panel production growing at over 33%
https://www.solarpowereurope.org/press-releases/new-report-world-installed-600-gw-of-solar-in-2024-could-be-installing-1-tw-per-year-by-2030
here it is showing total installed capacity
https://www.solarinsure.com/how-much-solar-energy-does-the-world-generate#:~:text=From%202013%20to%202024%2C%20the,total%20soared%20to%202%2C074%20GW.
renewables power 40% of the worlds electricity in 2024
https://www.bbc.com/news/articles/cq80ygdd3zlo
The growth rate at 33%+ means a doubling in slightly more than 2 years. solar panel prices are continuing to drop, battery prices are dropping quickly and lifespans are increasing
to many china observers in early 2025 it is forecasted to have hit peak coal and oil will drop as supassed 1 TW of solar installations let alone wind. They have 30 x 1+ GW reactors under construction and plans for 150-200 by 2035.
Finally about 96% of all new electrical power in the US in 2024 was renewable and nuclear.
https://www.canarymedia.com/articles/clean-energy/chart-nearly-all-new-us-power-plants-built-in-2024-will-be-clean-energy
Studiously avoids showing what a fly speck all this is of total CO2. I guess it plays to the sense of drama needed by the climate faithful.
There is a huge difference in the carbon cycle between stocks and flows, and relative impact of small increases in volumes re flows.
CO2 has almost doubled from pre-industrial times (280 ppm) in the atmosphere to the modern day (420 ppm). Very simple – not negligible integrated over century times (the CO2 half life).