This post comes from a Frank de Libero, reader at Angry Bear. By way of background, not only are some of the main writers at Angry Bear pretty serious statisticians, but they attract them as readers, and Libero appears to be one.
Libero does a quick and dirty analysis of employment versus various ways to estimate the labor pool to ascertain what the labor participation rate has been and how it has changed over the long term. It’s not news that this recovery has been the weakest on record in terms of the proportion of GDP growth going to labor; what is striking is that Libero quantifies how this recovery compares to the distribution of previous outcomes (measured as “jobs recovery,” or the point when employment returns to pre-recession levels. This one is 19 standard deviations out. I have never seen a value like that. And remember that the 2000-2001 recession wasn’t as deep (in terms of GDP decline) as either 1980-1981 or 1990-1991.
His quick calculations come up with a range of 5 to 12.3 million people absent from the work force (he settles on 10 million because another group using a different methodology came to that estimate) and some charts that show that the gap, however you determine it, is larger than in the past.
From Angry Bear:
In spite of repeated assertions by the administration, media and related that the jobs situation is strong, empirically the big picture is not confirmatory. The following uses working-age population trends to show there is currently between a 5 million and 12.3 million jobs shortfall.
….[M]y posts are not meant to be partisan. They are in opposition to deception, untruths, disinformation and propaganda, regardless of the source. My goal is to help promote clarity through numbers.
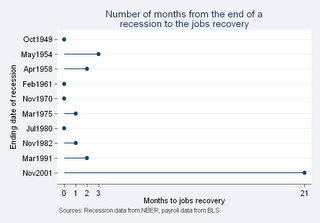
Others have also argued that there is a significant jobs deficit (e.g., CBPP referenced below). These are demonstrated by comparing job growth or time to job recovery in past business cycles with the 2001 recession. The following chart shows the 2001 recession’s unusually long lag till the jobs recovery.
Monthly BLS payroll data goes back to January 1948. From then till now, there have been 10 recessions. The average time between the end of a recession and the jobs recovery for the first nine business cycles is one month, with a standard deviation of 1.12 months. The 2001 recession is almost 19 standard deviations away from that average. Unless there had been hugely dramatic job growth after its 21 month lag, we would not expect the present jobs situation to be salutary.We can use the JPT (see previous post) to evaluate post-recovery job creation. The last jobs recession ended August 2003. The mean JPT since August 2003 is one, which is also the long-term average JPT. Thus job growth since recovery has not been dramatic at all, just average. Given this evidence, a jobs shortfall is expected. The question then is what is its magnitude?
From 1948 to the present we have had wars, recessions, major technological changes, increased immigration, more women and fewer men in the work force, social disruptions, increased foreign competition, deregulation, declining union membership, a shift from manufacturing to service industries, increased levels of education, and globalization. Through all of that and whatever was missed, the working age population correlates strongly (r>0.99) with non-farm civilian job growth. It is most likely the major driver of job growth. Taking advantage of available data and this tight relationship, we estimate the range of jobs lost relative to the nation’s potential for job creation.
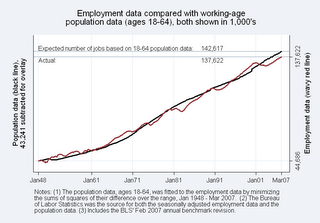
To estimate the low end of the shortfall, we fit the entire monthly population data, ages 18-64, to the payroll data, from January 1948 through March 2007, and then look at the end-point difference. One reason this estimate is low is because not everybody stops work at age 65. Another is we have fitted all the data, including the extended downturn which is the focus of this post. From the following chart we see the shortfall is at least 5 million jobs.
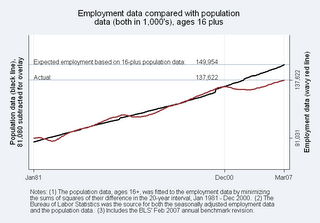
To estimate a cap on the jobs shortfall, working-age is redefined as all ages from 16-years old and up. This is what the Bureau of Labor Statistics (BLS) often refers to as working age. This alternate population trend is fitted to the 20-year employment interval, January 1981 – December 2000. As the next chart shows, the two trend lines track very closely in that interval.
Following the population trend beyond the 20-year interval to March 2007, gives a jobs shortfall of 12.3 million, which is viewed as an upper estimate. Thus the range for the current shortfall is between 5 and 12.3 million jobs.As confirmation and a comparison, the Center for Budget and Policy Priorities (CBPP) using different methodology estimated the shortfall at 10 million jobs. That is within the 5 to 12.3 million range above.
Current job levels fall short of historical employment-population trends. And that gap has consequences. Rounding numbers for easy top-of-the-head calculations, assume a 10 million jobs shortfall. For perspective, that is more than 5% of the ages 18-64 population. Further, assume average individual annual income to be $30,000. Totaled, that is a $300 billion potential loss to the economy. If the average effective federal tax rate is 10%, then that is a $30 billion loss in annual tax revenue. This does not take into account Social Security contributions, state and local tax revenues, multiplier effects, or the long-term consequences of changes to the dependency ratio, the ratio of non-workers to workers. Nor does it take into account the kinds of jobs created or the impact on 10 million people’s lives.