Yves here. Notice how Arthur Berman links overproduction of expensive oil and shale gas to access to cheap financing. In other words, the shale gas boom and bust in in large measure a by-product of ZIRP and QE.
By Arthur Berman, a petroleum geologist with 36 years of oil and gas industry experience. He is an expert on U.S. shale plays and is currently consulting for several E&P companies and capital groups in the energy sector. Berman is an associate editor of the American Association of Petroleum Geologists Bulletin, and was a managing editor and frequent contributor to theoildrum.com. He is a Director of the Association for the Study of Peak Oil, and has served on the boards of directors of The Houston Geological Society and The Society of Independent Professional Earth Scientists. Originally published at OilPrice
The present oil price collapse is because of over-production of expensive tight oil. The collapse occurred because of the inability of the world market to support the cost of the new expensive oil supply from shale, oil sands and deep water. Demand was progressively destroyed during the longest period of sustained high oil prices in history from 2010 through 2014.
Since the early 2000s, the price of oil was largely insensitive to the fundamentals of supply and demand as long as prices were less than about $90 per barrel. The chart below shows world liquids supply minus demand (relative supply surplus or deficit), and WTI oil price.
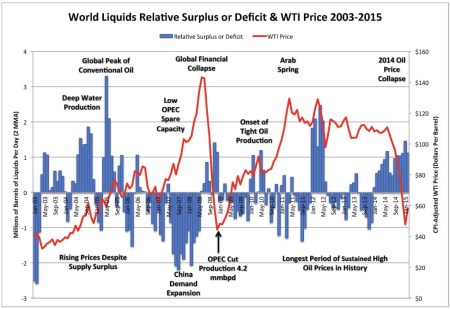
Figure 1. World liquids relative surplus or deficit (production minus consumption) and WTI crude oil price adjusted using the consumer price index (CPI) to real February 2015 U.S. dollars, 2003-2015. Source: EIA, U.S. Bureau of Labor Statistics, and Labyrinth Consulting Services, Inc.
(click to enlarge image)
In mid-2004 and mid-2005, the relative supply surplus was much greater than it has been during the 2014-2015 price collapse yet prices continued to rise. When oil traders perceive supply limits and rising prices, price below some critical threshold is not an issue. They are willing to carry the cost of storage and interest to hold the commodity in the future when it will be more valuable.
In 2004, the relative supply surplus reached 1.9 million barrels per day and in 2005, it reached 4.1 million barrels per day. By contrast, the greatest supply surplus in the current oil price collapse was 1.7 million barrels per day in January 2015.
During periods of supply surplus in 2004 and 2005, prices were less than $75 per barrel. The average WTI oil price between November 2010 and October 2014 was $91 and for 18 months of that period, prices were more than $100 per barrel.
Oil prices have collapsed three times because of demand destruction: in 1979, 2008 and 2014. In all of these cases, oil prices exceeded $90 per barrel in real 2015 dollars for extended periods. The chart below shows WTI oil price* from 1970 to the present with periods when price exceeded $90 per barrel highlighted in red.
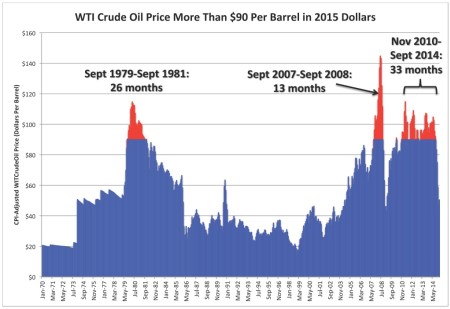
Figure 2. WTI crude oil price adjusted using the consumer price index (CPI) to real February 2015 U.S. dollars. Areas in red represent periods when oil prices exceeded $90 per barrel. Source: U.S. Bureau of Labor Statistics, EIA and Labyrinth Consulting Services, Inc.
(click to enlarge image)
Oil prices were more than $90 in 1979-1981 for 26 months; in 2008-2009, for 13 months; and in 2010-2014, for 33 months. 2010-2014 was the longest period of oil prices above $90 in history. There were other factors at work in all three of these high oil-price episodes and their subsequent periods of price collapse.
In 1979, the trigger for oil-price increase was the Iranian Revolution and the Iran-Iraq war. More than 6 million barrels of oil were removed from world supply. Oil prices rose from $50 to $115 per barrel (in real 2015 dollars) between January 1979 and April 1981. Then, new production from the North Sea, Mexico, Alaska and Siberia flooded the market. By March 1986, prices had fallen to $27 per barrel. OPEC cut production by 14 million barrels per day but oil price was unaffected because of a combination of demand destruction, crippling interest rates, and new supply from non-OPEC countries. Prices did not begin to recover until 2001.
So far, the current oil-price collapse is nothing like this. Surplus production is about 1.0 to 1.5 million barrels per day, interest rates are near zero, and demand recovery appears strong from early data.
The oil-price collapse and Financial Crisis of 2008 were preceded by 11 consecutive months of relative supply deficit and price increase (Figure 1 above). This was largely because of a surge of consumption by China and low OPEC spare capacity. Oil prices approached $150 per barrel in June 2008, the highest price ever reached, and then collapsed below $40 by February 2009.
The record price of oil was an underlying cause of The Financial Crisis. It increased the cost of global trade, produced inflation and higher interest rates that contributed to real estate loan defaults, and caused demand destruction for oil and other commodities.
Weak demand for all commodities and loans remains a chronic artifact of the years since 2008 despite the best efforts of central banks to correct the problem.
Oil prices rebounded fairly quickly after 2008 because of a 4.2 million barrel per day production cut by OPEC in January 2009 (Figure 1). Another reason for increasing oil price was the devaluation of the U.S. dollar by the Federal Reserve Board by lowering interest rates and increasing the money supply. The chart below shows Federal Funds interest rates and the price of oil.
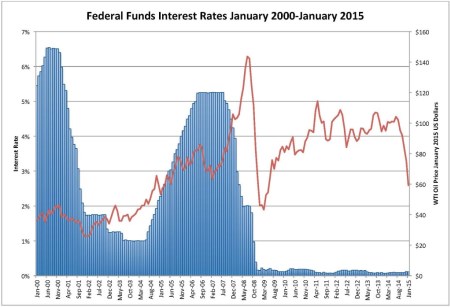
Figure 3. Federal funds interest rates and WTI oil price in 2015 dollars, January 2000 – January 2015. Source: Board of Governors of the Federal Reserve System, EIA, U.S. Bureau of Labor Statistics and Labyrinth Consulting Services, Inc.
(click to enlarge image)
Oil prices rose with a weak U.S. dollar and interest rates near zero in 2009. Other factors, notably the Arab Spring uprisings in the Middle East, also contributed to the price increase.
As prices passed $80 per barrel in late 2009, tight oil production began in earnest. Low interest rates forced investors to look for yields better than they could find in U.S. Treasury bonds or conventional savings instruments. Money flowed to U.S. E&P companies through high-yield corporate (“junk”) bonds, loans, joint ventures and share offerings. Although risk was a concern, these were investments in the United States that were theoretically backed by hard assets of oil and gas in the ground.
In the first half of 2012, flagging demand caused a relative supply surplus of 3.5 million barrels per day (Figure 1 above). WTI oil prices dropped below $90 but by early 2013, prices returned to the high $90-to-low-$100 per barrel range.
Tight oil boomed after late 2011 when oil prices moved higher than $90. An endless flow of easy money was available to fund spending that always exceeded cash flow. The table below shows full-year 2014 earnings data for representative tight oil E&P companies.
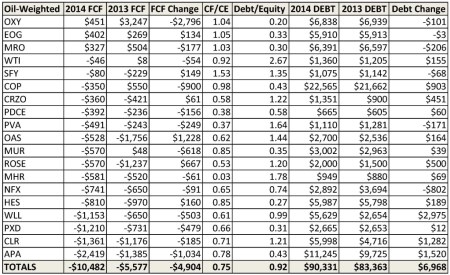
Table 1. Full-year 2014 earnings data for representative tight oil exploration and production companies. Dollar amounts in millions of U.S. dollars. FCF=free cash flow; CF=cash flow; CE=capital expenditures. Source: 2014 10-K filings, Google Finance and Labyrinth Consulting Services, Inc.
(click to enlarge image)
These companies out-spent cash flow by 25%, spending $1.25 for every $1.00 earned from operations. Only 3 companies–OXY, EOG and Marathon–had positive free cash flow. Total debt increased from $83.4 to $90.3 billion from 2013 to 2014. Debt must be continually re-financed on increasingly poorer terms because it can never be repaid from cash flow by many of these companies.
The U.S. E&P business has, in effect, become financialized: investment in this class of company has become the sub-prime derivative of the post-Financial Crisis period. There is no performance requirement by investors other than the implicit need to maintain net asset values above debt covenant trigger thresholds.
These terrible financial results reflect a year when average WTI oil prices were more than $93 per barrel. First quarter 2015 earnings will make these results look good.
The immediate cause of the present oil price collapse is found in increasing production and, to a less obvious extent, decreasing demand that began in January 2014 as shown in the chart below. Markets react slowly and it was not until June 2014 that prices began to fall.

Figure 4. World liquids supply and demand, July 2013-February 2015: Source: EIA and Labyrinth Consulting Services, Inc.
(click to enlarge image)
This was the manifestation of longer-term demand destruction following nearly 3 years of oil prices above $90. The chart below shows the same world liquids data as in Figure 1 but with demand (consumption) expressed as a percentage of supply (production).
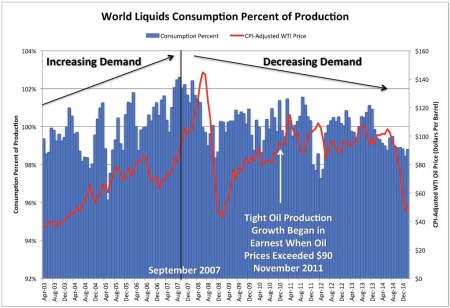
Figure 5. World liquids demand (consumption) as a percent of supply (production) and WTI crude oil price adjusted using the consumer price index (CPI) to real February 2015 U.S. dollars, 2003-2015. Source: EIA, U.S. Bureau of Labor Statistics, and Labyrinth Consulting Services, Inc.
(click to enlarge image)
Figure 5 shows that demand as a percent of supply was generally increasing until about September 2007 and has been generally decreasing since then. Especially weak demand since early 2014 is merely the most extreme expression of a trend that has been active for more than 7 years.
The present oil-price collapse is, therefore, because of long-term high oil-price fatigue. It reached a crescendo in mid-2008 when oil prices exceeded $140 per barrel but was not specifically recognized as more than another of the factors that contributed to the Financial Collapse that followed. It is now clear that oil price was a central cause of that collapse.
The artificial low interest rates that have been imposed by central banks since the Collapse have weakened the U.S. dollar and pushed the price of oil above $90 per barrel for the longest period in history.
The quest for yields in a low interest rate world led investment banks to direct capital to U.S. E&P companies. Capital flowed in unprecedented volumes with no performance expectation other than payment of the coupon attached to that investment. Tight oil boomed despite poor financial performance.
The current oil-price collapse is because of expensive tight and other unconventional oil and the market’s inability to support its cost. $90 per barrel WTI price appears to be the empirical threshold for demand destruction. Only the best parts of core areas of the Bakken and Eagle Ford shale plays make some profit at $90 per barrel and almost nothing makes money at present oil prices.
Low price will eventually cure weak demand. At the same time, the effect of reduced oil and gas spending on the U.S. economy is unclear but a weaker economy could lower demand despite low prices. Allen Brooks and Euan Mearns have explained the case for demand destruction in excellent detail.
The present oil-price collapse is severe because of the accumulated, long-term price fatigue that has existed since late 2007. Although the immediate cause of the collapse is over-production of tight oil, the key to recovery is demand.
Demand is more difficult to cure than over-supply so that is where efforts must be directed. Over-production of non-commercial tight oil must slow and eventually stop before the market can balance itself. I am more optimistic than most that this is already underway but it distresses me to see increased capital flow thus far in 2015 to what Christopher Helman aptly calls “zombie” companies.
The problem is structural and systemic and firmly rooted in the irresponsible funding of under-performing U.S. tight oil companies since at least 2010. The first step to price recovery is the severing of capital supply to companies that could not fund their operations from cash flow when oil prices were more than $90 per barrel. If this does not happen, we could be in for a long period of low oil prices.
*The Brent crude oil pricing system did not exist before 1987.


i hold stoneleigh in the highest regard because of analysis like this: (published in 2010, answering a reader’s questions)
as late as q2/2014, people would have ridiculed her. since, we’re not at $20/barrel, but it’s certainly possible, given the 5/2015 land-based storage fill-up and the need for the shale operations to keep pumping. the swiss currency peg cut, the dollar’s strength, she made the call and backed it up.
I have read the whole pointed article it and it is really prescient about the process of demand destruction and how after the damage is done even big falls in price will not make demand recover. Thanks for the link.
The peak oilists’ thesis is wearing thin: US oil and oil product production record. We’re getting awfully close to seeing their covenant with Huebert expelled from energy discussions.
Zombie oil for zombie banks in a zombie economy.
Berman’s post is excellent. The comment you replied looks intended to lower the discussion to below ground level. Your answer is brief but points to another point of discussion: how the fracking investment frenzy will unfold. This is addressed in Euan Mearns link and adds to the uncertainty in economic and energy future.
We will need to become zombies too – because the banks will have invested our pensions in shale oil riiight about at the top, when their cronies are dumping, so we cannot afford to retire or even die of old age.
In the South of Europe around one quarter of the population are already economic zombies: unemployed with no perspectives of ever getting a job. But most of us refuse to follow the second law of neoliberal thinking, and “go die” ;)
In the positive side, Energy Intensity of Mediterranean countries like Spain and Greece, but also France or Italy is getting way better in a context of diminishing GDP (according to Eurostat). Spike in Greece was probably due to meltdown in 2012.
Did you actually read the article? One of the author’s main points is that the dramatic increase in production is largely an artifact of cheap money. Dancing on the grave of Mr. Hubbert might be a little premature.
‘Demand is more difficult to cure than over-supply so that is where efforts must be directed.’
First central planning created oversupply through ‘financialization.’ Now demand has to be ‘cured,’ which is what QE and ZIRP (whether effective or not) were intended to do.
Who is going to do this ‘severing of capital supply to companies,’ which metaphorically suggests corporate head chopping? Evidently, the mistakes of central planning are to be combated with yet more central planning.
I hear that a retired central planner, Alan Greenspan, is available for consulting gigs. When it comes to forecasting energy demand and prices, he’s a legend in his own mind.
“Who is going to do this ‘severing of capital supply to companies..”
I imagine it happens as their short and medium term bonds come due and they need to enter the bond market to re-fi. I would hope the investment world has not gotten so crazy in their search for a little yield that they overlook the fact that many of these companies bleed $40 of red ink for every barrel they pump. ‘Course they will likely need to enter the bond market before rolling over existing debt – if they aren’t even generating enough revenue to cover cash operating expense.
i had also picked that sentence out because it looks very counterintuitive. if something is more difficult, isn’t it better to do the thing that’s easier? but i take it to mean that supply will sort itself out while demand will need a hand.
Don Lancaster is an old-school electronics buff who wrote “The Incredible Secret Money Machine.” His amortization analyses debunking the financial viability of solar photovoltaics are excellent. For anyone interested, there is this pdf from 2008:
.tinaja.com/glib/pvlect2.pdf
Amend with this note from last December:
“Meanwhile, the November pv pricing figures are in and approach
45 cents per peak panel watt, If the present price drops continue,
hitting the magic 25 cents per peak panel watt required for net
energy renewability and sustainability could happen in as little
as eight months.”
Coming from him, that is a very optimistic comment.
So, from my rudimentary understanding: the financial sector is throwing lots of junk bonds around Shale markets; this hot money is causing an oversupply which is bringing down the price of oil. But if the price of oil is cheap, what’s the problem?
Interesting theory. Here’s an alternate one.
(1) OPEC essentially sets the world price for oil when it meets with OPEC and agrees on quotas.
(2) Oil producers are essentially price takers. If the world price of oil exceeds the cost to produce this oil, as estimated over the life of an given oil well, then producers will make a decision to drill that well.
(3) The real world price for oil should probably have been something around $85 a barrel for the past five years. The fact that it was actually something closer to $100, suggests that oil producers with marginal costs that could make their money back, along with a reasonable return, at $100 a barrel oil, were able to find capital to drill those wells.
(4) As the US added a few million barrels a day of production through its oil shale operations (out of an estimated 90 million barrels of oil a day of crude oil liquids), OPEC once again had the option of simply cutting back on its quota and keeping prices at this level. Instead, this time, they chose to keep their level of production (to include the quotas) in place.
(5) OPEC, as a cartel and mostly led by the Saudis in this matter, are suddenly willing to allow the crude oil market to crater to hurt other producers. They are willing to accept a large loss, as compared to what they have been making in recent years, in order to eliminate competitors and make the capital providers for their competitors think twice. They are achieving this by basically not undertaking their normal price setting behavior (which would be illegal in the US, unless it was done by someone like the Texas Railroad Commission). Once these competitors are eliminated, anticipate that OPEC will re-set the world price for oil back in the $85 a barrel range for now, but don’t be surprised to see world prices jump above $100 for some temporary period.
(6) Some portion of these shale plays are not economic above $85 a barrel; those companies that are overly invested in those marginal plays are in trouble. However, despite your persistent claims to the contrary, much of the US shale business is economic at $85 a barrel or less.
(7) The annual decline rate for global production is something close to 5 million barrels a year. This is the amount of new oil production that must come on line each year in order to allow the amount of oil being produced to remain constant from year to year.
(8) Given recent prices, the amount of capital being reinvested in oil drilling operations, is probably less than half of what it was last year. This means that the few million barrels of oil being produced from our oil shale operations a year has already been absorbed into the world oil system as part of that replacement oil for this year’s oil production decline.
(9) These current low oil prices will not likely last for long unless OPEC really throws in the kitchen sink and increases their quotas and digs into their excess production capacity in an attempt to flood the market. The EIA country report for Iraq suggests that they could possibly come up with another 6 million a day of production. Even so, that capacity could be absorbed in a couple years of annual decline.
(10) You don’t need to assume industry malfeasance to explain what has happened. The facts seem sufficiently explanatory.
“Low price will eventually cure weak demand”
I thought that from a climate change / environmental point of view, demand destruction is a good thing? Here’s hoping for successful fossil fuel divestment campaigns and continued “suffering” of the U.S. shale industry.