By Gianni La Cava, Senior Research Manager in the Economic Research Department of the Reserve Bank of Australia in Sydney. Originally published at VoxEU.
A key observation in Thomas Piketty’s Capital in the Twenty-First Century (Piketty 2014) is that the share of aggregate income accruing to capital in the US has been rising steadily in recent decades (Figure 1). The growing disparity between the income going to wage earners and capital owners has led to calls for government intervention. But for such interventions to be effective, it is important to ask who the capital owners are.
Figure 1. Net Capital Income, US (Share of Net Domestic Income)
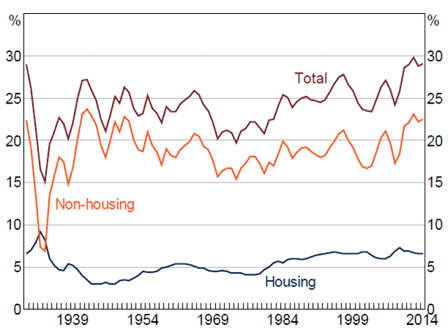
Notes: Net capital income is equal to net operating surplus, or gross operating surplus less depreciation; net domestic income is equal to gross domestic product less total depreciation
Sources: Author’s calculations; Bureau of Economic Analysis; Piketty and Zucman (2014)
Recent research has shown that the long-run rise in the net capital income share is mainly due to the housing sector (e.g. Rognlie 2015, Torrini 2016 – see Figure 1). This phenomenon is not specific to the US but has been evident in almost every advanced economy. This suggests that it is not entrepreneurs and venture capitalists that are taking an increasing share of the economy, but land owners.
So are we seeing the rise of a new `landed gentry’?1 And, if we are, what might explain it? Several research papers (e.g. Bonnet et al. 2014, Rognlie 2015, Weil 2015), print articles (e.g. Economist 2015) and blogs (e.g. Smith 2015) have hypothesised that the long-run increase in the housing income share is due to factors such as lower interest rates, higher mortgage debt, and constraints on home building, due to either geographic constraints or land zoning restrictions. But there is comparatively scarce empirical evidence to confirm these hypotheses.
In a new paper, I examine the determinants of the rise in the US housing capital income share over recent decades (La Cava 2016). I build upon the foundations set by Piketty and Zucman (2014), but rather than focusing on trends at the national level, I dig deeper and decompose the US national accounts data by different types of housing (e.g. owner-occupied and tenant-occupied) and, even more importantly, by US state. To the best of my knowledge, my paper is the first to explore the determinants of the secular rise in the housing share of the economy by exploiting both cross-sectional and time-series variation in factors such as housing prices, interest rates and housing supply constraints.
In the US national accounts, income accruing to the housing sector is measured as ‘net housing capital income’, or simply, net rental income (i.e. gross rents less housing costs, such as depreciation and property taxes). This measure includes rental income going to both owner-occupiers (imputed rent) and landlords (market rent).2 The very detailed nature of the Bureau of Economic Analysis’ regional economic accounts allows for similar estimates of housing capital income to be constructed for each US state spanning several decades.
This investigation reveals three things about the rise in the US housing capital income share in recent decades. First, it has occurred due to an increasing share of income accruing to owner-occupiers through imputed rent. Second, it is concentrated in states that are constrained in terms of new housing supply. Finally, it is closely associated with the long-run decline in real interest rates and inflation.
My results suggest that the ‘rise of housing’ is intimately linked to the same factors that underpin ‘secular stagnation’ (Summers 2014) – that is, the gradual decline in real (and nominal) interest rates since the 1980s has contributed to a gradual run-up in housing prices, and led to household wealth and income being increasingly concentrated in the hands of landowners. This in turn may have implications for intergenerational inequality, given that the home is a key mechanism through which wealth and income are transferred across generations.
Result 1: It’s (Mainly) an Owner-Occupier Story
The decomposition of the national accounts by type of housing indicates that the secular rise is mainly due to a rising share of imputed rent going to owner-occupiers. The owner-occupier share of aggregate income has risen from just under 2% in 1950 to close to 5% in 2014 (top panel of Figure 2). The share of income going to landlords (i.e. market rent) has also doubled in the post-war era. But, in aggregate, the effect of imputed rent is larger simply because there are nearly twice as many home owners as renters in the US economy. A similar phenomenon is observed in the personal consumption expenditure data (bottom panel of Figure 2). In other words, today’s landed gentry are predominantly home owners, not private landlords.
Figure 2. Housing Capital Income and Expenditure
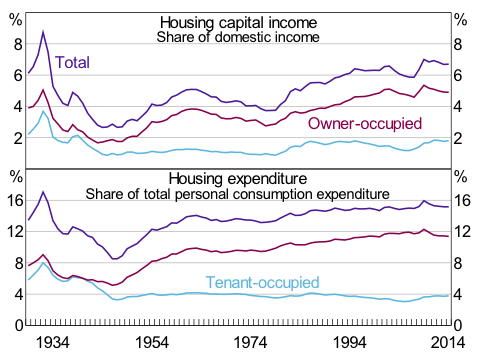
Note: Housing capital income measured as the net operating surplus of the housing sector
Source: Bureau of Economic Analysis
Result 2: Housing Supply Constraints Matter
The geographic decomposition reveals that the long-run rise in the housing capital income share is fully concentrated in states that face housing supply constraints. To see this, I divide the states into ‘elastic’ and ‘inelastic’ groups based on whether the state is above or below the median housing supply elasticity index (as measured by Saiz 2010). This index captures both geographical and regulatory constraints on home building across different US regions. For 50 years, the share of total housing capital income going to the supply-elastic states has been unchanged at about 3% of GDP (Figure 3). In contrast, the share going to the supply-inelastic states has risen from around 5% in the 1960s to 7% of GDP more recently. Notably, these divergent trends in housing capital income are not due to a few ‘outlier’ states where housing supply is particularly constrained, such as New York or California – instead, there is a clear negative correlation between the long-run growth in housing capital income and the extent to which housing supply is constrained across all states (Figure 4).
Figure 3. Contributions to gross housing capital income (as a share of total GDP)
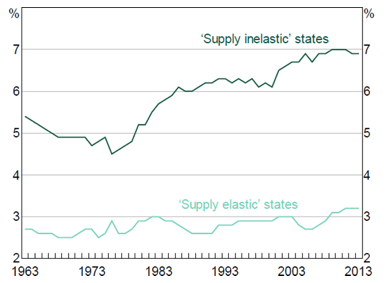
Notes: Housing capital income measured as the gross operating surplus of the real estate sector; the analysis abstracts from changes in depreciation due to the data being unavailable at the level of US state
Sources: Author’s calculations; Bureau of Economic Analysis; Saiz (2010)
Figure 4. Housing capital income growth and the elasticity of housing supply (1980–2014 average)
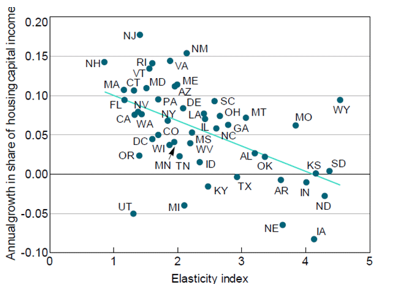
Notes: Share of housing capital income measured as housing gross operating surplus divided by GDP at state level; the estimated correlation coefficient shown is −0.52
Sources: Author’s calculations; Bureau of Economic Analysis; Saiz (2010)
Result 3: Interest Rates (and Inflation) Matter
Finally, I provide statistical evidence that the rise in the share of housing capital income in recent decades is correlated with declines in both real interest rates and inflation, with these effects being particularly strong in supply-constrained states.
In a state-level panel regression framework, there is a strong negative correlation between the housing capital income share and nominal interest rates. Moreover, a simple decomposition using the Fisher equation reveals that the rise in housing capital income across states and over time is associated with declines in both real interest rates and consumer price inflation.
The results are consistent with the argument that consumer price disinflation and the deregulation of the US mortgage market during the 1980s and 1990s acted as positive credit supply shocks (with high inflation and credit market regulation in the 1970s acting as artificial borrowing constraints). The associated decline in nominal interest rates lowered the cost of owning a home and increased the demand for housing for credit-constrained households (Ellis 2005). The resulting increase in housing demand led to higher relative prices for land in areas that were constrained in terms of new housing supply. This rise in the relative price of land, in turn, led to an increase in the share of nominal spending on housing.3 Sommer et al. (2013) and Stiglitz (2015) outline theories that are consistent with this story.
The results are robust to different measures of housing capital income, to controls for observable state-level characteristics (e.g. population and income growth), and to unobservable state factors that do not vary with time (e.g. local amenities and distance to the coast).
Implications and Directions For Future Research
My research highlights the important role of housing in not only the distribution of wealth, but also the distribution of income in the US. Indeed, the observed increase in the share of aggregate income going to housing capital might even understate the importance of housing prices for the income distribution. The non-housing capital income share has been stable for several decades (as shown in Figure 1), but within the non-housing sector, there has been an increase in the share of capital income going to financial corporations. Much of the income flowing to the financial sector is likely related to the growth in intermediation services – services that are traditionally dependent on housing collateral and, ultimately, land prices.
My results also potentially speak to a new literature on the distributional effects of monetary policy. This literature is still in its infancy, but it is surprising how little research there has been on the link between monetary policy and inequality via the housing sector. As is well-known, for most advanced economies housing assets typically comprise the largest share of total wealth for most households. Moreover, imputed rent for owner-occupiers often makes up the largest share of total household spending in the national accounts. The link between monetary policy and inequality via housing prices and imputed rent should therefore be a fruitful area of future research.
Authors’s note: The author completed this project while visiting the Bank for International Settlements under the Central Bank Research Fellowship program. The views expressed in this column and the associated paper are those of the author only and do not necessarily reflect the views of the Reserve Bank of Australia or the Bank for International Settlements. The author is solely responsible for any errors.
For references, see the original.


Really interesting article. I think that this confirms a strong suspicion many of us have – that the key difference between what may be broadly termed middle class people who are prospering and struggling is not annual income, but housing capital/costs. The difference in quality of life between two people on average incomes, but one of whom inherits (or otherwise gets free or cheap) a house and the other person who has to scrimp and save for a downpayment and then pay off a mortgage is enormous. I know many aspects of Piketty’s conclusions have been questioned here, but it does seem pretty clear that a low growth/low interest rate/low inflation environment exacerbates the problem and contributes to widening inequality by way of its direct impact on housing costs.
I think its important to emphasise the role here in interest rates and inflation. Lots of economists have already hopped on the bandwagon of saying that the problem is regulation – strip away zoning laws and environmental protection regulations and magically more houses will appear, balancing supply and demand, and inequality will be cured. Of course, some zoning laws do exactly this (and are intended to do so). But the issue of constrained housing supply is complex, and has far more to do with problems like in adequate infrastructure, low taxes on empty land, perverse incentives to demolish perfectly good buildings, the failure to invest in public or non-profit sector housing and the structure of the construction finance industry than it has with zoning or environmental protection laws.
Again, look at California for what else could work—beyond zoning politics—in the Golden State.
Instead of goosing (real estate) asset inflation by the combination of California’s Proposition 13 “tax abatement” and capital gains tax exclusion on real estate sales (up to a limit) make it actual tax abatement by:
1 giving back some of the gains at selling time due to property tax limitation during occupancy*
2 so property inflation is moderated and education is better provided for (do think of California universities’ tuition hikes in recent years and school teaching salaries in general)
When California made the decision on which pieces of tax “reform” in the Clinton-Republican Taxpayer Relief Act of 1997 to mimic or reject for the state income tax, it copied only cap gains cuts on real estate sales, the opposite of an anti-asset inflation regime.
(A double whammy for youth getting hit on their tuition costs and starter homes, if any)
3 Furthermore, limit Prop 13 benefits (so abated) to owner occupied homes—as originally proposed in Prop 8 but piggishly fought by commercial interests to the triumph of Prop 13
* in the unlikely event there are none—the world must be ending
P. S. Of course, hard to predict how much to give back—it’s like predicting oil prices as drillers react to price spikes or dives (etc.)
P.P.S. Perhaps an options scheme is a hint of how to price (limited) property tax give-back at time of sale. . .
Your comment really hits home with me.
Back in the late 70s, when I was a very young child, my mother was forced at an inopportune time to divorce a cheating & abusive husband, find a new job that could support more than just herself, buy a new (used) car and find housing as well. In a matter of a couple of weeks.
She found a house that was decent. Good primary school district. Only about 10 years old and for either sale or rent. (It was a duplex, so that made it a bit more complicated, but still)
All she needed was $5k for the down payment, and her entire mortgage payment would be what her rent ended up being at the time, and the entire duplex would’ve been hers.
She begged friends and family and couldn’t come up with it. If she had had credit card balance transfer checks she probably would’ve done it, but they weren’t around then. Her parents, not un-wealthy business owners turned her down saying, “Virtuous women don’t divorce their husbands.” They knew he was abusive and they weren’t religious. And this was a year after they gave a down payment to an uncle for a home (that he still owns to this day and rents out and provides a nice rentier income).
Unable to come up with the down payment she was forced to sign a lease for one side of the exact duplex she wanted to purchase. Two weeks later, after moving in the duplex was sold to an “investor.”
15 years later, after paying off that mortgage, the property was sold. (After his 15 year loan was done, he wanted other, different property)
My mother was still there, paying the yearly increases in mortgage anyway, despite the loan being fixed, and now faced a little more sizable increase b/c of the ownership change. They got’s to cover THEIR expenses, don’tcha know…
This cycle repeated. 15 more years she’s still in this half of a duplex. Helps pay off another landlord/investor’s note. At 15 years it gets put on the block again, doesn’t sell immediately, so she gets another one year lease, but months into that an offer is accepted and she immediately gets notice that her lease will not be renewed after that final year because the new owner liked the unit and was going to move into it.
My mother, due to simply not having a down payment (and could never raise enough for any property after that time because of being a single mother–we barely had food on the table at times…wait table, what table?…), was forced to RENT and pay one investor’s mortgage off completely, and likely a large percentage of another one’s.
Additionally, the entire time she did that she paid for lots of improvements–planted trees, gardens, carpeted different rooms inside, painted inside, took care of the entire place as if she owned it…etc. Adding value because it was (she thought) her home and neighborhood. This was her community.
And her reward for paying “rent” for over 31 years for the SAME HOUSING UNIT was getting kicked out and forced to scramble in her late 60s to find a place to live. (The move out also cost her thousands of $$ in time and energy and stress and storage and moving trucks and broken items during the move and more.)
My uncle still owns HIS home that he got a down payment for. He gets rent, after expenses keeps thousands ever year as income, plus gets to keep it as an asset and use it as collateral for the farm he was later able to buy.
Amazing how different life is for many people if you can simply scrimp together a DOWN PAYMENT.
I wonder if growing up we would’ve had more food on the table, or been able to take a vacation, if instead of paying someone else rent for her entire life, my mother could’ve had a stable, fixed mortgage payment.
Note that the dot-plot of States appears to indicate the ‘supply-inelastic’ areas are essentially the prime coastal areas, in other words, where most of the economic activity has taken place for decades, including vast amounts of migrating capital in the form of retirees.
Piketty starts from pretax remuneration . People start from after tax remuneration.
That destroys or at least diminishes greatly his argument.
And anyway in the US the picture is confused by the fact that the mortgage finance
is sector effectively nationalised.
So where do the claims come from, the ones stating that a tiny fraction of people own 70 or 80 or 90 percent of all the wealth and a huge and steadily increasing majority of all what us ordinary mopes think of as “income”?
Seems to me the boundaries of this arithmetic exercise are artfully drawn to obscure once again the Great Grab, laying some of the disparity and cancerous condition to “who inherits a paid-off mortgage,” and skimming over the huge amount of people for whom even having cheap lodgings would not spare them from a life of desperation and further impoverishment.
Or am I missing some genius economist insight?
When you see “elastic/inelastic”, you know it is economist double speak that has NO relation to reality. Those that own homes that they paid too many dollars to the banks because Greenspan et. al. we’re trying to pump up bank profits are not the new landed gentry. What a crock of sh*t from an “economist” from the BIS. As the great recession showed, the banks will own a great bulk of the landed wealth.
As more wealth is transferred to the 1% because they pay no taxes (eg Clinton, Trump), they create hovels at 50%of income for those not yet living on the street. Landed gentry – Bah!
One can question whether the big ramp-up in ‘supply inelastic’ states was a one-time secular event that is now over.
Extrapolating this trend indefinitely into the future implies an ever-widening gap between constrained and unconstrained areas.
This seems unlikely. Trees don’t grow to the sky.
Wrong. London.
1. Driven in part by population growth. 1990 us population at 250 million. Today about 320 million. That is a 28% rise. All these people need to be housed somewhere and considering the smaller average family size these days, it means a greater than 28% rise in “housing units” required.
2. Driven by interest rates. As rates have come steadily down, the monthly payment required for a “typical house” has come down, but also made the Typical House “+” more affordable. So we see an expansion of what is required for a house to be typical (sq ft etc).
3. Momentum. When we bought our house we paid cash (having rented for years). We bought the house we needed and not the one we could have afforded. In hindsight we would have made a lot more money buying a bigger house given the subsequent rise in prices. As prices keep rising the incentive is for buyers to stretch to try and grab a bigger gain. (Unfortunately for us I underestimated how stupid central banks would become – then again not having a mortgage is its own taste of freedom, smaller house and all).
4. Central banks have painted themselves into an impossible corner. Raise rates to a rational level and watch house prices drop, wiping out the “savings/gains” of the boomers. Keep them low and keep distorting the market, forever keeping the younger generation out of the housing market, with its social implications.
5. The more people have to spend on housing the less competitive the country’s workforce becomes in the global marketplace as they require higher wages to “live”. (It is one of the things driving Chinese wage inflation and loss of competitiveness). Unfortunately it is hard to get a country as a whole to go along with the smaller house/lower housing price idea, so we get a gradual erosion of competitiveness.
We are in a world where fiscal irresponsibility on a personal level has paid off for many years – if and when it changes it will be epic.
Assets such as real estate and stocks are valued by what someone is willing/able to pay for them. And as we realize in todays market, this has little to do with reality. Money is being pumped into these assets which will eventually be non-performing as they lack productivity and eventually there will be few people who can afford them.
I think there are things much more important than interest rates to deal with inequality. Universal free medical care would be a big one, eliminating medical and the related insurance costs.
A jobs program would be another big one, putting people to work doing useful things for good wages.
We need to shift focus from stock prices and housing prices as being useful measures of a healthy economy. In todays market they appear to represent the opposite.
Think this paper could be improved by drilling down another level to SMA’s. In my opinion, and it is only that, most US real estate price appreciation has been concentrated in large coastal metropolitan areas where there is little remaining “undeveloped” land available, where jobs growth has been concentrated due to the disproportionate benefits accruing to large corporations and financial entities, and where foreign flight capital has flown; i.e., urban archipelagos.
Made a similar observation then saw your comment. Agree – look at the dot-plot.
The writer is a wanker. There is much evidence in California, between San Francisco and Santa Clara on both sides of the Bay, and in the Los Angeles/Orange County area.
There is similar evidence around Greater London, and probably Greater Sydney.
All he has to do is look for data.
Concur wrt supply… in the last few decades the amount of land and RE built is mind boggling – yet prices have inexorably marched upwards. I would add places like Maricopa county in Arizona.
It might have more to do with Plaza and the unfettered capital zooming around after traditional banking lost its market share in productive capital formation, resulting in C/RE becoming a play thing for yield and bonuses. Did link an IMF paper on it some time back, Piketty should take a gander at it.
Disheveled Marsupial…. This is were I have trouble with observations based on antiquarian economic metrics which have little in common with modernity e.g. we don’t live in an artisan – agrarian reality anymore, Georgists, Marxists, Smithian’s, et al are like cavemen looking at Quantum theory and describing it with Spiritualism.
“There is similar evidence around Greater London, and probably Greater Sydney.”
And Auckland, New Zealand.
Georgism (also known as geoism and geonomics) is an economic philosophy (named after Henry George) that the economic value derived from land, including natural resources and natural opportunities, should belong equally to all residents of a community, but that people should own the value that they produce themselves. The Georgist paradigm offers solutions to social and ecological problems, relying on principles of land rights and public finance which attempt to integrate economic efficiency with social justice.
Cry Shop I take that was directed at my comment, no disrespect, but Henry’s monetary, sociopolitical – socioeconomic, environmental, global realities bare little resemblance to ours today or future potential. His world was still ripe to pluck and populations a fraction of now. I find it about as applicable as the Elizabethan Poor Law – 1563 Act, as much, as what goes on to day has little to do with the land itself, especially when one factors in trans-multinationals and the exchanges. Additionally that land in of its self imbues rights or security in any meaningful manner – see 5M-ish kicked to the curb post GFC.
Just from the monetary side of things – the disconnect between the expansion of credit and its distribution vectors is much more indicative of the problem than land ownership e.g. RE is a deprecating consumable sitting on top of a small allotment of land at the end of the day i.e. most of the wealth is on paper and not affixed to some object.
Disheveled Marsupial…. This to me is the perfection of an out of date argument w/o regard to accuracy….
It was a stand alone comment, directed at the main post.
Naturally it needs updating, particularly with concern to the other two important commons, water and air, but the main point was we need public finance for public industry.
“As is well-known, for most advanced economies housing assets typically comprise the largest share of total wealth for most households.”
And that is why it is systematically “overlooked”. Can’t touch the “suburban democratic” social basis of the status quo.
‘Moreover, imputed rent for owner-occupiers often makes up the largest share of total household spending in the national accounts.’
You have got to be kidding.