Yves here. The article underlying this post addresses one of the arguments made to claim that inequality in the US isn’t as bad as the widely-discussed figures make it out to be, as if other evidence, like the extent of private jet use and the explosion in high end housing prices, isn’t a major indicator. The nay-sayers argue that US taxes and transfer are redistributive and adjusting for them makes thing look less bad. While the data assembled by Piketty, Saez, and Zuc does show that to be true, it also shows that inequality is nevertheless rising strongly.
Another issue not addressed, and it would be too thorny to work through in a satisfactory way, is that transfers are far from the sum total of government spending. Basically, these economists have been forced to add back the type of government expenditure that ameliorates inequality. But as readers know, much of government spending is socialism for the rich, but it benefits corporations, and then flows back to individuals via executive comp, higher fees for service providers, and stock market gains. One tax expert argues that while US taxes are progressive, spending overall is regressive, and you net out with a government that overall does not do much in the way of distribution. While that is based on observation (and that includes of the ugly details of the Federal budget) it sounds roughly correct.
By Thomas Piketty, Professor, Paris School of Economics, Emmanuel Saez, Professor of Economics and Director of the Center for Equitable Growth, University of California Berkeley, and Gabriel Zucman, Assistant Professor of Economics, London School of Economics. Cross posted from VoxEU
The rise of economic inequality is one of the most hotly debated issues today in the US (Furman 2016) and indeed in the world. Yet economists and policymakers alike face important limitations when trying to measure and understand the rise of inequality.
One major problem is the disconnect between macroeconomics and the study of economic inequality. Macroeconomics relies on national accounts data to study the growth of national income, while the study of inequality relies on individual or household income, survey, and tax data. Ideally all three sets of data should be consistent, but they are not. The total flow of income reported by households in survey or tax data adds up to barely 60% of the national income recorded in the national accounts, with this gap increasing over the past several decades.1
This disconnect between the different data sets makes it hard to address important economic and policy questions, such as:
- What fraction of economic growth accrues to those in the bottom 50%, the middle 40%, and the top 10% of the income distribution?
- What part of the rise in inequality is due to changes in the share of national income that goes to workers (labour income) and owners (capital income) versus changes in how these labour and capital incomes are distributed among individuals?
A second major issue is that economists and policymakers do not have a comprehensive view of how government programmes designed to ameliorate the worst effects of economic inequality actually affect inequality. Americans share almost one-third of the fruits of economic output (via taxes that help pay for an array of social services) through their federal, state, and local governments. These taxes collectively add up to about 30% of national income, and are used to fund transfers and public goods that ultimately benefit all US families. Yet we do not have a clear measure of how the distribution of pre-tax income differs from the distribution of income after taxes are levied and after government spending is taken into account. This makes it hard to assess the extent to which governments make income growth more equal.2
In a recent paper, we attempt to create inequality statistics for the US that overcome the limitations of existing data by creating distributional national accounts (Piketty et al. 2016). We combine tax, survey, and national accounts data to build a new series on the distribution of national income. National income is the broadest measure of income published in the national accounts and is conceptually close to gross domestic product, the broadest measure of economic growth.3 Our distributional national accounts enable us to provide decompositions of growth by income groups consistent with macroeconomic growth.
In our paper, we calculate the distribution of both pre-tax and post-tax income. The post-tax series deducts all taxes and then adds back all transfers and public spending so that both pre-tax and post-tax incomes add up to national income. This allows us to provide the first comprehensive view of how government redistribution in the US affects inequality. Our benchmark series use the adult individual as the unit of observation and split income equally among spouses in married couples. But we also produce series where each spouse is assigned their own labour income, allowing us to study gender inequality and its impact on overall income inequality. In this column, we would like to highlight three striking findings.
Our First Finding: A Surge in Income Inequality
First, our data show that the bottom half of the income distribution in the US has been completely shut off from economic growth since the 1970s. From 1980 to 2014, average national income per adult grew by 61% in the US, yet the average pre-tax income of the bottom 50% of individual income earners stagnated at about $16,000 per adult after adjusting for inflation.4 In contrast, income skyrocketed at the top of the income distribution, rising 121% for the top 10%, 205% for the top 1%, and 636% for the top 0.001% (see Figures 1 and 2.)
Figure 1
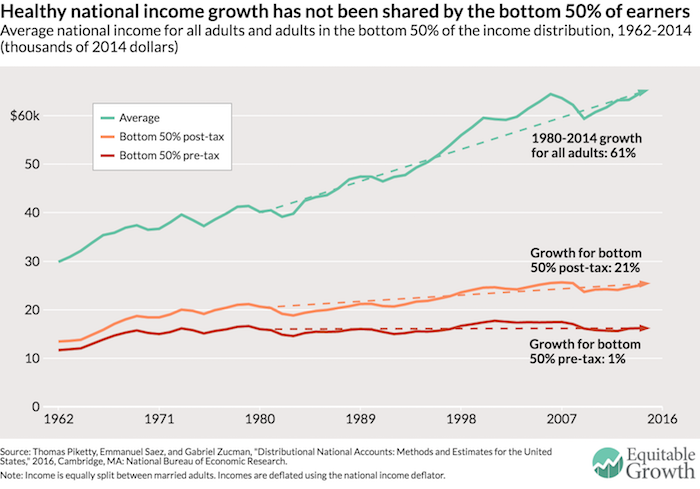
Figure 2
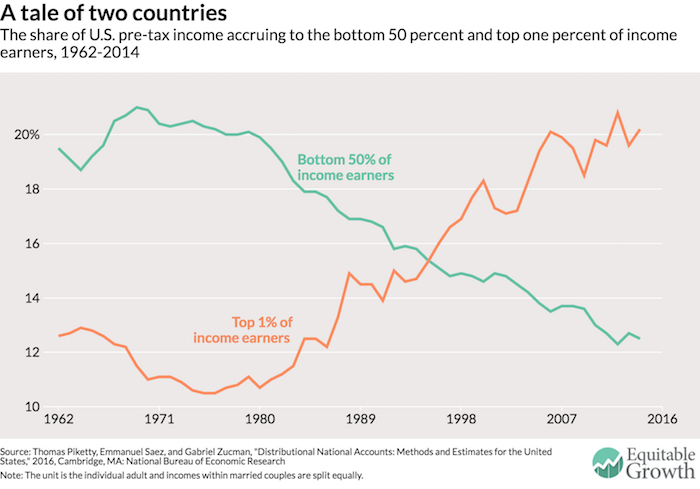
It’s a tale of two countries. For the 117 million US adults in the bottom half of the income distribution, growth has been non-existent for a generation, while at the top of the ladder it has been extraordinarily strong. And this stagnation of national income accruing at the bottom is not due to population ageing. Quite the contrary: for the bottom half of the working-age population (adults below 65), income has actually fallen. In the bottom half of the distribution, only the income of the elderly is rising.5 From 1980 to 2014, for example, none of the growth in per-adult national income went to the bottom 50%, while 32% went to the middle class (defined as adults between the median and the 90th percentile), 68% to the top 10%, and 36% to the top 1%. An economy that fails to deliver growth for half of its people for an entire generation is bound to generate discontent with the status quo and a rejection of establishment politics.
Because the pre-tax incomes of the bottom 50% stagnated while average national income per adult grew, the share of national income earned by the bottom 50% collapsed from 20% in 1980 to 12.5% in 2014. Over the same period, the share of incomes going to the top 1% surged from 10.7% in 1980 to 20.2% in 2014.6 As shown in Figure 2, these two income groups basically switched their income shares, with about 8 points of national income transferred from the bottom 50% to the top 1%. The gains made by the 1% would be large enough to fully compensate for the loss of the bottom 50%, a group 50 times larger.
To understand how unequal the US is today, consider the following fact. In 1980, adults in the top 1% earned on average 27 times more than bottom 50% of adults. Today they earn 81 times more. This ratio of 1 to 81 is similar to the gap between the average income in the US and the average income in the world’s poorest countries, among them the war-torn Democratic Republic of Congo, Central African Republic, and Burundi. Another alarming trend evident in this data is that the increase in income concentration at the top in the US over the past 15 years is due to a boom in capital income. It looks like the working rich who drove the upsurge in income concentration in the 1980s and 1990s are either retiring to live off their capital income or passing their fortunes onto heirs.
Our Second Finding: Policies to Ameliorate Income Inequality Fall Woefully Short
Our second main finding is that government redistribution has offset only a small fraction of the increase in pre-tax inequality. As shown in Figure 1, the average post-tax income of the bottom 50% of adults increased by only 21% between 1980 and 2014, much less than average national income. This meagre increase comes with two important limits.
First, there was almost no growth in real (inflation-adjusted) incomes after taxes and transfers for the bottom 50% of working-age adults over this period because even as government transfers increased overall, they went largely to the elderly and the middle class. Second, the small rise of the average post-tax income of the bottom 50% of income earners comes entirely from in-kind health transfers and public goods spending. The disposable post-tax income – including only cash transfers – of the bottom 50% stagnated at about $16,000. For the bottom 50%, post-tax disposable income and pre-tax income are similar – this group pays roughly as much in taxes as it receives in cash transfers.
Our Third Finding: Comparing Income Inequality Among Countries Is Enlightening
Third, an advantage of our new series is that it allows us to directly compare income across countries. Our long-term goal is to create distributional national accounts for as many countries as possible; all the results will be made available online on the World Wealth and Income Database. One example of the value of these efforts is to compare the average bottom 50% pre-tax incomes in the US and France.7 In sharp contrast with the US, in France the bottom 50% of real (inflation-adjusted) pre-tax incomes grew by 32% from 1980 to 2014, at approximately the same rate as national income per adult. While the bottom 50% of incomes were 11% lower in France than in the US in 1980, they are now 16% higher (see Figure 3).
Figure 3
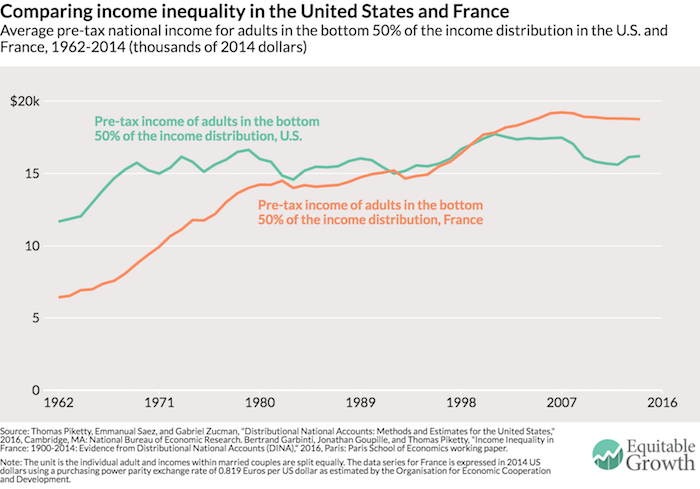
The bottom 50% of income earners makes more in France than in the US even though average income per adult is still 35% lower in France than in the US (partly due to differences in standard working hours in the two countries).8 Since the welfare state is more generous in France, the gap between the bottom 50% of income earners in France and the US would be even greater after taxes and transfers.
The diverging trends in the distribution of pre-tax income across France and the US – two advanced economies subject to the same forces of technological progress and globalisation – show that working-class incomes are not bound to stagnate in Western countries. In the US, the stagnation of bottom 50% of incomes and the upsurge in the top 1% coincided with drastically reduced progressive taxation, widespread deregulation of industries and services (particularly the financial services industry), weakened unions, and an eroding minimum wage.
Conclusion
Given the generation-long stagnation of the pre-tax incomes among the bottom 50% of wage earners in the US, we feel that the policy discussion at the federal, state, and local levels should focus on how to equalise the distribution of human capital, financial capital, and bargaining power rather than merely the redistribution of national income after taxes. Policies that could raise the pre-tax incomes of the bottom 50% of income earners could include:
- Improved education and access to skills, which may require major changes in the system of education finance and admission;
- Reforms of labour market institutions to boost workers’ bargaining power and including a higher minimum wage;
- Corporate governance reforms and worker co-determination of the distribution of profits; and
- Steeply progressive taxation that affects the determination of pay and salaries and the pre-tax distribution of income, particularly at the top end.
The different levels of government in the US today obviously have the power to make income distribution more unequal, but they also have the power to make economic growth in the US more equitable again. Potentially pro-growth economic policies should always be discussed alongside their consequences for the distribution of national income and concrete ways to mitigate their unequalising effects. We hope that the distributional national accounts we present today can prove to be useful for such policy evaluations.
We will post online our complete distributional national accounts micro-data. These micro-files make it possible for researchers, journalists, policymakers, and any interested user to compute a wide array of distributional statistics – income, wealth, taxes paid and transfers received by age, gender, marital status, and other measures – and to simulate the distributional consequences of tax and transfer reforms in the US.
Editors’ note: This column first appeared on the Washington Center for Equitable Growth website. Reproduced with permission.
See original post for references


Earnings and income are both used in the article. Earnings implies that what was received/paid was justified, income is more neutral.
In general people aren’t paid what they’re worth, they’re paid what they negotiate to get. The one thing that could easily increase workers bargaining power is reduced working time, it reduces the amount of work available to be sold. When opting for salary increases instead of reduced working hours any efficiency gains will reduce the bargaining power of workers. Workaholics, please opt for being self-employed -> you can work unlimited hours and if the rest of us employees work less your bargaining power will increase.
If I were a worker in the bottom 50% I would rather be in France than in the US. The bottom 50% in the US is working multiple jobs and not getting quality health coverage. Their life expectancy is probably much less than a comparable worker in France.
probably bottom 80% do better, just because of the lack of worry due to a safety net. I have heard one of the main reasons Sweden and Denmark are always competing for most happy country isn’t necessarily that the average middle class person is much happier there, but that the poor there are much happier than here.
The quickest greatest equalizer is universal healthcare.
All you lefties, liberals or progressives out there, why don’t you put all your other divisive issues on the back burner for a while and just focus on health care?
I bet you could even win the support of a huge group of conservatives with such a project!
If you want one big unifying theme, that one has to be it.
The thing is that the US getting its act together actually benefits the whole planet!
I believe that this was the reason for the “never,ever” remark of Clinton’s. The opening of such a major populist answer to a current “crisis” would pave the way for the pressure of a new New Deal. TPTB are terrified of such a development.
The big win the 1% will be looking for is the repeal of the estate tax so that they can pass their recently won wealth onto their future generations to develop a permanent landed aristocracy similar to the historic European system (that largely collapsed in the 20th century).
The American Dream is to be able to build big wealth. However, one of the principles of the American Revolution was to avoid the European model of a hereditary aristocracy. It will be essential to push back on estate tax repeal to avoid ending up with a hereditary aristocracy.
Shirtsleeves to shirtsleeves in three generations is one of the reasons that the US became great in the 20th century while other countries were collapsing. any period of time when large wealth was accruing to a few has turned into disaster in the US, and it appears this mistake is being repeated now. It took a series of rolling depressions to reduce inequality after the Gilded Age and it took the Great Depression to reduce inequality after the roaring 20s. Somehow we have to figure out how to reduce inequality without imperiling the entire country again. It can either been done through the tax code etc. or through hubris taking a fall in another financial and economic collapse that causes huge collateral damage.
Fair dinkum.
We know who has stolen our land and our money. They spend it in plain sight.
We need someone to stand up and take it back from them.
No, WE need to stand up and take it back from them.
YES.
Maybe it could win elections, if only we had a party interested in winning elections that wasn’t the Republicans. But some people do care about other issues, like the planet going to hell and so on. Good luck with universal healthcare on a planet that no longer sustains human life afterall.
That’s kind of what you’d get if Donald J Trump in some unlikely turn of events came out for universal healthcare I’d guess, slightly better healthcare while in the long run destroying everyone’s health and the planet.
At least one could be healthy while on the way to going to hell along with the rest of the humans on the planet.
Seriously, it would be advantageous to put single payer healthcare for all as a top priority.
Most people I talk to insist on believing that the government should be run like a business and/or be constrained to a budget, just like their own households.They might be convinced that universal healthcare is a good thing, but wonder how we are going to pay for it and worry about freeloaders.
Therefore, it seems to me that widespread understand of how our sovereign money actually functions (aka MMT) is critical going forward. And that’s a mighty big if not impossible ask.
The “rich” are more than a tad frantic. Doing everything wrong as fast as they can. They even think it is self preservation when it is really self annihilation. Although I give the big corporations credit for considering both universal health care and global warming in a very positive way… somehow the cabal that controls the budget and the value of the dollar are freaking out. Could it be private banking by any chance?
Here in Boston, the number one most income disparate city in the country,and the state is a top 5 contender, here’s some anecdotal evidence:
1. GE tax inversion move from CT to Boston, along with millions in tax breaks.
2. Akamai Technologies, $700K tax break
3. IBM, continuing the open destruction of older tech workers, millions in tax breaks
The executive wings, in the case of Akamai and IBM – millions made in share sales.
Another item they all have in common? Massive abuse of H-1B Visa Workers. Americans need not apply. If you’re over 40? Maybe take out a life insurance policy for your family and make it look like an accident so they can collect.
Socialism for the rich indeed. Eat Cake!
Medicare, healthcare for all would be the best first step. Local rural communities, towns and cities are going under just to cover their teachers, police and other employees. Owning a small plot of land or an old house does not represent wealth. Yet taxes from such citizens must fund the schools. What a boost it would give everyone if a one payer national health plan could be implemented.
With that off the table, so much human energy could be devoted to all the other issues. This would have an immediate and beneficial effect.
Canada has a single payer healthcare system (does not include dental). It is largely funded at the provincial level. This is one of the reasons why provincial income taxes are on the same scale as federal income taxes (I roll payroll taxes like FICA in with income tax for this comparison).
One of the big issues that the US will need to address is that the rhetoric is to give more control to the states yet the states generally don’t tax at anywhere near the level of the federal government in many parts of the country. As a result, there is a large discrepancy between states playing out which shows up in various inequality measures and in policy “discussions” such as Medicaid expansion.
States like NY and California have robust tax collections including income tax, payroll taxes, and property taxes. They also offer a wide array of social services approaching Canada levels in some cases. some states collect very little and offer very little. In these areas, especially in rural areas, you can find almost Third World poverty levels.
There appears to be competing ideologies that are held to be as fundamental a belief system as religion. This is getting in the way of a rational policy discussion on what services and investment should be mandated and funded at which levels of government which is very important in developing a fundamental social contract between government and the citizenry. We are still at the stage of just having propaganda being traded back and forth. The Affordable Care Act was an attempt at developing a system of mandates and associated funding at various government levels, but it has never been possible to have a coherent rational discussion about this – the recent failed attempt to repeal and replace has simply demonstrate4d how irrational the entire discussion has been.
“States like NY and California have robust tax collections including income tax, payroll taxes, and property taxes.”
As a former NYC resident who now resides in California I can confirm they definitely do, but as the main thrust of your comment points out, the huge tax and regulatory discrepancies that exist between various states undermines the progressive taxation and generous benefits of the states that seek to be more equal. I have met quite a few people in both states that maintain a “tax home” outside of NY/California. All it takes is a ski condo on the state income tax free, Nevada side of Lake Tahoe, and the tax savings alone can pay for your shady vacation/ “tax home” if you’re earning north of 200k. Other people just play it honest and move outright to escape the high taxes. Austin is a very popular destination for SoCal tax refugees these days. There is undoubtedly an even more pronounced race to the bottom underway between states with regards to business tax incentives. A phenomena which has been well documented here at NC.
Any efforts to create a more equitable system of taxation and social benefits will need uniform application nationwide at both the state level and local level to avoid arbitrage and gaming situations like we have now. Those on the low end of the income spectrum are frequently drawn to the high taxation/generous welfare benefit states (high wage, high opportunity as well) while those at the very top (0.1%) are able to freeload as various loopholes and fancy tax professionals allow them to easily dodge progressive taxation. It’s the aspiring upper-middle income families with a few children in those states that really get walloped on all sides. (high taxes, high housing costs, high education costs, high healthcare costs) The earners comprising the upper-middle part of the income spectrum shoulder the brunt of the national tax burden paying the tab for both the fat-cat shirkers at the very top and the down-trodden, underpaid serfs at the very bottom of the pile who need the most in the way of social services. These households end up fleeing the high tax states, groaning (rightfully IMHO, Trump voters perhaps?) or cheating.
It’s an unfair and sub-optimal system for sure. In the absence of fairness and equal taxation at the state level, high tax states like NY and California could offer a universal welfare benefit to all citizens, like medicare for all/ state-funded single payer. Such a benefit would be a huge cost savings for upper-middle income families and would provide them with an incentive to declare/maintain tax residency in high-tax states.
sadly i think if you add in the negative income of sub prime auto loans, non dischargeable student loans, and non dischargeable credit card debt the picture is probably way worse than this dismal panorama suggests
among many other things,medical care can’t be cheaper because of student loans, reflected in one of the papers conclusions
“Improved education and access to skills, which may require major changes in the system of education finance and admission;”
And AGAIN, the homeowners, numbering in the MILLIONS, who were throw to the curb are forgotten.
I will never recover financially from the last decade. Haven’t worked in 5 years now and am fighting 3 lawsuits. But, I am one of the forgotten.
Sorry, man
That’s tough shit to deal with, esp the employment rejection as you get old (all too common), yet too young to get any assistance from the govt.
productivity demands it
indeed, skippy
,,,:we feel that the policy discussion at the federal, state, and local levels should focus on how to equalise ,,,:
I almost laughed out loud when I read this paragraph, and the four bullet-points which followed. It’s as if the authors don’t understand that the US political class has no interest whatever in voluntarily “equalizing” income among our citizens. They have worked for 40 years to achieve exactly the distribution of income which provides them with the financial backing to protect their political careers and, often, a lucrative future in the private sector.
And who said policy discussion should be confined to the political class?
Good read, but disappointed that one of the policy prescriptions isn’t:
“Eliminate or severely reduce payroll taxes on (at least) the bottom 70% of all wage earners and replace with increased taxes on capital gains and passive income sources such as rents, interest, royalties, etc., but especially much higher taxes on landlords (property tax) and ‘net rent incomes’ (total rent income, less ONLY direct maintenance and repair costs).”
In the US, but also in other developed countries, housing prices and rent expenses have increased dramatically since the 1960’s. Over about the same period, taxes on working people have also increased dramatically (especially very regressive payroll, sales (VAT) and some US state income taxes). Until these two “real costs” (as much as 70-80% of TOTAL income for some households!) are reduced for working people, no amount of higher wages or transfer payments will truly help reverse the downward economic trend of the bottom 75% of the population.
Good luck on moving the burden of tax from labor to capital, but I agree.
We have seen zero inflation in wages and salaries over the last 40 years.
We have seen massive inflation in property, taxes, rents, insurance and health care.
Bottom line, more and more of your money goes toward repaying debt and interest, paying for government services, and paying for insurance and for rent and health care.
That is also why the retail sector is being destroyed, even without Amazon’s assistance, as we have less and less money to spend.
Yet, we are told that the central banks have inflation under control. Yeah, right
Endless graphs, stats, jargon and cherry picked exceptions that hardly, if ever, prove the rule don’t mean diddly I’m afraid.
Neoliberalism has identified, priced, commodified and honed in on with deadly accuracy, not only the things people aspire to and demand, but also the basic necessities they need to survive. Things once mostly, and rightly, provided by the state.
Their primary weapon that has allowed them to continue to exploit people’s labours, skills, fears, aspirations and innate sense of moral obligation is DEBT, (im)pure and simple.
‘homed’ not honed.
Apologies.
Picketty is admirably relentless. Thank you for this, Yves.