RJS is a rural swamp denizen from Northeast Ohio, and a long-time commenter at Naked Capitalism. Originally published at MarketWatch 666.
Lambert here: Since Hugh’s regular reports on unemployment have found a readership at Naked Capitalism, we thought we’d try for coverage of additional regularly released data series, as curated by RJS, not only to further reinforce our geek cred, but because this material, though dense, is of great interest. I like the Fred charts, too. Readers, if you have suggestions for what we hope will be a continuing series, please leave them in comments. [Revised version now posted; readers who had suggestions in comments please check.]
There were two important economic releases for May this past week; retail sales from the Census Bureau and Industrial Production from the Fed; together with GDP, employment and real income, they are followed by the NBER Business Cycle Dating Committee, official arbiters of recessions, in determining turning points in the economy…while neither was negative this month, industrial production has been weak year to date, with a negative reading in April, and retail sales fell in March, so they both bear watching…
 The Advance Retail and Food Services Sales Report for May (pdf) from the Census Bureau showed that seasonally adjusted retail sales were at $421.147 billion in May, 0.6% higher than April’s $418.840 billion and 4.3% higher than year ago sales of $403.728 billion, in figures that are not adjusted for inflation; actual sales for May, from which the headline number was derived, were at $444.122 billion, up from actual April sales of $414.705 billion, as purchases of most items, even food, typically increases seasonally from May to April…
These aggregate sales numbers are derived from questionnaires mailed or faxed to a probability sample of less than 5000 firms selected from the universe of 3 million retail and food services firms; and had a margin of error of ±0.5% for May’s figures; which means that Census is 90% confident that the seasonally adjusted change in sales from April to May was between 0.1% and 1.1%, so keep that in mind as we examine these apparently exact sales numbers….
The overall increase in sales from April to May was led by a 1.8% increase in sales at car dealers, from a seasonally adjusted $77.675 billion in April to $79.083 billion in May, a total 8.5% higher than the $72.886 billion sales of a year ago; without those car sales, retail sales were only up 0.3% for the month…other major monthly percentage gains were registered by building material & garden supply stores, whose seasonally adjusted sales rose nine-tenths of a percent, from $26.158 billion in April to $26.387 billion in May, food & beverage stores, where sales rose 0.7% from $47.822 billion in April to $48.173 billion, non store retailers (mostly online), where May sales were 0.7% higher at $37.330 billion, and miscellaneous store retailers, whose sales total of $10.601 billion was 1.2% higher than April’s…
Retailers who saw sales decline in May included furniture stores, where seasonally adjusted May sales of $8.131 billion were 0.8% less than April’s $8.197 billion, restaurants and bars, where May sales declined 0.4% to $45.928 billion, electronic and appliance stores, where Mays sales of $8.380 billion were also off 0.4% from April’s $8.412 billion, and department stores, where May sales were off 0.2% to $14.713 billion…
Seasonally adjusted month over month percentage gains for these and all types of retailers can be seen on the adjacent table from the report, which also shows the sales percentage gain from May of last year; as you can see, only nonstore, online retailers, who saw sales increase 11.3% from last year, and building & garden supply stores, who sales were up 10.1%, posted double digit year over year gains…meanwhile, year over year sales declined 0.5% at furniture stores and electronic and appliance stores, and 3.9% at department stores (not including their leased departments)…
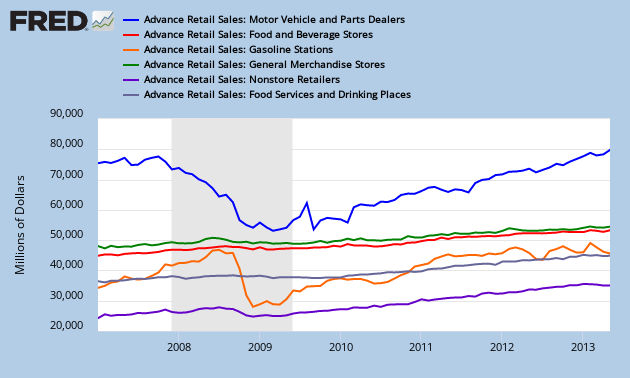
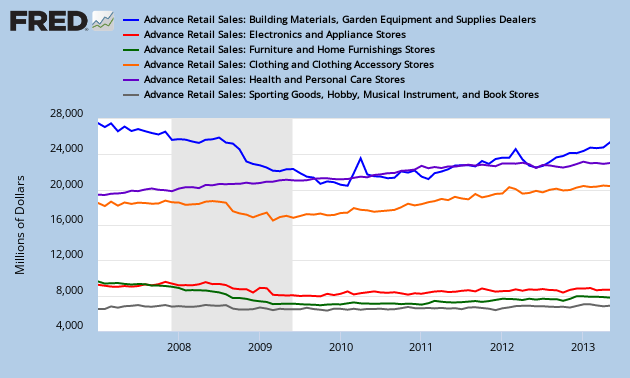
Below we have two FRED graphs which show the track of each of these major retail groups since the beginning of 2007, a date selected to show some of the prerecession sales trend for each….the first FRED graph shows seasonally adjusted monthly sales for motor vehicle & parts dealers in blue, sales for food & beverage stores in red, gasoline station sales in orange, sales at general merchandise stores in green, non-store, or online sales in violet. and sales at bars and restaurants in grey…you’ll easily note the collapse in aggregate auto sales, which was recession related, whereas the near halving of gasoline station sales resulted from a rapid fall of the price of gas from over $4 a gallon to below $1.90 nationally…before we look at the second FRED graph below, note the difference in the scale on the left of each graph; the first graph covers sectors with monthly sales amounts from $20 billion to $80 billion, while the second graph tracks sales of retail groups with monthly sales between $4 billion and $28 billion (click either for a larger view)…the second FRED graph shows seasonally adjusted monthly sales at building & garden supply retailers in blue, electronics and appliance store sales in red, furniture stores in green, clothing stores in orange, drug stores in violet, and stores specializing in sporting goods, hobbies, books or music in grey…remember, these seasonally adjusted sales amounts are not adjusted for inflation, so the apparent uptrend in any category may just reflect higher prices and not more unit sales…by rights, May’s sales gains should also be adjusted for inflation using the CPI, but the CPI for May will not be released until Monday…
With this May report, the basis for these monthly sales estimates were revised for the first time in two and half year to reflect the introduction of a new probability sample, based in part on the results of the 2011 Annual Retail Trade Survey; details on reliability of estimates for each kind of business are included at the end of the report (pdf)…as we mentioned, May’s overall sales figures had a margin of error of ±0.5% and are subject to revision..in a special report, doug short looked at the differences between the monthly advance estimate, which we have just covered, and the third estimate, released two months later, over the period from 2007 until the most recent 3rd revision; he found that over this period, there were 33 upward revisions and 41 downward revisions, with an average revision of 0.38%; the average upward adjustment was 0.30%, and the average downward adjustment was -0.44%…the chart he developed showing the dollar value of those revisions in millions is included below….
On Friday, the Fed released their report on Industrial production and Capacity Utilization for May, which showed seasonally adjusted industrial production unchanged from the April report; the industrial production index, which is benchmarked to 2007=100, stood at 98.7, still 0.2 lower than February, after a decline of 0.4% in April and an small rise of 0.2% in March…
The manufacturing index was up 0.1% to 95.3 after declines of 0.3 in both March and April, bringing that index back to December’s levels, while the mining index, now largely tracking oil & gas production, rose 0.7% to 117.5…offsetting that was a 1.8% decrease in utility output which left the utility index at 98.7, which was nonetheless still 3.1 points higher than it’s year end reading of 95.6…unusual volatility in the utility index year to date, mostly due to a colder than normal march which led to a 5.3% jump in utility output, has translated into misleading monthly readings on the overall index, which is up 1.6% year over year, with manufacturing output up 1.7%, mining up 4.8% and utility production still down 3.6% from last May, a month where well above normal temperatures led to increased use of air conditioning…
In addition to the indexes for these major industry groups, this report also indexes industrial production by market group; the index for production of consumer goods, which accounts for 27.14% of the total IP index, slipped 0.1% in May to 93.9, after falling 0.7% in April; production of durable consumer goods rose 0.2%, with strength in automotive, electronics, and appliances and furniture; however, production of consumer non-durables, the larger component, saw its index slip 0.2 to 93.8, with weakness in food & tobacco, paper products and energy products more than offsetting increases in the indexes for clothing and chemical products…meanwhile, the May index for production of business equipment rose 0.2% to 102.2, as a 0.5% increase in the-production of transit equipment, primarily medium and heavy trucks, and a 1.2% increase in the index for information processing equipment to 101.5 more than offset a 0.3% decline in the index of industrial and other equipment to 100.9…in addition, the index for production of defense & space equipment extended its string of monthly declines to six as as it fell 0.7 points from 112.3 to 111.6…among non-industrial supplies, the index for output of construction supplies slipped another 0.2% in May and is now at 80.7, down 2.1 points since February, while the index for business supplies fell 0.3% to 90.3 and is now 0.7% below the reading of last May…meanwhile, the index for the output of materials to be processed further rose 0.2% to 104.7 as all major component indexes gained ground, with particular strength in the production of energy materials, chemicals, textiles, consumer durable parts and equipment parts…
Also reported with this release is the capacity utilization by the major industry groups; simply put, this is the percentage of plant and equipment that was being used during the month, analogous to an employment report for machines…seasonally adjusted capacity utilization for total industry in May slipped 0.1 percentage point to 77.6%, the lowest utilization since October; again, that monthly change was mostly a function of the pullback in utility operations as weather returned to seasonal norms, as a seasonally adjusted 77.3% of utility capacity was in use in May as contrasted with 78.7 in April and 81.3% in March; however, usage of our overall capacity continues to slip, and is now 0.2% below the 77.8% level of a year earlier; as of May, were only using 75.8% of our manufacturing capacity, and that’s 0.6% less than we were using at year end…essentially, that means we had 24.2% of our manufacturing plant and equipment idled in May, which also means unemployment of those who’d otherwise run those machines…usage of our mining equipment, which includes drilling rigs, is a bit better at 88.2%, up from 87.6% a year ago, and the year over year decline in utilization of our utility plants from 81.2% to 77.3% is likely more a function of the warm weather last year than of reduced industrial usage of gas & electricity…
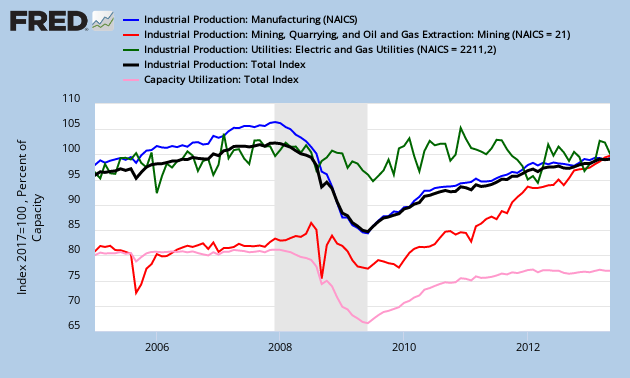
Our FRED graph for this release, to the right above, shows capacity utilization for total industry in pink, with the scale indicating percentage of capacity in use; it also shows the production index for all industry in black, the manufacturing production index in blue, the utility production index in green, and the mining production index in red; note that all these industrial production indices were reset at the peak where 2007=100, and the scale on the left also reflects this…it’s fairly obvious that the only significance industrial growth we’ve seen over the decade is in "mining", driven by the extensive spread of hydraulic fracturing of the bedrock beneath our feet…
Lambert here: RJS kindly supplied a revised version of the post based on your comments. Readers, further thoughts?


Paragraphing. Invest in some more line breaks & shorter sentences, shorter link spanning. I wanted to read this, I’m in business, but this is very eyeball-unfriendly.
Thanks. I added that line for exactly this sort of feedback. Reader feedback was very important in making Campaign Countdown the success that it was, even though it was similarly dense material.
there are logical breaks where paragraphs could be started, & i could have done that if you’d have asked…i kinda thought you would, as yves did to my last piece…
shorter sentences would be hard, because i write the way i think…but i can see it’s “eyeball-unfriendly” & reduce links accordingly…
sent you html for this with paragraph breaks, lambert, should you want to edit it..
Thanks, we’ll see what readers think!
” we thought we’d try for coverage of additional regularly released data series… because this material, though dense, is of great interest”
Non-geeks could use some interpretation here. What is the “great interest”?
Cutting to the chase, is the message: the economy is going nowhere?
What Hugh said: “All in all, mediocre growth in industrial production and poor utilization rates draw a picture of a deteriorating industrial base.”
But I got that message, too. However, it’s nice to have the entrails to read as well….
there really isnt a “message” from just two monthly reports, mary bess…these, combined with GDP, employment, disposable income and a few others, over a period a few months, should give us a sense whether things are getting worse or better…the charts are included to give you a picture of the longer term trend; you can see manufacturing and industrial production overall hasnt even returned to prerecession levels…for retail sales, it’s surprising to see us continue to spend in the face of anemic disposable personal income gains, & i probably should have pointed that out, but trying to understand the revision to the probability sample distracted me…the point is that we’re spending beyond our means again, and the savings rate, at ~2.5% for the past three months. has been lower than any time except for just before the recession started, & that’s not sustainable…
what’s of ‘great interest’ is that lambert and a few other geeky types really get off on seeing the hard data laid out…but as i advised him, running my posts like this one here will probably bore the crap out of the regular naked capitalism audience…
Industrial production is a fairly crude measure like GDP. Both hide questions about the limits to growth, the societal value of what is being produced, and who is benefitting from them.
That said, industrial production grew rapidly in the 1990s and topped out in June of 2000. Since then it has been hammered by the 2001 and 2007 recessions, but also by offshoring, free trade, cheap imports, and the general hollowing out of the US industrial base.
https://research.stlouisfed.org/fred2/graph/?graph_id=93755&category_id=0
Looking at the 1990s, the growth in industrial production after June 2000 as been lackluster, even lame.
If we look at capacity utilization, how much we are doing with what we have, it plateaued at a high level in the 1990s but began a dropoff in early 1998. The 2001 recession hit, there was a recovery and capacity utilization plateaued again from 2005 to mid-2008 but at a lower level. Another recession, another “recovery”, another plateau, but at an even lower level.
Industrial production now is far below where we would expect it to be looking at growth in the 1990s. Yet even so, this reduced industrial base is not being utilized at anything like the boom rates of the 1990s or even the bland ones of the Bush years. As an aside, it is interesting how little umph the Bush housing bubble gave to industrial production, but then we should have known that the big benficiaries of the bubble were China and Wall Street.
All in all, mediocre growth in industrial production and poor utilization rates draw a picture of a deteriorating industrial base.
Industrial production is a crude measure… but it’s hard to fake, unlike GDP.
It’s worth noting that during the Great Depression and before, the financial newspapers carefully tracked things like railroad car loadings, steel manufacturing, coal mining, grain production, etc. In the front-page headlines. (I learned this from “News from 1930”.)
Now, we have these fuzzy “GDP” numbers as the headline numbers. The GDP numbers are full of financial shenanigans and count banking manipulation as “production”. This means that even the financiers — unless they look past the headlines — are being misled about the state of the economy.
What you said, Nathanael. Too bad we can’t ground truth the stats…
Well, I guess Lambert is still rejecting my comments without reading them. I don’t see what anybody reading this one could have objected to. Have a nice day.
Yawn.
You can click on RJS’s FRED charts and change them at FRED!* You can even add data series…
That is really keen functionality (or would be, if I understood how FRED works or understood which data series are meaningful and how they relate…)
UPDATE * Adding, not the originals in the post of course. But people change the charts and then try out pasting them into comments ;-)
here is the FRED retail sales data/graph collection from which the two retail graphs were selected
http://research.stlouisfed.org/fred2/release?rid=9&soid=19
i chose the single retail groups to display, rather than those such as “retail sales excluding auto”, & picked the five larges by dollar volume to put on one graph, & five smaller retail groups on the other…if you want to know why i did it that way, try adding the code for auto sales (RSMVPD) to the 2nd retail graph, using the “add data series” button under the 6 lines already there, & see what happens..
i mean 6 largest and six smallest
It would be useful to include an actual calculation or diagram depicting mining’s weight in the overall production numbers. Aside from heavily discounted autos, home sales and prices largely the result of shut-in inventory of at minimum a million homes, and the prospect of expanding war in Syria, the oil and gas fracking/unconventional drilling boom is key.
The divergence of opinion between the 2 schools of thought on the importance of this boom for US energy production and its strategic implications make this by far most important sector to watch, as it will either be a huge economic boon (and environmental bust) or a huge economic bust if it turn out that actual production consistently fails to meet expectations, and the economics of drilling fall apart.
For what it’s worth, I stick by my view oft-voiced on NC that the next big rout will be in latter 2014 – which I note, incidentally, is about enough time to found out whether or not the fracking boom has a real future. The Feds will raise their rates by less than 1% max, so it won’t be Fed action of inaction that forces the issue.
that is an excellent question; the following table shows the proportion of total industrial production for each industry group and market group:
http://www.federalreserve.gov/releases/G17/Current/table4.htm
scroll down to the bottom and you’ll see that “mining” is 14.62% of the total; the types of mining isnt broken out, but it’s a fair guess that the cause of the boom in that sector is oil & gas drilling
Good day! I just wish to give you a huge thumbs up for your excellent information you have got right here on this post.
I am coming back to your website for more soon.
Packages for affordable web design services in Edmonton, Canada.
Web Designer packages starting from $1500. Professional
Web Designer at your service,