By Nicholas Shaxson, the author of Treasure Islands, an award-winning book about tax havens. Originally published at Fools’ Gold
There are a lot of ‘competitiveness’-related rankings of countries and states out there, from the World Economic Forum’s Global Competitiveness Report, to the World Bank’s Ease of Doing Business rankings. It’s interesting to note, for starters, that the highly taxed, highly regulated Scandinavian economies seem to do just as well as their low-tax, lightly regulated peers. Recently we made up a little graph to illustrate this, looking at the WEF’s ranking:
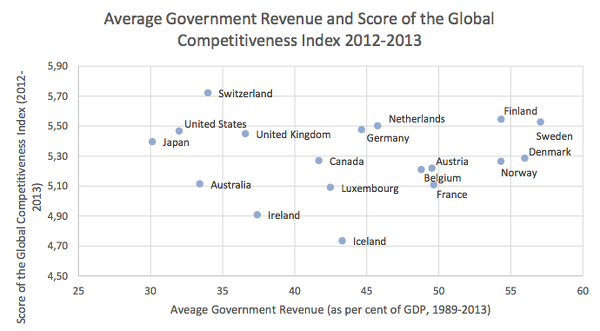
Source: World Economic Forum, Conference Board. The sample of countries included those with comparable levels of GDP per capita, and excluding micro-states which often have their own ‘tax haven’ growth dynamics. We used states with GDP per capita (PPP) of above $20,000 on average from 1989-2013. Source: Conference Board data tables.
There’s no obvious trend here, is there? The high-tax countries seem to be just as ‘competitive’ as the low-tax ones, it seems, even on the WEF’s measures, (which are somewhat skewed toward the low-tax, light regulation model.) The non-trend you see in this graph is just as Martin Wolf, Paul Krugman and various others would have predicted.
Now ‘competitiveness’ in these rankings is usually taken to be a pointer for future economic growth potential and as Krugman commented a few days ago in a post entitled ‘Competitiveness and Class Warfare’:
“Economic growth is pretty insensitive to policy: France and the US are at the extremes of advanced-country regimes, yet there’s not much difference in their long-term performance.”
Wolf made this point from a tax perspective not so long ago, with supporting graphics. As he put it:
“The spread in the average tax ratio is quite large, at 26 per cent of GDP, from Japan to Denmark. It is even quite surprising that such a spread seems to have no effect on economic performance. . . . a tax burden within the range of 30 per cent to 55 per cent of GDP) tells one nothing about a country’s economic performance. It is far more a reflection of different social preferences about the role of the state. What matters far more are culture, quality of institutions, including law, levels of education, quality of businesses, openness to trade, strength of competition and so forth. My conclusion is that the focus on the tax burden is misguided. Alternatively, the economic arguments are a cover for (perfectly understandable) self-interest.”

From the Iowa Policy Project / Good Jobs First: “Selling Snake Oil to the States,” 2012
(There’s more on the theory backing these findings here.)
Now in today’s post, complementing our earlier U.S.-focused post on corporate handouts, we’ll look at a ranking called “Rich States, Poor States: ALEC-Laffer State Economic Competitiveness Index,” in which the American Legislative Exchange Council (ALEC), a business lobby group, ranks states according to how business-friendly their policies are. U.S. states are a particularly interesting petri dish for investigating this stuff, not least because Iowa is more like Vermont than France is like the United States.
ALEC claims that its influential Economic Outlook ranking (there’s also an Economic Performance Ranking) is a good pointer for which states will grow and which won’t.
But is it any use?
Well, a ranking that places New York in last place, and Utah in first, is clearly quirky. And warning bells should ring for anyone looking at Alec’s webpage on this study, because it’s got the laughable Arthur Laffer as one of the main authors.
Bloomberg commentator Noah Smith looks at it in more detail:
“Alec lists 15 factors that it claims boost state growth rates. These boil down to low taxes, low levels of government spending and light regulation. In other words, these policies are similar to the ideas John Cochrane describes, and that pro-free-market economists have been promising us will boost growth since time immemorial. It’s a simple prescription: shrink the state, cut taxes and the economy will grow.”
Do the ‘competitive’ and ‘business-friendly’ policies that Alec’s proposing actually work?
The answer seems to be a resounding ‘no’. Bloomberg continues:
“Menzie Chinn, an economist at the University of Wisconsin, applied his formidable statistics skills to investigating the impact of ALEC’s rankings on actual state growth levels. What he found was startling — the ALEC rankings didn’t predict a state’s growth within one year, three years or six years. . . . In fact, when Chinn controls for a number of other variables, such as urbanization rates, weather and access to waterways, he finds that there may even be a negative relationship between the ALEC rankings and growth — in other words, states that ALEC claims have more business-friendly policies might actually grow more slowly!”
The exclamation at the end of that is a testament to the fact that the conventional wisdom about corporate handouts and competitiveness has become so ingrained that evidence of the overwhelming, long-established truth (that they are useless) comes as a big surprise to so many people.
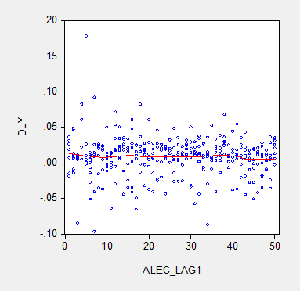 Here’s one of Chinn’s graphs, just for illustration. He concluded thus:
“Bottom line: The ALEC ranking, which purports to measure business-friendly policies, is not correlated with real GSP growth, either short term or medium term. . . the ALEC economic outlook ranking is, in my assessment, a manifestation of faith based economics.”
Smith also points to a report by the Iowa Policy Project, a think tank, and Good Jobs First, which we recently blogged. Their analysis essentially reached the same conclusion as Chinn. They investigated ALEC’s factors of competitiveness individually, and found that none of them had much of a relationship to growth.
Here are a couple of graphs from that study, which paint a similar picture.
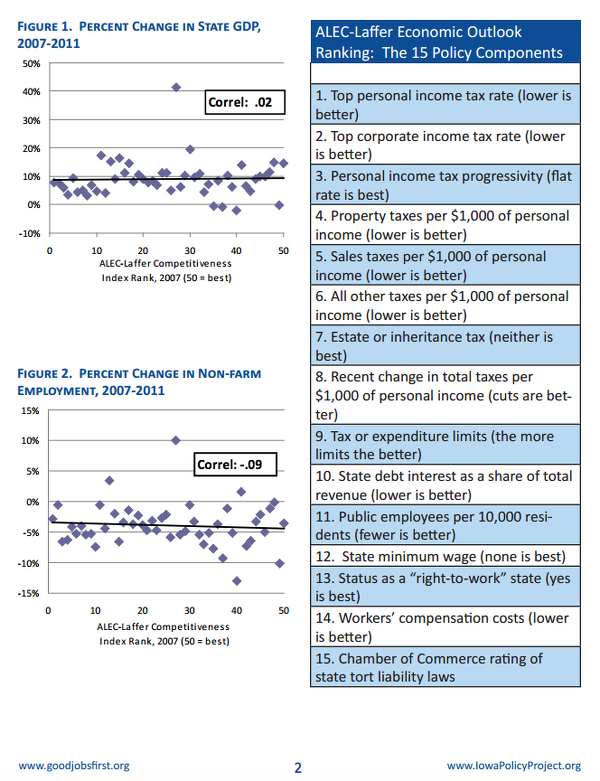
Those are all negligible correlations, and the study provides a number of others. It’s funny how all the graphs in this post seem to look roughly the same. At the end of the day, though, this should not be surprising: tax is a transfer within an economy, not a cost to an economy — so it’s not obvious how a tax cut necessarily boosts growth. Still, that’s not the story you’ll hear in much of the media.
The study concludes:
“Despite the long-established body of evidence regarding the sources of growth, Rich States, Poor States consistently fails to acknowledge where state prosperity comes from and the vital role of state government investments in ensuring effective economic development. Its focus instead is on measures that would produce growth without development, or would merely facilitate the greater accumulation of wealth by those already the richest.”
Which is, essentially, the story of the Competitiveness Agenda.
Now what’s been written about in this blog generally concerns how these various policies and factors affect economic growth. But focusing on headline economic growth, and GDP, glosses over a lot of different things, like wealth and income distribution. Once you start to take these different things into account, the graphs can sometimes acquire a very different shape. Such as this one:
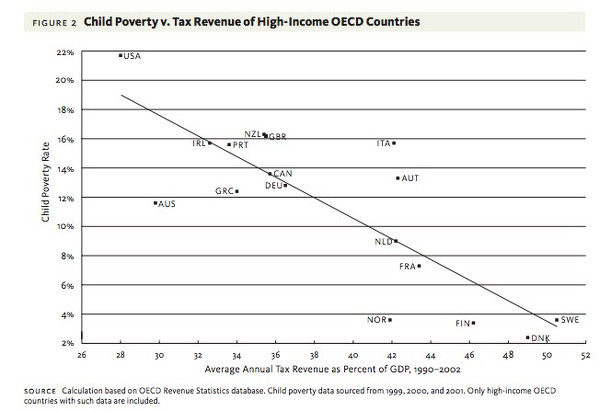
Source: The Social Benefits and Economic Costs of Taxation: A Comparison of High and Low-Tax Countries, By Neil Brooks and Thaddeus Hwong, Canadian Center for Policy Alternatives, Dec 2006, Fig. 2
That study, while somewhat out of date, is nevertheless striking. Their conclusion?
“High-tax countries have been more successful in achieving their social objectives than low-tax countries. Interestingly, they have done so with no economic penalty.”
It would be interesting to update this research.
Comments enabled at the request of the author


Outstanding! Thanks for this timely and hugely important post. Two ways to fill out the picture more. First, expand on the child poverty picture with additional indicators related to distributional effects such as employment/unemployment, part-time vs full-time employment, various affordability pictures (e.g. in no US State can median wage earner afford to rent an apartment at 30% of income), etc.
Then, second, income inequality — only turn this on its head. That is, show the correlation of ALEC policies with the stated objective of making a sliver of the population wealthier. My guess: very strong correlation.
I’m calling BS on this whole article. No fair using data in making economic arguments!
Seriously though, everybody bookmark this one and have lots of copies ready to hand-out to your state legislators. Sometimes, having the facts actually can make a difference. At the very least, you’ll be able to distinguish between the naive and the just-plain-unscrupulous among your state representatives. The former will be willing to look at the evidence, the latter won’t be at all interested…
You are absolutely correct that this “reality-based” analysis should be handed-out to policy-makers and journalists. ALEC exists largely to create “research” and “studies” using smoke and mirrors, so that their wholly-owned elected-official and “news”-stenography subsidiaries have something to point to in order to justify corporate welfare and lower tax rates on the .01%.
But that’s the thing, isn’t it? We know that progressive income taxation is a good thing. There is nothing new about that. People who advocate lower marginal income tax rates and lower estate tax rates and so forth are advocating increased concentration of wealth and power.
It’s not a knowledge gap among policy makers. It’s the desired outcome. Inequality isn’t an accident; it is the goal.
What is unique about the US is that we have a large government and a large underclass of marginalized, disadvantaged, voiceless citizens. I think focusing on revenue as a percent of GDP hides the extent of that picture. It makes it look like the reach of public policy is much more limited than it really is.
Which is exactly what the bipartisan authoritarians want – to make it seem like they are for small government when actually they are expanding government on a massive scale.
***
On ALEC, I’d say this demonstrates the attempt to link two notions that are unrelated but that at a passing glance may be made to appear related: tax levels and the size of government. Size is a metric of power, of reach, of influence. The amount of taxes collected is not a good proxy for that.
More generally at the national level, that introductory chart from WEF is fascinating. There are three basic problems with it that seem so obvious it is either incredibly negligent or purposeful misdirection. First, some countries like the US run massive budget deficits. So revenue is a terrible marker of size. At a bare minimum, it should use spending instead.
Secondly, a huge part of the US system in particular is about tax loopholes. Most of the tax code is comprised of exceptions to the tax code. The absence of revenue is not reported, yet it is a huge part of how our system works, the true size of the government in directing private sector activities.
Thirdly, the real test of size is not revenue or spending. It is what power governments claim over individual actors through a combination of tax collections, tax breaks, spending appropriations, and unfunded mandates. A Social Security employee and a TSA employee may have similar revenue and expenses for their cost of employment, but they represent rather different sizes of government activity. Only one of those employees has the blessing to make you disrobe, confiscate your water bottle, stick their hands down your pants, take naked pictures of you, and deny you access to transportation. That is an exercise of power disproportionate to the currency units represented in either the tax collection or the spending.
re: the top graph
a few things seem off about it:
-japan seems very low (x axis). are taxes really that low in nippon? i wouldn’t have thought of japan when probed for least regulated countries
-ireland seems to high (on the x axis): personal income taxes are high but corp. tax rates are famously low. perhaps income from corporate tax as % of GDP would have been a better axis?
-the second point might be due to the fact that the data are averaged over a very long range: 1989-2013. perhaps 2009-2013 would have been more pertinent as a lot changed in 2008
none of this to say that higher taxes and regulations are in any way bad
And of course even, causation/correleation/data-set selection, in a high-regulation polity, one might look at the substance of the regulations — more and more of which are written to protect corporate “persons” against upstart competitors, and have not a dang thing to do with what ordinary mopes think of when they think “regulation:” stuff about reducing dangers to health and safety, improving financial and bigger-scale economic stability, all that silliness… So of course the hypocrites in ALEC-land, who pump out all kinds of rulemaking, are just fine with rules, even lots of complex rules, federal and state and local procurement comes to mind, even sh_t like Obamacare which they can both criticize and demean as a “liberal shibboleth” while smugly riding the paywagon all the way to the bank, as long as they benefit the ALECistas…
I guess that’s one of the many outcomes “we” want from “our” political economy? On the evidence, at least?
Perfectly good points, vidimi and mcphee. There are, as always, plenty of possibilities to choose from. Japan, though: that’s just what the data says. Here’s an alternative data source, measuring a slightly different way: this also places Japan pretty low, though not as low as with Conference Board data. https://stats.oecd.org/Index.aspx?DataSetCode=REV I think the CB may have updated their data set recently, so there may be a new series out there, which I’ll look at at some point. on correlation and causation, well yes, of course, as always. But Chinn’s time lag thing does help in this respect.
Too bad taxes are deemed revenue here. What high taxes do is reduce wealth concentration, which in turn reduces rents and other macroeconomic drags. Net: tax the Rich or they make us poor, if not dead.
For an example of this type of magical economics take a look at Kansas.
Eliminating income taxes on businesses (always referred to as “small business”) was supposed to produce some sort of economic miracle. New businesses would flock to the state, employment would soar and increased personal tax base would more than make up for the lost revenue from businesses.
Guess what? Didn’t happen.
Now in order to (try to) balance the state budget, sales & property taxes (the most regressive types) have been increased & the education budget has been cut.
Good job Brownback! (as the Koch bro’s might say).
yes, i should have mentioned kansas, to bring a bit of real world into this post.
yogi berra….this is a great article and alec is really about making it safe for trust fund know nothings who cant figure out that splosh of paint on a canvas is not worth this months check…
but the world is stuck on stupid…america was built on the meme that the nobody might get up to bat with two on two out in the seventh inning down by two…yogi is america…he delivered when it counted and took his swing…
alec uses its persistence to push things its trust fund baby loser crowd wants to happen…
the key for the unwashed is to stand between the guard and the tackle and then not letting go of the ankle once you get into the backfield…
you don’t have to tackle to win…
great article
Size has nothing to do with it.
It’s the heart that matters most.
Right now, the size is big enough to do the job.
“Faith-based economics”. Great expression…although too generous. Neoliberalism is a political ideology which clothes itself in the garb of economics, so as to cover its naked rapacity.
Still, it is true that the Oligarchs do sincerely believe in their divine right to rule…and that’s a kind of faith, i guess…