By Lance Taylor, Arnhold Professor of International Cooperation and Development, New School for Social Research. Originally published at the Institute for New Economic Thinking website
Current proposals will worsen inequality and harm those Trump promised to protect—while further enriching the top 1%
President Trump, in his inaugural address and elsewhere, rightly says that over the decades since 1980 American household distributions of income and wealth became strikingly unequal. But if recent budget and legislative proposals from Trump and the House of Representatives come into effect, today’s distributional mess would become visibly worse.
First, I will sketch how the mess happened, then I will propose some ideas about how it might be cleaned up. I will show that even with lucky institutional changes and good policy, it would take several more decades to undo the “American carnage” that the president described.
How We Got Into Today’s Distributional Mess
In an INET-sponsored project at the New School for Social Research, we drew on standard government sources to rescale data on income and wealth distributions to be consistent with national income and financial accounts.1 Rescaling allows consistent macro level analysis of distributional shifts. We put together a demand-driven economic growth model to assess possible impacts of Trump-style policies and egalitarian alternatives.
Income and wealth distributions are multi-dimensional, but in the last few decades American experience can be understood in terms of a three-way breakdown of households – the rich represented by the top one percent in the size distribution of income, the bottom sixty percent, and the “middle class” in between. Over time some households will of course cross the income-level boundaries separating these bins, but such micro level detail is ignored in this and many other discussions.
Although they enjoy substantial labor payments, the top one percent households mainly rely on property income. Members of the middle class get 80% of their income from compensation for employment and government transfers. Over recent decades, households in the bottom group received 40% to 50% of their income from employment and 30% to 40% from transfers. The transfer share rose over time.
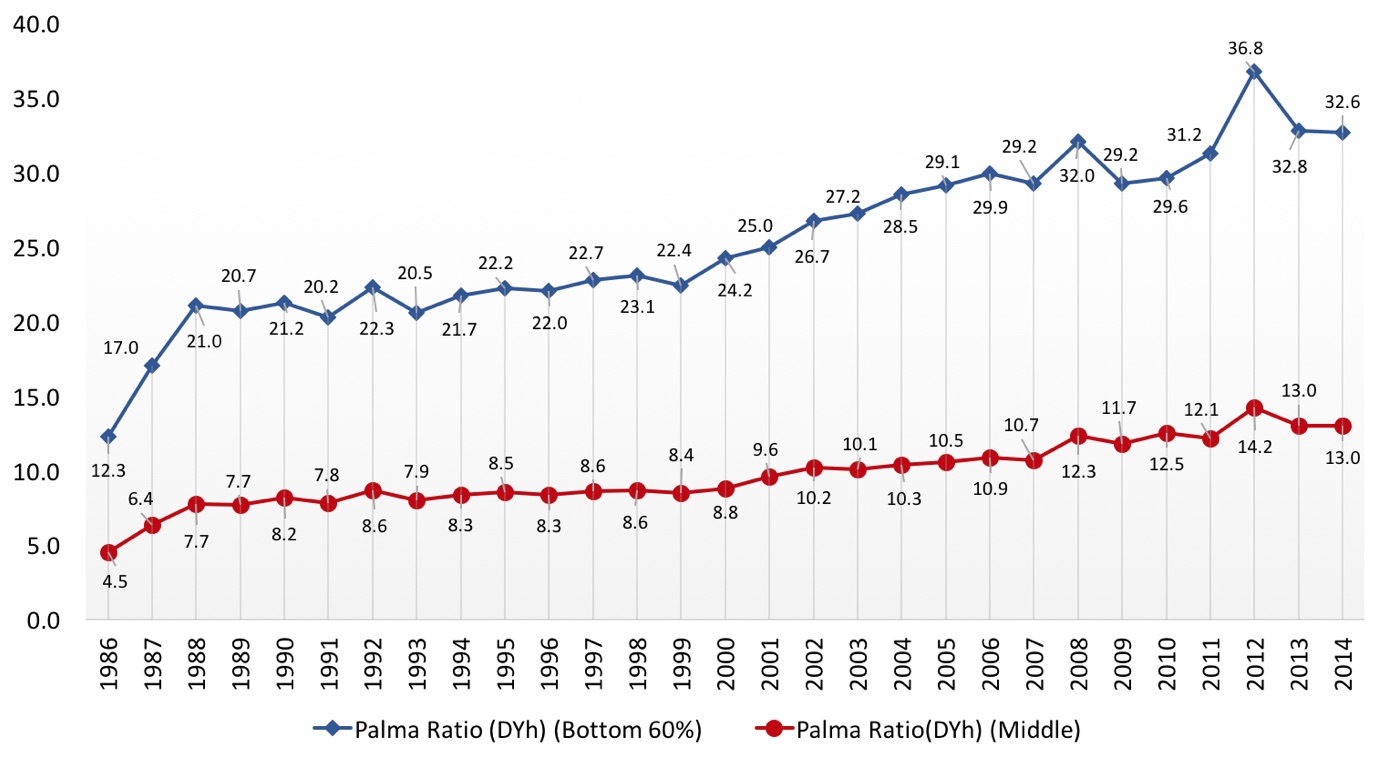
José Gabriel Palma of the University of Cambridge introduced an illuminating metric for disparity between a top income group and remaining households. Figure 1 shows “Palma ratios” of mean (average) disposable household income of the upper one percent to the means of the lower two groups. Thirty years of unequal economic growth generated the very high ratios at the end of the period. Growth rates of the Palmas were three percent per year – an astonishingly high number for any macroeconomic ratio over such a stretch of time.
Figure 1: Palma ratios based on disposable income per household (DYh)
To borrow a metaphor from ecology, rich households are the top predators of the economic system, shaping prospects for all participants in the income chain below. Before getting into policy comparisons it makes sense to look closely at the top.
Figure 2 shows how the one percent’s income rose over time – late in the period the average was more than $2 million per year. Their total pre-tax income in 2014 was $2.7 trillion. GDP was $17.4 trillion so the upper group took in 15.7% of output; Including capital gains (which don’t enter the national accounts because they are not a cost of production to firms), they got close to three trillion.2
Figure 2: Sources of income for the top one percent
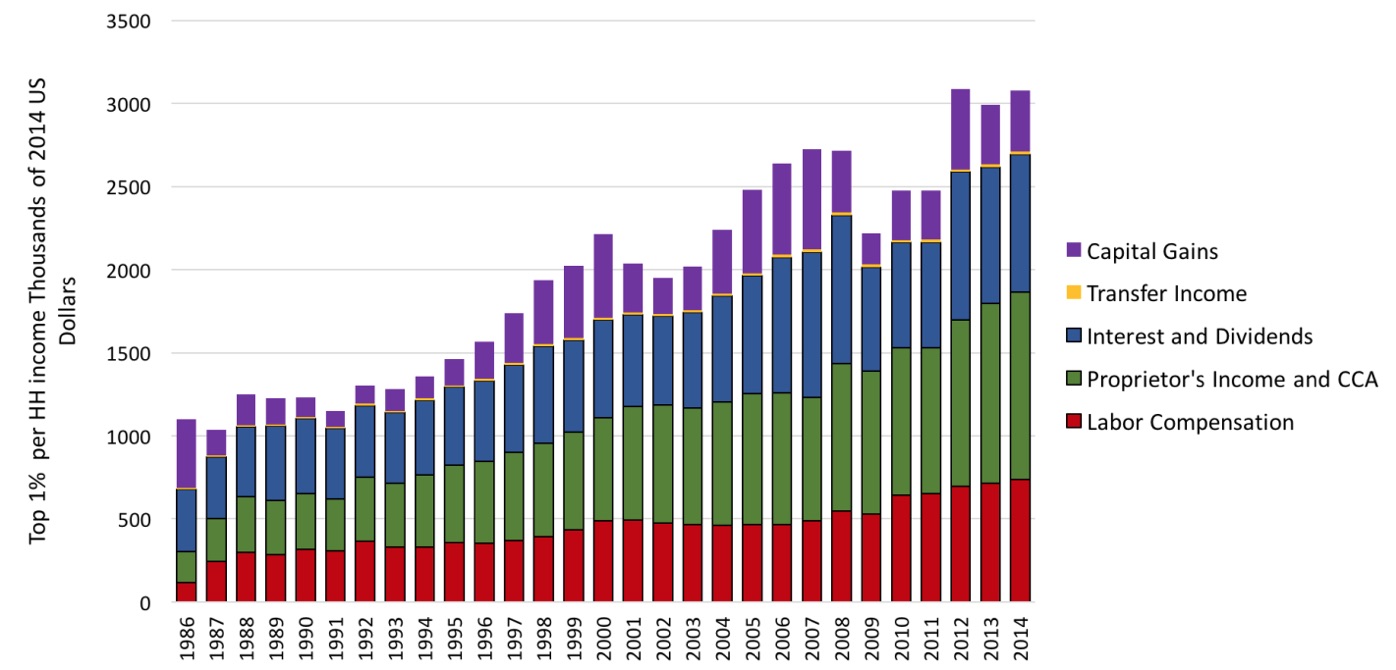
The bottom segments of the bars show that rich households received substantial labor compensation including bonuses and stock options which have exploded in the recent period.3 The top one percent’s labor earnings in Figure 2 grew at 6.5% per year!
Nevertheless, most of their money came from control of capital.4 Their “proprietors’ incomes” along with rents and depreciation exceeded labor income. Interest and dividend flows supported by corporate profits (the GDP share rose by more than five percentage points) were the same as or greater than earnings from employment. Finally, capital gains on equity and real estate usually ranged in the hundreds of thousands per household per year. Non-wage income per wealthy household roughly doubled between 1986 and 2014, with a growth rate close to three percent per year, much faster than the growth of output.
A final striking feature of Figure 2 is that apart from miniscule transfers, all forms of income received by rich households grew steadily over time. The steep slopes of the Palma ratios in Figure 1 were supported by diverse payments which increased reliably. Reversing all these trends will not be easy.
Figure 3 summarizes uses of income by the top one percent. In the overall picture, their interest payments and contributions for social support programs are minimal. The major outflows are for consumption, saving, and direct taxes. Taxes and saving are both around 20-25% of income.
Figure 3: Uses of income by the top one percent
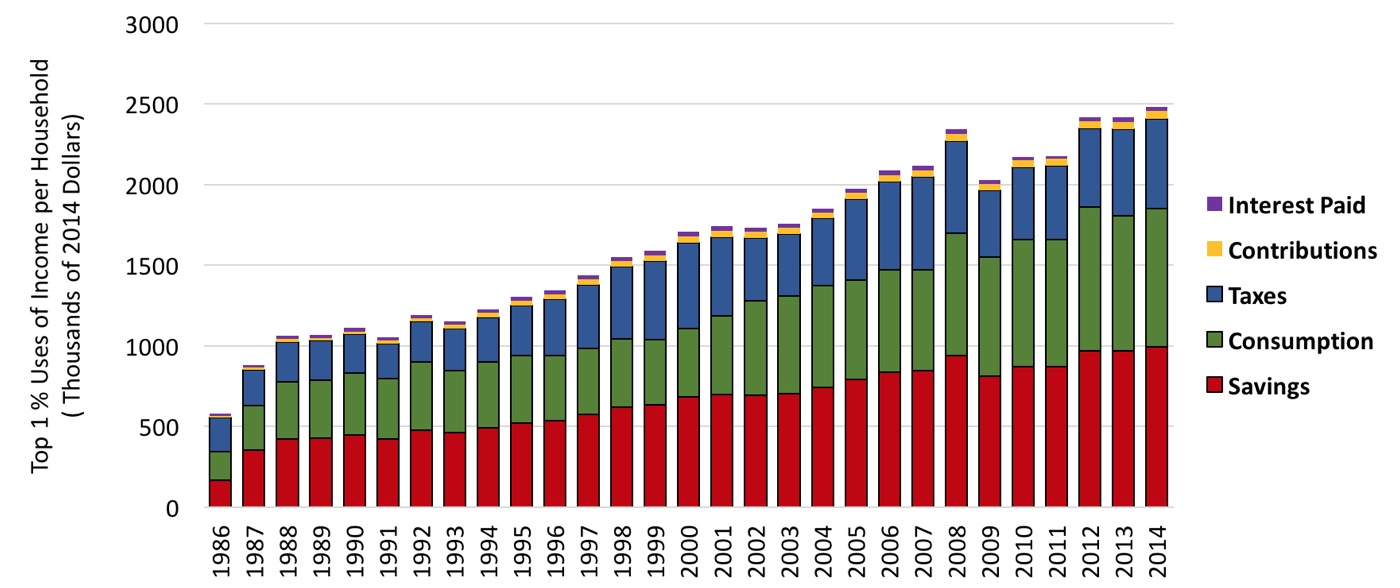
Saving of the top one percent is on the order of a trillion dollars per year. Their capital gains (formally recorded by the Federal Reserve) range a bit below half that level. After depreciation, high savings and capital gains flow into rich households’ net worth. Their share in total wealth was around 50% just prior to the Great Depression, then fell to 25% in the 1960s. By 1980, the New Deal’s progressive taxes had been defanged and a stagnant stock market began a long upswing, boosting the share to 40%.5 The top enjoyed rising net worth while the rest of the population got left behind.
How Trump-Style Policies Will Deepen the “American carnage”
How would a Trump program along the lines of his and the House’s proposals affect rich households? The obvious answer is “very favorably.” Because capital and wealth change slowly over time, some sort of economic growth model is needed to provide numbers. The one we used has four key characteristics.
- Medium-term business cycle oscillations are ignored. As opposed to most growth models output is (realistically) determined by aggregate demand, not the available supplies of labor and capital as in mainstream exercises. In line with econometrics, both economic activity and capital growth are assumed to respond positively to a higher profit share.6
- Model solutions track toward a “steady state” with all relevant variables growing exponentially at the same rate. Growth trajectories never quite reach this “attractor” or “center of gravitation” but economists pretend that the steady state represents the “long run.”
- All profit income is transferred to households by interest and dividend payments and capital gains. (This assumption is counter-factual. Over recent decades, such transfers or capital losses of business exceeded net profits.)
- The benchmark or baseline “balanced growth” simulation assumes that real wage growth equals labor productivity growth, which is pegged at 1.4% per year. (Again counter-factual: the benchmark holds the share of wages in income constant, when in fact it fell by around five percentage points after 1980).
We examine how variables shift from balanced growth in various scenarios. Current discussion involves policy changes in a range of one trillion dollars over ten years. With US aggregate demand (household and government consumption of goods and services, investment, and exports) approaching twenty trillion dollars, one hundred billion per year is not going to perturb the system very much. Larger changes have to involve cumulative effects over the years.
Upper range estimates for Trump’s and Congress’s proposed economic interventions include the following three items:7
- Reduce government spending on current and capital spending by $200 billion per year from a total of $3.2 trillion, decapitating discretionary outlays and boosting defense.
- Cut transfers (mostly Medicaid) by $200 billion from a total of $2.5 trillion.
- Remove taxes of $500 billion from a total of $700 billion for the top one percent and $200 billion for the middle class.
The impact of the first two moves would be to reduce aggregate demand, with the effect magnified by the fact that (at least according to available data) lower income households spend more income than they receive. Even though they have strongly positive saving, more income for the top one percent would boost their consumption.
Figure 4 shows how these interventions might play out over 40 years in comparison to the benchmark run, which shows a slowly rising GDP growth rate (panels a and b). Balanced growth Palma ratios are stable (panels c and d). Wealth becomes more concentrated (panels e and f). The top percentile’s benchmark wealth share rises above 50% — back to the Roaring Twenties a century later!
Figure 4: Trump policies vs. baseline
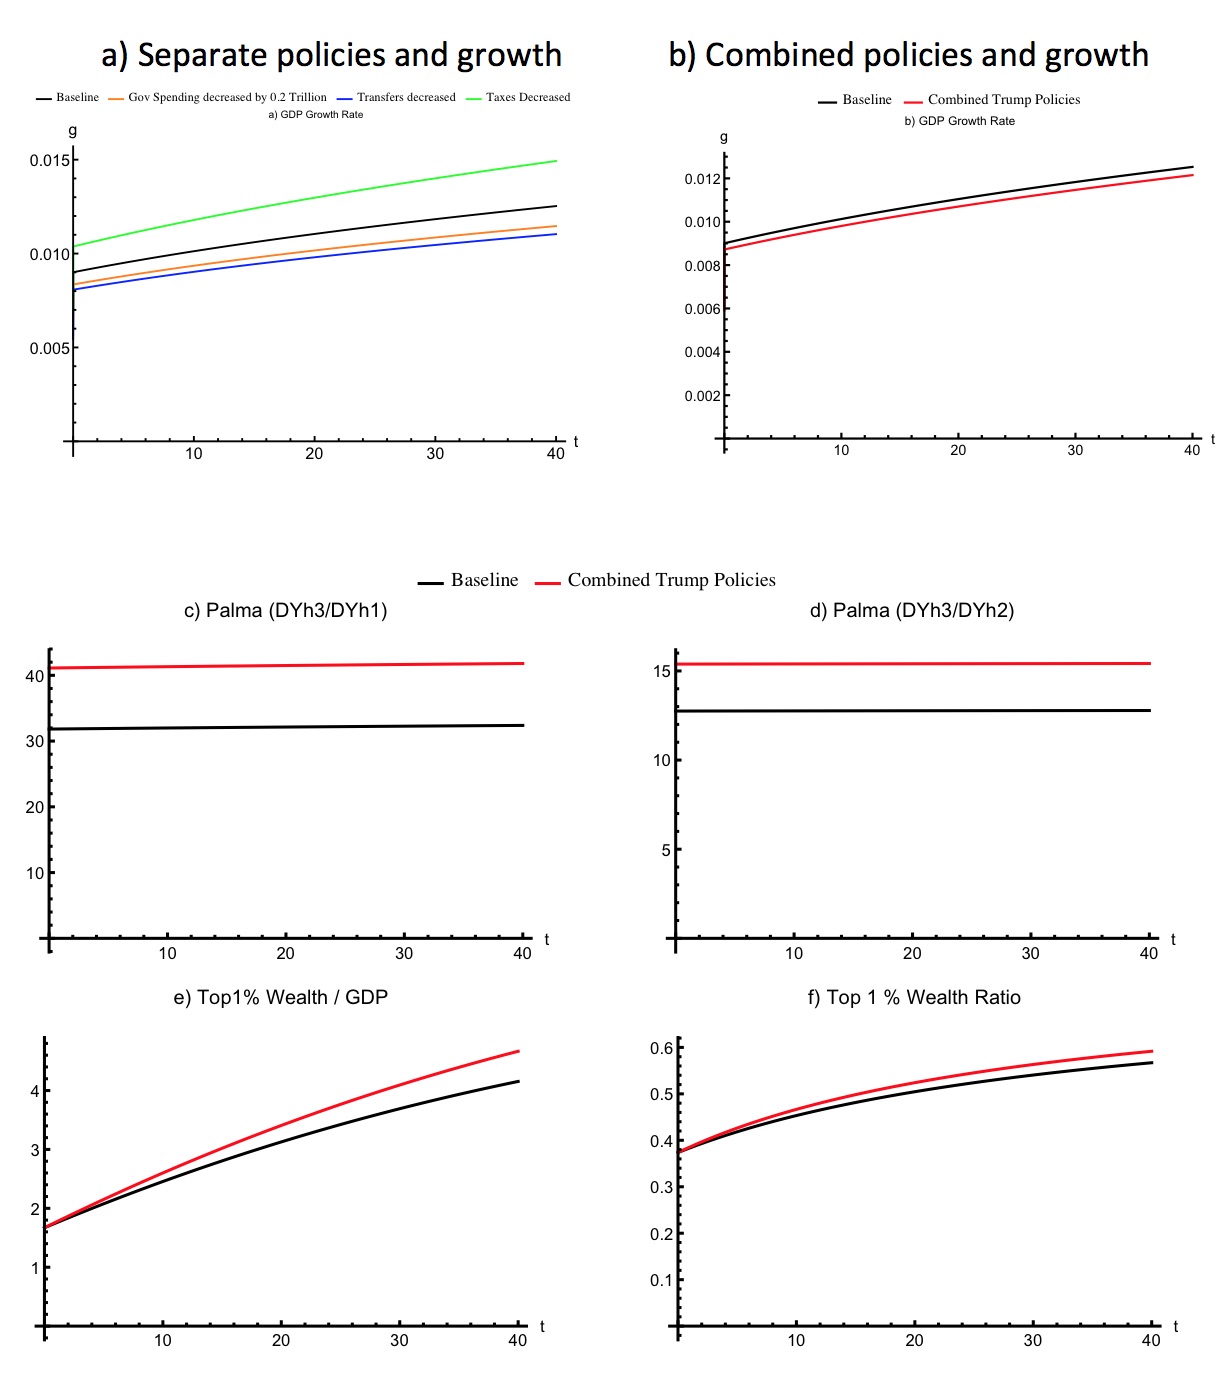
Trump-style policies would add insult to grave prior injury. Because they are in the hundred billion dollar range the effects on growth are visible but not huge (faster growth from the tax cuts, slower from the other two changes). The top households are strongly favored so Palmas jump and wealth becomes even more concentrated.
What About Prospects for a Progressive Alternative?
One-off progressive distributional initiatives have effects of similar magnitude but opposite sign. A ten percent wage increase for the bottom sixty percent of households, for example, would reduce the relevant Palma by a few points.8 To create large income and wealth changes over time as in Figure 1, cumulative distributional movements would be essential. Suppose, for example, that institutional changes deliver three key results.
Real wage growth is 1.75% per year for the bottom two household groups with zero growth for the top one percent. Shifting economic power from business toward labor would be essential to make these changes happen.
There is a one percent annual decrease in the coefficient tying rich proprietors’ incomes to output. Tax reform would be needed to assure this result.
Similarly, there is a one percent annual decrease in the coefficient relating financial transfers to the upper one percent to profits, i.e. firms invest more and distribute less.
These numbers are arbitrary, but illustrative. Over 40 years, such changes would reduce disposable income Palmas by about 50%, more or less reversing the trends in Figure 1. Their effect on wealth, however, would be minimal.
Owners of wealth maintain their positions because their large stocks of assets generate big capital gains along with interest and dividend payments from which their saving rate is high. A public wealth fund could become an alternative vehicle for accumulation. Perhaps the best-known proposal is still the one put forward 65 years ago by the Swedish trade union economists Gösta Rehn and Rudolf Meidner, who wanted to extract money from firms to support workers’ pensions .9 An American version might be financed by a 50% tax on capital gains. It could transfer two percent of its assets each year to households with low incomes. The transfer would mimic a guaranteed minimum income, subject over time to asset price fluctuations.
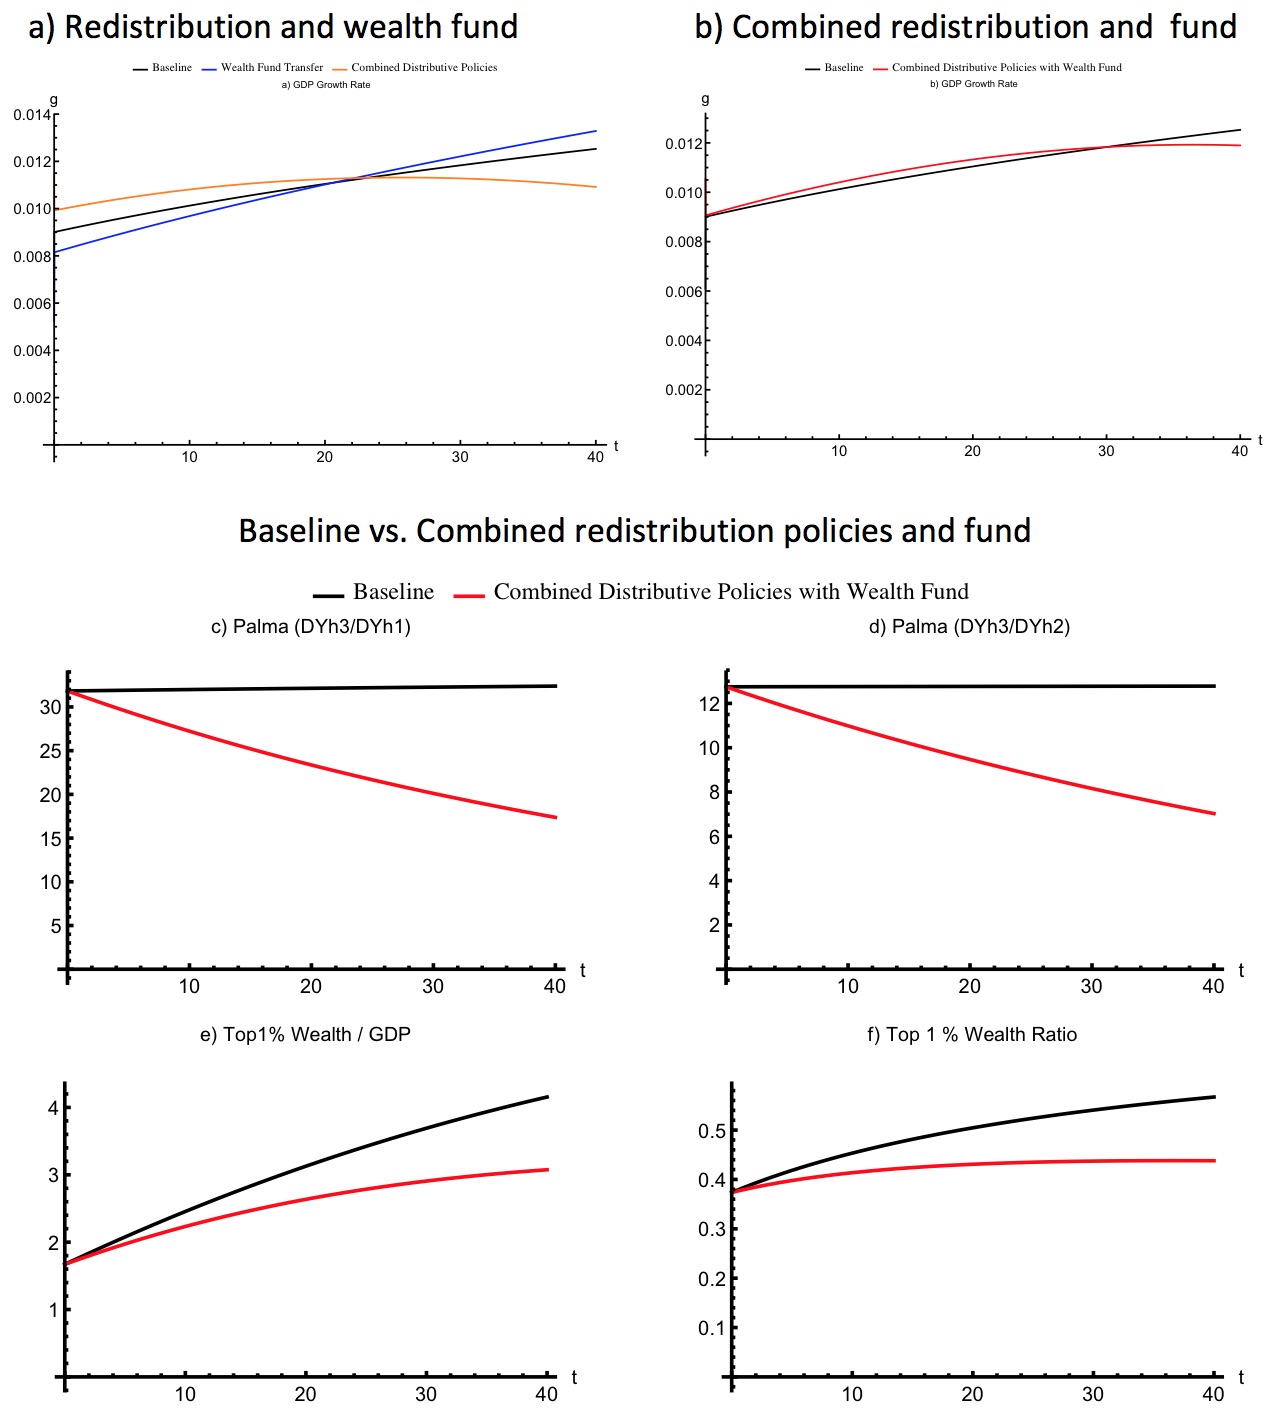
Figure 5 shows how the institutional changes mentioned above combined with a wealth fund affect the economy over time. Palma ratios steadily shift downward. With its high saving rate, an aggressive public fund could make a real dent in the concentration of wealth.
Figure 5: Baseline vs combined redistribution policies and wealth fund
It is by no means obvious that all these progressive changes could come into place. If not, and if Trump-style interventions materialize, the distributional mess will only get worse.
Final Word
Trump’s and the Congress’s budget and legislative proposals could only work for his “struggling families” and “forgotten people” if they would generate strong trickle-down growth. Structural constraints on income distribution and wealth dynamics won’t let trickle-down happen. His slogan about “America First” is for the top one percent of income distribution – effectively a “capitalist” class – not for “workers” in the middle of the income distribution or the struggling, forgotten households further down.
I have outlined a feasible progressive alternative, which would generate broad-based progress. Progressive changes may not take hold. If not, and if Trump-style interventions materialize, the distributional mess and “American carnage” will only get worse.
Notes
* Support from INET, comments by Thomas Ferguson and Servaas Storm, and super RA help from Özlem Ömer are gratefully acknowledged.
- Data on the size distribution of income 1986-2013 (extrapolated to 2014) came from the widely cited Congressional Budget Office study (https://www.cbo.gov/publication/51361). The Bureau of Economic Analysis (https://www.bea.gov/national/index.htm) provides the national accounts. Financial accounts (https://www.bea.gov/national/nipaweb/Ni_FedBeaSna/Index.asp) and the Bureau of Labor Statistics consumer expenditure survey (https://www.bls.gov/cex/) were also brought into the picture.
- Income concepts can be tricky. Labor compensation in the national accounts includes wages and salaries (even for CEOs), employer payments into pension and insurance programs, bonuses, and stock options – all presumably enter into costs of producing output. Capital gains due to asset price increases (for households) and offsetting losses (for firms) on equity and real estate are not income in the sense of the national accounts. Nor are stock buybacks income. In the moment of the transaction, they are portfolio shifts in which firms run down cash to buy shares, and households sell the shares for that cash. All this accounting is internally consistent. Whether it adheres to common-sense understanding of “income” is another question.
- The increase in top end labor compensation is dissected by William Lazonick, “Labor in the 21st Century: The Top 0.1% and the Disappearing Middle Class,” https://www.ineteconomics.org/research/research-papers/labor-in-the-twenty-first-century-the-top-0-1-and-the-disappearing-middle-class.
- Access to capital income clearly sets the one percent apart from other households. Even the group between the 91st and 99th percentiles gets more than three-quarters of its income from employment and government transfers. In a recent New York Times column, the English commentator Richard V. Reeves, “Stop Pretending You’re Not Rich,” https://www.nytimes.com/2017/06/10/opinion/sunday/stop-pretending-youre-not-rich.html?emc=eta1&_r=0 argues that social position favors the upper classes. That is surely the case but from the days before Jane Austen safe income from assets probably matters more.
- See Emmanuel Saez and Gabriel Zucman, “Wealth Inequality in the United States Since 1913: Evidence from Capitalized Income Tax Data,” https://gabriel-zucman.eu/files/SaezZucman2014.pdf
- Nelson H. Barbosa-Filho and Lance Taylor (2006) “Distributive and Demand Cycles in the U.S. Economy – A Structuralist Goodwin Model, Metroeconomica, 57: 389-411
- Steven Rattner, “Trump’s Budget Cuts? More Like Radical Surgery,” https://www.nytimes.com/2017/05/31/opinion/trump-budget-cuts-medicaid-taxes.html
- For similar results, see William G. Gale, Melissa S. Kearney, and Peter R. Orzag “Would a Significant Increase in the Top Income Tax Rate Substantially Alter Income Inequality?” http://www.brookings.edu/~/media/research/files/papers/2015/09/28-taxes-inequality/would-top-income-tax-alter-income-inequality.pdf
- For a good description, see Robin Blackburn, “A Visionary Pragmatist,” Counterpunch, December 22, 2005, http://http://www.counterpunch.org/2005/12/22/a-visonary-pragmatist/


Given this:
http://federal-budget.insidegov.com/l/119/2016
and this:
http://moslereconomics.com/2017/06/17/credit-check-28/
We are currently or are about to be in a recession, with our government currently telling us we are at full employment and that the economy is doing fine. How long will the slow crash need to continue before people are fed up? Do we need 50% youth unemployment like Greece?
It is every banker for themselves … 16 trillion in life preservers last time … the people in steerage have yet to pay their debt to the plutocrats.
I live in Ohio. The answer to your first question is, people already were fed up enough to vote for Trump, and the answer to your second question is “Obviously.”
In my state, we have two epidemics raging in response: opioid overdose deaths among rural and suburban populations; and lethal gun battles with great “collateral damage” in the inner cities.
Yesterday I attended a demonstration against threatened Medicaid cuts. The demonstrators were almost all white, in their 80’s and 90’s, propped up in their wheelchairs, many with oxygen tanks. The venue? The parking lot of one of our priciest nursing homes. The residents have either out-lived their money, or their adult children have thoughtfully relieved them of it. Nevertheless, it was a terrible sight.
Agreed. We have Trump because people were fed up and he was the only option and/or he totally outclassed all other options in terms of selling snake oil to rubes.
Whatever Trump’s intentions may have been, he is the head of a party that bears 50% of the responsibility for the state we find ourselves in currently and they show little interest in changing the policy landscape that has benefited them and their donor class so handsomely.
That whole Medicaid scam of children impoverishing their parents in order to quality for nursing home benefits so they can receive their “owed” inheritance just infuriates me.
Having a shitty system without single payer creates that. Blame the policy not the people trying to do the best they can in a horribly corrupt system. It isn’t the 1% doing that, It’s the next 20%.
> That whole Medicaid scam of children impoverishing their parents in order to quality for nursing home benefits so they can receive their “owed” inheritance just infuriates me
I have to say I don’t see it this way. (Yes, it’s a scam, but forced on us by the insanity of our health care system, not by children with bad attitudes.)
First, I think it’s misplaced to even think of a family home as a financial asset, so the question of a “impoverishing” doesn’t arise. Who cares what name is on the papers, as long as the parents get to live there?
Second, without such a “scam” being operated by my own parents, I wouldn’t have a place they can carry me out from feet first today (nor would other family members).
Sorry but I do consider it a scam that adult children disperse their parents assets in order to qualify for Medicaid nursing home benefits. That’s just greed. It’s not the taxpayers job to preserve inheritances. There’s a difference between a safety net and greed mongering. If your parents choose to give you money that’s their deal. You shouldn’t get to foist off their medical care onto the taxpayers so you get to keep their assets.
You are absolutely right. Far better that the State takes the money and instead pisses it away in the Middle East protecting our freedoms.
Let’s face it, the system is the basis of this sort of economic defense, not evil children.
Maybe if everyone received the same level of wages and benefits as our Congressman and Senators and Corporate CEOs running the system, then this sort of thing would not be necessary.
Oh yes. Our experience with Phyls’ parents being “warehoused” by their wealthier children, (we were the holdouts, and outvoted,) has shaped our determination to have Phyl spend her final days here at home.
The deconstruction of multi-generational family homes is one of the more egregious results of the Neo-Liberal Dispensation.
From the post:
“Although they enjoy substantial labor payments, the top one percent households mainly rely on property income. Members of the middle class get 80% of their income from compensation for employment and government transfers. Over recent decades, households in the bottom group received 40% to 50% of their income from employment and 30% to 40% from transfers….”
The ability to easily use the Internet, layered onto shell corporations, tax havens, and ‘globalization’, has enabled financial capital to pollute the social and economic environments with seemingly endless EB-5 visas — and rapidly escalating foreign ownership of property — in a fashion that would make the Sorcerer’s Apprentice blush.
An ‘average’ salary simply cannot escalate at the rate that property surges (whether it is stock, real estate, intellectual property). Meanwhile, government continues to be the lackey of hucksters for financial capital, such as hedge funds and TBTF banks.
In a world where billions can now copy+paste to create multiple copies of just about anything, download eBooks, stream video, and Skype meetings, how is it possible that policy makers have failed to recognize that applying outdated rules about ‘capital’ — deriving from the era of schooners and steel mills — creates Sorcerer’s Apprentice-like economic and environmental disasters?
Ah. Now I remember: ‘capital’ has bought up the very politicians, judges, and lawyers who create, enable, protect, and perpetuate all these 17th century notions about the exalted, fetishized notions of ‘financial capital’.
Wonderful post. Thanks, NC!
Asset appreciation for me, inflation for you!
So, so true.
In 2006, the U.S. Treasury’s Financial Crimes Enforcement Network recognized four states (Delaware, Nevada, Wyoming and Oregon) are “particularly appealing for the formation of shell companies.” Delaware falls in the group offering the least transparency. The other three states fall in the group offering a moderate level of transparency. https://www.fincen.gov/news/testimony/statement-associate-director-regulatory-policy-and-programs-jamal-el-hindi-financial
Global Witness, a nonprofit dedicated to fighting financial fraud, calls
Oregon the ‘Delaware of the West.’ The Tax Justice Network believes
knowing who owns a corporation is crucial to fighting financial fraud.
So what has Oregon done to address this?
Not much.
Jeanne Atkins, interim Secretary of State, proposed aggressive legislation. http://www.kgw.com/money/business/shell-company-legislation-awaits-oregon-lawmakers/395103591
The Democratic Party was lackluster in supporting the Democratic candidate for Secretary of State, Brad Avakian. Dennis Richardson was elected as the first R SOS in more than 3 decades. So much for Atkins’ bills, who hoped her successor would carry them forward.
The House Committee On Business and Labor held a hearing to address shell companies with HB 2191, but big business got the most important part of that bill (identifying information for each of corporation’s or limited liability company’s beneficial owners) stripped.
In the meantime, commercial real estate is flipping in downtown Portland, with bubble pricing. To the glee of these new owners, Oregon has property tax limitations that mean that these buildings are assessed at a fraction of the “real” market value. Forget pothole repairs!
Case in point, the iconic Big Pink building has recently changed hands 2 times in the past decade. According to Wikipedia, in August 2006, a majority stake in the building was purchased by “institutional investors advised by JPMorgan Asset Management” for a price of $286 million. In TPF Equity REIT, majority-owned by UBS, bought it for $372.5 million in 2015.
These fat cats are probably saving well over $3M annually in taxes with our property tax limitations.
http://vance.co.multnomah.or.us/cgi-bin/tax-page?R496363
http://vance.co.multnomah.or.us/cgi-bin/tax-page?R496362
And who knows what’s happening with all their profits? The jurisdiction for 111 SW 5TH AVENUE INVESTORS, an FLLC registered in Oregon, is…
Delaware.
Still waiting for Mr. Lee’s Greater Hong Kong.
Not to be prescriptive for the Tribes, since I don’t stand in their shoes, but I don’t know why they, as sovereigns, went into casinos when they could have gone into banking. Or citizenship.
Good post. My only argument is that these aren’t really “Trump-Style” Policies. Let’s stay in reality and call a spade, a spade: These are full-on REPUBLICAN Policies. Full Stop.
I get irritatable when I see this all laid at Trump’s feet. No love lost on my part on Trump, as I always knew this would be the outcome, as he & his family looted as much as possible.
But nothing I’ve seen so far convinces me that almost anything has anything to do with Trump. It’s all unfettered Republican policies, same as it ever was.
If anything, Trump occassionally puts in his oar to minimize some of the damage to the 99%. Of course, Trump is ALL IN on these policies, but it’s not like Trump came up with them. Please. Let’s get real.
Exactly, although I would also add that Democrats have embraced many of the policies, only with a softer face.
Please see Thomas Franks’ Listen Liberal: Whatever Happened to the Party of the People? for the extraordinary history of Democratic betrayals of their historic (FDR) constituencies.
Examples:
(Nixon opponent) Edmund Muskie proposes austerity in the ’70s.
Jimmy Carter deregulates (air lines, trucking) to the detriment of labor and the Teamsters endorse Reagan.
In addition to the financial deregulation that made the Great Recession possible, and the surplus that made it necessary, Clinton ends “welfare as we know it,” colluding with Newt’s congress.
Before this, 76% of those needing public assistance got it. After: 26%. So much for D’s as the party of the poor.
Then, there’s Obama, the prototype for empty suits. No prosecution of Bush / Cheney war crimes (though plenty of prosecutions of whistleblowers) and none for Wall Street’s frauds. Still germane: Who got the benefit of the recovery?
Eagles are also predators, and they signify the USA.
The Thomas Frank book is truly excellent, should be mandatory reading for literally everyone, in particular long-time Democrat supporters. Just because Republicans are Satan doesn’t mean the Dems (and certainly not the Clintons) are angels by default.
As Adam said, one of the most powerful points made in the book was that Obama didn’t punish the banks after 2008 not because he couldn’t or was hamstrung by awful Repubs…. it was because his administration totally didn’t want to. They LOVED the bankers, positively worshipped them. The modern Dems were never, ever going to hold the bankers to account for what they did to the world. No wonder poor bloody normal Americans feel so without a voice – they have literally no-one to stand up for them (aside from Sanders perhaps).
I agree 100% about the liberal betrayals described in Thomas Frank’s book. But there’s a lot more to the story, and you can find part of it in another book by Thomas Frank, The Wrecking Crew: How Conservatives Ruined Government, Enriched Themselves, and Beggared the Nation.
The Republicans really are worse than the Democrats.
Also see how people’s perceptions have been twisted by right wing propagandists in Dark Money: The Hidden History of the Billionaires Behind the Rise of the Radical Right, by Jane Mayer, and Invisible Hands: The Businessmen’s Crusade Against the New Deal, by Kim Phillips-Fein. Only the first quarter of the latter book is about the period of the New Deal; the remainder of the book is about activities to repeal aspects of the New Deal over the following half century.
Mind if I try to tie this and Gaius Publius’ posts together?
>To borrow a metaphor from ecology, rich households are the top predators of the economic system,
We marvel at lions, tigers and bears (oh my!) — make movies about them, compare people we admire to them. But “top predators” are always the most fragile link in the chain, heck by their very description you realize that nobody really depends on them. They are more just something to be avoided.
I don’t think the rich will survive a catastrophe. Have they ever? They will make Hollywood movies about “enclaves” and such but once you can’t make Hollywood movies anymore you will shortly see the rich also disappear.
Again, I don’t want a catastrophe but I do know who to bet (but what to bet? not currency…) on if it really happens. The peasants will always be with us. They may well be us.
In the age of inequality, it’s such a hard problem.
US wealth distribution:
http://static5.businessinsider.com/image/557ef766ecad04fe50a257cd-960/screen shot 2015-06-15 at 11.28.56 am.png
Trump thinks lowering taxes on the wealthy will help.
That orange hair dye has rotted his brain.
I posit that the tax cuts aren’t really Trump’s idea at all, but he’s quite happy to push for them bc it will be a yuuuuuge benefit to himself (first and foremost) and to his family and their businesses (secondarily).
this is just Republican Trickle Down/Supply Side 101. Started with Reagan and still crazy after all these years. Republicans love this. They know it’s a massive benefit to the super wealthy that will never ever benefit anyone but themselves. Full stop.
This is so poorly edited as be quite unclear as to factual basis at times. A shame
https://www.cepweb.org/wp-content/uploads/2014/05/CEP_WP_Inflation_and_Income_Inequality.pdf
You can skip right to the conclusion of the above paper to discover that the lack of inflation and income equality are correlated in the developed world. While the authors don’t draw any conclusion as to cause and effect, it is clear that the concentration of wealth is an inflation killer. Without inflation there is no wage and pricing power and inequality explodes. That’s where we are today.
The greatest transfers of wealth in the history of the world, to the rich from the lower classes, have occurred in the last twenty years. They include the selloff of state assets in the breakup of the old Soviet Union, the Bush Tax Cuts, the Great Recession Bailout, Central Banks Asset Purchases (QE), and the soon to be realized Trump Tax Cuts. In the meantime, inflation along with interest rates have crashed from around 7% to below 2%.
The article by Taylor above also concludes that inflation will take a dive as inequality increases due to many factors including big cuts to government spending.
Technology and globalization are also driving deflation as price discovery creates a very competitive environment for all categories of goods.
Rather than offset this effect, Trump’s tax cuts will pile on inequality thus driving down inflation and growth, the only two ways to escape the cycle.
You can argue this, but one thing Trump is doing is catering to the bottomless greed and hubris of the 0.1%. Not just its wealth. In doing this, he is stupid, but for purposes of revolution this is a diamond in the rough.
One thing this analysis doesn’t do is determine the degree of fury that will be stimulated if inequality is FURTHER exacerbated. Fury is good. It would be good to measure it. Especially when it starts coming from people who have hitherto been able to turn a blind eye to the lower middle class, workers and the poor.
However, one thing the left needs to do is learn how to ride the horse of disaster capitalism.
Worse off post Obama. I want answers from big government, its my job.