By Thomas Piketty, Professor, Paris School of Economics and CEPR, Li Yang, Consultant, World Bank; Invited professor, Paris School of Economics, and Gabriel Zucman, Assistant professor, UC Berkeley. Originally published at VoxEU.
Between 1978 and 2015, China moved from a poor, underdeveloped country to the world’s leading emerging economy. Despite the decline in its share of world population, China’s share of world GDP increased from less than 3% in 1978 to about 20% by 2015 (Figure 1). According to official statistics, real national income per adult grew more than eightfold between 1978 and 2015. While the average national income per adult was approximately €120 per month in 1978 (expressed in 2015 euros), it exceeded €1,000 per month in 2015 (Figure 2).1
Figure 1 China’s share in world population and GDP, 1978-2015
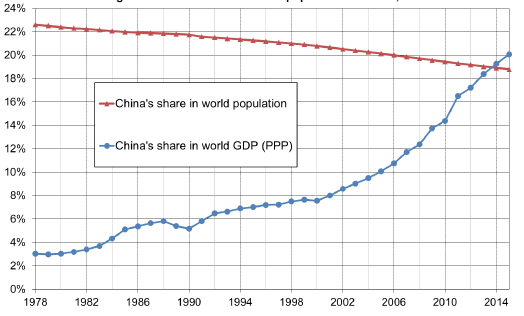
Figure 2 The rise of per adult real national income in China, 1978-2015
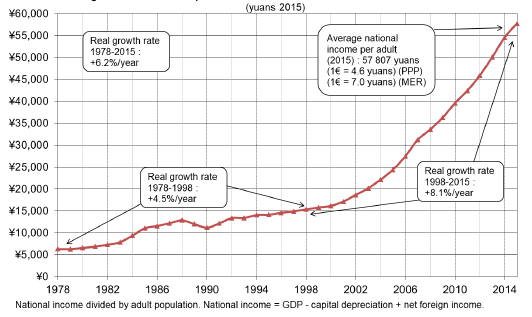
Note: National income divided by adult population. National income = capital depreciation + net foreign income.
However, relatively little is known about how the distribution of income and wealth within China changed over this critical period. That is, we do not have consistent estimates of the extent to which the different income and wealth groups have benefited (or not) from the enormous macroeconomic growth. The household surveys that are used to study distributional issues in China (e.g. Piketty and Qian 2009) suffer from massive under-reporting, particularly at the top of the distribution, and are typically not consistent with the data sources that are used to measure macro growth (namely, national accounts). This is an issue of tremendous importance not only for China and its future development path, but also for the rest of the world and the social sustainability of globalisation.
Wealth Accumulation (1978-2015)
In the current research, we combine official and non-official sources (including independent estimates of China’s balance sheets)2 to provide the first systematic estimates of the level and structure of China’s national wealth since the beginning of the market reform process. We find that the national wealth-income ratio increased from 350% in 1978 to 700% in 2015. This increase was mainly driven by the increase of private wealth, which increased from 115% to 487% of national income during the same period (Figure 3).
Figure 3 Public versus private property in China, 1978-2015 (% national income)
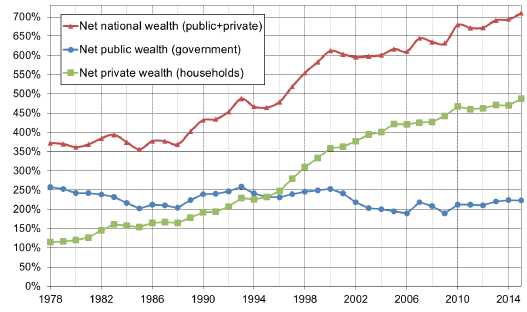
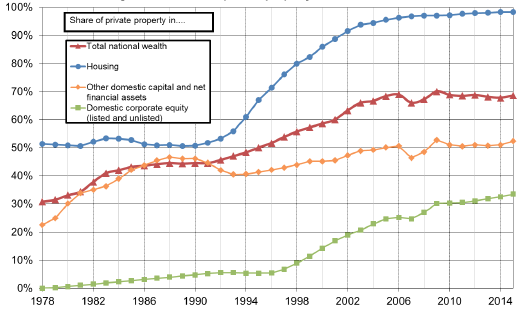
The share of public property in national wealth declined from about 70% in 1978 to about 30% in 2015. More than 95% of the housing stock is now owned by private households, as compared to about 50% in 1978. Chinese corporations, however, are still predominantly publicly owned: close to 60% of Chinese equities belong to the government (with a small but significant rebound since 2009), 30% to private Chinese owners, and 10% to foreigners – less than in the US, and much less than in Europe (Figure 4).
Figure 4 The rise of private property in China, 1978-2015
In brief: China moved a long way toward private property between 1978 and 2015, but its property regime is still markedly different than in other parts of the world. China has ceased to be communist, but is not entirely capitalist; it should rather be viewed as a mixed economy with a strong public ownership component. In effect, the share of public property in China today (30%) is higher than in the West during the mixed economy regime of the post-WW2 decades (around 15%-25%), but not hugely so. And while the share of public property in national wealth has declined to 0%, or even less than 0%, in Western countries (with public debt exceeding public assets in the US, UK, Japan, and Italy today), the public’s share of national wealth in China seems to have strengthened since the 2008 financial crisis. These findings are not completely unexpected, but we feel that it is important to be able to put numbers on these evolutions.
Income Inequality (1978-2015)
By combining recently released tax statistics on high-income individuals with household surveys and national account data, we can provide new estimates of income inequality (Piketty et al. 2017). To our knowledge, this represents the first attempt to use tax data on high earners to correct inequality statistics in China.3 An income tax has been in place in China since 1980, but until recently no detailed income tax data were available, and scholars therefore had to rely on household surveys based upon self-reported information. In 2006, the Chinese tax administration began to release data on the numbers of high-income individuals (i.e. with individual taxable income above RMB120 000 per annum, equivalent to €11,988) and their incomes.
We should make it clear that these data are highly imperfect; our revised estimates might well under-estimate inequality and our top income shares should be viewed as lower bounds. What is interesting, however, is that even these lower bounds are already a lot larger than official survey-based estimates. For recent years, we find the income share of the top 10% to be around 41% of total national income (as opposed to the 31% suggested by surveys), and the income share of the top 1% to be approximately 14% of national income (as opposed to 7% suggested by surveys). According to our series, the share of national income going to the top 10% rose from 27% to 41% between 1978 and 2015, while the share for the bottom 50% fell from 27% to 15%. The urban-rural income gap increased, but income concentration also rose significantly within both urban and rural China (Figure 5).
Figure 5 Income inequality in China: Corrected versus raw estimates
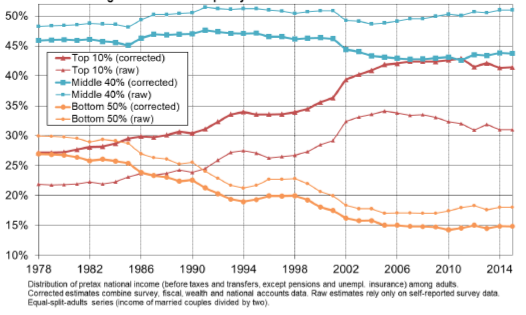
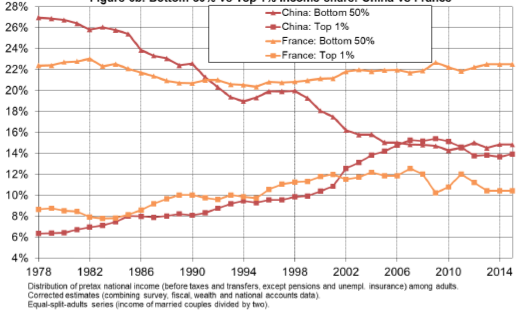
To summarise, the level of inequality in China in the late 1970s used to be less than the European average – closer to those observed in the most egalitarian Nordic countries – but it is now approaching a level that is almost comparable with the US. The bottom 50% in China earn approximately 15% of total national income versus 12% in the US and 22% in France; while the top 1% earns about 15% of national income, versus 20% in the US and 10% in France (Figures 6a and 6b).
Figure 6a Bottom 50% versus top 1% income share: China versus US
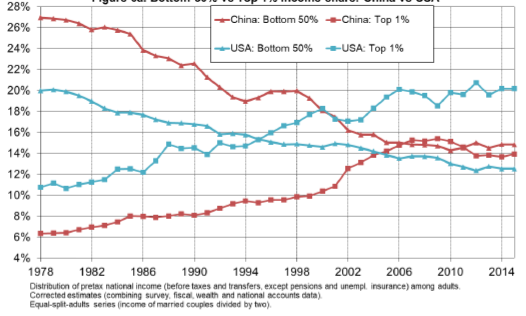
Figure 6b Bottom 50% versus top 1% income share: China versus France
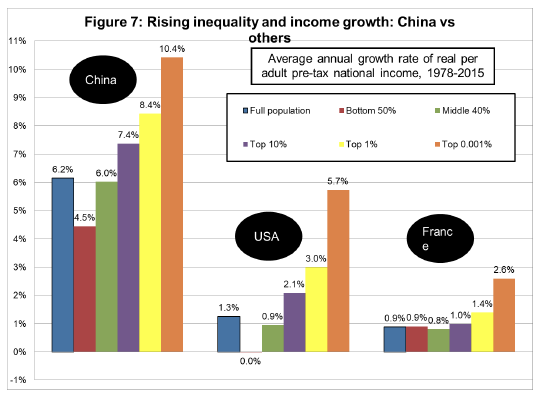
Comparing the average annual growth rate of real per adult pre-tax national income for different income groups in China, the US and France from 1978-2015 (as shown in Figure 7), the top 1% of the income distribution experienced a growth rate of 8.4% in China, 3.0% in the US, and 1.4% in France. However, the average annual growth rates for the bottom 50% in China and the US are significantly lower at 4.5% and 0%, respectively, while the same figure was 0.9% in France. For the time being, China’s development model appears to be more egalitarian than that of the US, but less so than those in European countries.
Figure 7 Rising inequality and income growth: China versus others
Although our new series on income and wealth in China are more homogenous and comparable than previous attempts, we stress that they still have the potential to be improved as new data sources become available and better methods are designed.4 All the series presented in this column are available online on the World Wealth and Income Database (WID.world); updated series will be posted there. Our paper is part of a broader international project aimed at producing Distributional National Accounts, which combine national accounts, survey, and tax data in a systematic manner to produce inequality estimates that are homogenous and comparable across countries.5
Endnotes
[1] Annual per adult national income rose from less than 6,500 yuan in 1978 to over 57,800 yuan in 2015, i.e. from about €1,400in 1978 to about €12,500in 2015 (these amounts are expressed in 2015 yuan and euros using the latest purchasing power parity estimates).
[2] See, for example, Yang et al. (2013a, 2013b, 2015), Ma et al. (2012), and Cao et al. (2012).
[3] Previous work on income inequality in China was almost entirely based upon household surveys; see, for example, Piketty and Qian (2009), Benjamin et al. (2005, 2008), Chi et al. (2011), Chi (2012), Gustafsson et al. (2008a, 2008b), Khan and Riskin (2008, 2005), Knight et al. (2016), Knight (2014), Li et al. (2013), and Xie et al. (2015, 2013).
[4] Hong Kong and Macao are excluded from our data—both from the national accounts and from the household surveys, income tax returns, and wealth rankings. This could lead us to underestimate the rise of inequality, and this should be taken into account in future research.
[5] Piketty, Saez and Zucman (2016) construct distributional national accounts for the United States, and Garbinti, Goupille and Piketty (2016, 2017) for France. These and the present Chinese series all follow the same guidelines (see Alvaredo et al., 2016). New and updated series will be regularly made available on-line on the World Wealth and Income Database (WID.world).


If this data is primarily based on income tax sources, then it almost certainly grossly underestimates the wealth of high earners in China. Anyone with contact with China for some time have met people with apparently quite modest jobs, but with seemingly endless supplies of hard cash. Much of this money is of course driving property bubbles all along the Pacific Rim and elsewhere.
Yes. It is interesting to see high inequality and individual wealth achieved from a standing start when I assume nobody was wealthy. The opportunities for that seem limited to government, large corporations (mostly government-owned), and large-scale crime (requiring government connivance/corruption). The process has been much more discreet than the blatant post-Soviet looting but the results only slightly so.
“…but the results only slightly so”.
Unless you do not consider it significant that Chinese life expectancy is 5+ years longer than that of Russians’.
Thanks for that and, yes, I do consider it significant. Historical data on that is interesting too. What I found on Russia shows a big gender gap in life expectancy along with that dramatic post-Soviet dive. China, just steady progress like a real “rising tide”. Which is certainly preferable.
I wonder what Russian life expectancy was just before the breakup of USSR. I wonder how low it fell during the Clinton-Yeltsin years. I wonder how much it has come back up under the Putin recovery years. Also, I assume it is the men who have lower life expectancy than the women? And crashed deepest during the Clinton-Yelstin years?
China never did become a field of dreams for the Clintonites the way Russia did. So China never had a dramatic decay of life expectancy the way Russia did.
Russian life expectancy in Russia began to drop in the late 1980s and then dropped fast during the Yeltsin years (male life expectancy went as low as 58). During the Putin years it has been climbing and has now returned to the highest levels achieved during the Soviet era. This is one of the reasons Putin’s approval ratings remain in the high 80s. Americans simply cannot understand why the Russians seem so stupid as to support him.
They say the data are compiled from national accounts, survey, and tax data in a systematic manner as part of a large project. I think their effort has some more value than your anecdotal recollections.
Interestingly, after this very fast development, the result is a society in between the US and France with regards to inequality. This speaks volumes of the ability of communists planners to grow a capitalist economy. MMTers should study this case closely, probably try to own it for their ideology, I’m pretty sure there are many ways to make it look like Chinese communists planners are following an MMT program.
Well said Reuben.
I don’t understand why income and wealth statistics are not available to the authors. The Chinese system to inform itself of popular wishes is to hold endless surveys as you have mentioned. Every province continually sends team out to collect data and assess public mood. Its their alternative to democracy.
Summary: “Average National Income ” does not equal “Income Distribution”
QED, Commies are heartless.
Interesting factoid
1MDB’s Jho Low is one of China’s largest land owners and a substantial owner of the Chinese Steel industry, I don’t think the Malaysians or Indonesians even know it.
1MDB us a front for Communist/Islam alliance, a multi-foreign state bribery fund for buying off US politicians to kill the US economy with energy handicaps, and to promote criminal invasion and mass immigration into the United States.
1MDB is also a tool for looting treasuries of “Chump Nations”, the bribe donors as well as those states getting bribed to kill their own economy.
….and a tool for high end ho pussy.
China is being Madoff’d as I type, trillions in new debt, and tens of trillions in pollution and Healthcare liabilities.
I think that the contemporary PRC is a classic case of the “take-off” phase of modern industrial development, as described by W.W. Rostow.
One thing that PRC leaders did when they adopted capitalism was that they preserved the territorial integrity and strong central power of the state (e.g. Tiananmen Sq. crackdown).
It remains to be seen how well the PRC will cope with the standard set of contradictions which result from rapid industrial development (lopsided wealth distribution, environmental stress, sub-replacement fertility, etc.)
Regarded as a “cross each bridge as you come to it” approach, post-Mao PRC leaders haven’t done all that badly. Job #1 was to limit population growth–that box got ticked. Job #2 was to grow GDP through wage-suppressed export industry–that box got ticked.
Perhaps Job #3 will be to somehow place curbs on the behaviour of the arriviste upper class. Is the long-established spirit of Chinese nationalism strong enough to maintain some social discipline in the new upper class?
One disturbing trend has been the extent to which PRC is embracing automobile-related development. For one, I think this illustrates that the imitation of foreign models has remained naive. For another, it illustrates the degree to which the personal consumption tastes of the nouveaux riches will have lasting negative impacts on the whole society.
My only first-hand contact with the new PRC upper class has been in my home city of Vancouver, Canada. I don’t know whether the behaviours and attitudes of the expatriate Chinese upper class can be considered typical of those in the PRC..
We all live within an ongoing experiment in industrial development starting in the UK 275 years ago and now reaching China and India and which will spill on to Africa sometime. No one knows where we will end up, but it has been a bumpy ride and likely to continue to be so.