Lambert here: Readers may wish to look at the methodology. I’m unsure about the word “segregation” in the title. I mean, I’ve tried grits, and I don’t like them. Others may disfavor tuna casserole. Or mashed potatoes. Or a blazing hot tom yum. I’m sure there are real issues here — as aren’t there always around food? — but I’m not sure a “segregation” frame is the way to look at them. Note that I am for people from different cultures and food traditions eating together; it’s convivial, something the slow food movement recommends.
By Donald R. Davis, Ragnar Nurkse Professor of Economics, Columbia University, Jonathan Dingel, Assistant Professor of Economics at the University of Chicago Booth School of Business, Joan Monras, Assistant Porfessor of Economics at CEMFI, Eduardo Morales, and Assistant Professor of Economics, Princeton University. Originally published at VoxEU.
Smart devices and online activity generate a stream of data describing human behaviour in great detail. Social scientists can tap such data to examine previously unexplored topics. This column uses online restaurant reviews to measure consumption segregation. In New York City, restaurant consumption is considerably more racially integrated than residences. A substantial share of consumption segregation is attributable to the fact that consumers are less likely to visit restaurants in neighbourhoods with demographics unlike their own.
In many developed economies, racial and ethnic discrimination are illegal, yet there is still considerable segregation along these lines. For example, the US has prohibited racial discrimination in education, employment, and housing for decades, yet segregation in each of these domains remains a stubborn feature of modern America (Hellerstein and Neumark, 2008, Boustan, 2011). Racial discrimination in ‘public accommodations’ like hotels and restaurants is also illegal in many countries. In the US, such discrimination has been legally prohibited since the Civil Rights Act of 1964. However, we do not know the degree to which patrons of these businesses are racially segregated or integrated.
One reason consumption segregation is important is that interpersonal contact between people of different backgrounds can improve intergroup relations (Pettigrew and Tropp 2006). Casual contact in shared consumption spaces may form a “cosmopolitan canopy”, such that “a cognitive and cultural basis for trust is established that often leads to the emergence of more civil behaviour” (Anderson 2011).
The primary reason consumption segregation has gone unexamined is that standard data sources do not describe consumer behaviour in sufficient detail to measure such outcomes. Government consumption surveys describe households’ expenditures, but they typically do not identify the businesses patronised and do not cover enough households in a location to estimate segregation amongst them. A promising alternative is the increasing trail of ‘digital exhaust’ generated by individuals using online platforms and smart devices as part of their daily lives. These new data offer social scientists opportunities to observe dimensions of individual behaviour unseen by traditional methods. For example, individuals are comfortable using Google to search for content that they would be unlikely to reveal to a survey enumerator (Stephens-Davidowitz 2017). Spatial variation in the prevalence of Google searches for racial slurs has been shown to predict vote shares in US presidential elections (Stephens-Davidowitz 2014). Restaurant reviews posted on Yelp can reveal hygiene violations previously undetected by health authorities (Harrison et al 2014).
In recent research, we use business reviews posted by users of the website Yelp to study consumption segregation in New York City restaurants (Davis et al. 2017). While users of the website are not a representative sample of the population, their online activity provides rich details of their consumption patterns that are not available in other data sources. This allows us to describe how restaurant consumption depends on the characteristics of individuals, restaurants, and neighbourhoods and use our estimates to compute measures of consumption segregation. We find that restaurant consumption is considerably less segregated along racial and ethnic lines in New York City than residences are. As the body of digital exhaust grows, researchers will be able to measure segregation in other cities and other dimensions of economic life.
Consumption Segregation
We cannot say a priori whether segregation along demographic lines is greater in consumption or residences. The fact that individuals may move around the city for consumption purposes has an ambiguous effect relative to the racial segregation of residences. On one hand, if diverse consumers choose common destinations, this may mitigate the spatial separation of residences. On the other hand, demographic differences in tastes could cause individuals’ choices to diverge even further.
To study consumption segregation, we use data from Yelp users in New York City to estimate a discrete-choice model of the restaurant patronage decision. We allow consumers’ decisions to depend on spatial frictions (the transit time it takes to reach the restaurant from home or work), social frictions (demographic differences between the user’s home neighbourhood and the restaurant’s neighbourhood), and restaurant characteristics (cuisine, rating, price, etc.). Our estimates show that all three components are important for predicting behaviour. Consumers are more likely to patronise a restaurant when it is closer to them, when it is located in a neighbourhood with racial demographics similar to their own, and when the restaurant has a higher rating. These preference parameters are race-specific, so we also find that, for example, Asian users are more likely to patronise restaurants serving Asian cuisine.
Next, we compute measures of consumption segregation that would prevail if the entire residential population of New York City behaved according to our estimates. The map in Figure 1 illustrates our main results for three Manhattan neighbourhoods: Harlem, East Harlem, and the Upper East Side. Each dot on the map represents 5% of the residents or consumers in each census tract (delineated in the maps). The four colours represent four different demographic groups: Asian (red dots), black (blue), Hispanic (orange), and white (green). Panel A makes clear that residential segregation is relatively high in this part of Manhattan – Harlem residents are primarily black, East Harlem is heavily Hispanic, and the Upper East Side is overwhelmingly white.
Panel B shows the model-predicted racial composition of restaurant patrons in each tract. While there are still clear differences across neighbourhoods, consumption in Panel B is considerably more integrated than residences in Panel A. Individuals of different races and ethnicities are more likely to consume together in the same restaurant than to reside in the same census tract. For the city as a whole, we compute a ‘dissimilarity index’, a standard measure of segregation, for both consumption and residences. Consumption dissimilarity is about half the level of residential dissimilarity.
Figure 1 Residential and consumption segregation in three Manhattan communities
<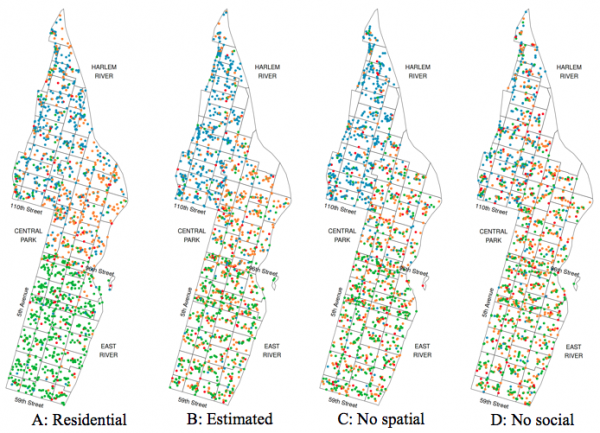
Notes: These maps depict community districts 8 (Upper East Side), 10 (Central Harlem), and 11 (East Harlem) in Manhattan. Each dot represents 5% of the tract’s residential population or predicted restaurant visitors. Asian residents or consumers are represented by red dots, black by blue, Hispanic by orange, and white by green. Panel A depicts residences; panel B depicts estimated consumption; panel C depicts consumption without spatial frictions; and panel D depicts consumption without social frictions.
Spatial frictions, social frictions, and gentrification
We illustrate the contributions of spatial and social frictions to the observed consumption segregation by predicting consumer behaviour in the absence of these frictions. Panel C shows consumption patterns when we wholly eliminate spatial frictions, making every restaurant in the city available to any resident without any travel time. Comparing panel C to B, there is a diminution of the degree of consumption segregation, but this change is relatively modest. Spatial frictions lead consumers to often choose restaurants near their residences, but consumption segregation is not simply inherited from residential segregation.
Panel D sets social frictions to zero (and spatial frictions at their estimated levels). It shows the pattern of consumption that would result if consumers considered transit time and restaurant characteristics when choosing their destination, but were unaffected by the racial and ethnic composition of the neighbourhood in which the restaurant is located. The result is considerably more integrated consumption in each of the neighbourhoods depicted in Figure 1. This substantial role for demographic differences in predicting consumers’ choices may reflect a number of mechanisms, such as preferences over residential demographics, a tendency to visit restaurants located near friends or family members who share the same race or ethnicity, or differences in information sets that co-vary with demographics. Regardless of the exact mechanism, we estimate that consumption dissimilarity for the city as a whole would be about one third lower if consumer behaviour did not respond to differences between the residential demographics of the restaurant tract and both the consumer’s individual identity and residential tract demographics.
The social frictions associated with demographic differences imply that gentrification could have consequences for incumbent residents’ welfare beyond those associated with changes in housing prices. We illustrate this by computing the expected utility of restaurant consumption for incumbent residents in low-income, majority-black neighbourhoods in current conditions and in a counterfactual in which surrounding neighbourhoods become high-income, majority-white areas. We find that incumbent residents would suffer welfare losses due to gentrification that are overwhelmingly due to increases in social frictions rather than changes in restaurant traits. These demographic changes presumably have consequences for dimensions of urban life beyond restaurant consumption.
Conclusions
Novel data allow economists to study dimensions of economic life previously undocumented. A particularly promising source is the ‘digital exhaust’ generated by the smart devices and online platforms that now accompany large swathes of human activity. These data describe individual behaviour at a much higher frequency and in much greater geographic detail than most traditional data sources. We use restaurant reviews posted to Yelp to study segregation of consumption along racial and ethnic lines in New York City. While this metropolis is distinctive in terms of its population density and diversity of restaurants, our paper provides a first look at consumption segregation and introduces a methodology that could be applied to studying consumption segregation in other cities, countries, and sectors.
References available at the original.


I’m missing the objective:
“We find that incumbent residents would suffer welfare losses due to gentrification that are overwhelmingly due to increases in social frictions rather than changes in restaurant traits.”
Different peoples prefer different food. My experience is what one eats as a child tends to be one’s preferred food. Would this make my Mother racist?
The methodology uses online restaurant reviews – not exactly the most objective source and it doesn’t really get at the why of it all. But social “scientists” in ivory towers do like to play with their data. I guess it beats going outside and talking to people.
Social “scientists,” or as Taleb would call them, the “IYI” (intellectual yet idiot) set.
Stuff like this to me is rather useless. Gathering data for the purposes of gathering data.
To me, almost all human activity is a function of people seeking to maximize their perceived self-interest. Be it gastronomic, economic, aesthetic, whatever. The measurement of consumption patterns is then intrinsically a waste of time in that people will quite obviously buy/consume what they like. And neighborhood X from demographic Y will probably like cuisine Z. I bet my cat could tell you that much.
No money/peer-review points to be gained making that simple and obvious point – hence, this sort of nonsensical foolishness gets backed on some level.
Hmmm. As always in U.S. life, no one talks about work. The Yelp data don’t account for time of day, given that Yelp reviews consist mainly either of raves or of whining. But in a large city like NYC or Chicago, you are likely to have distinct clienteles for lunch and for dinner. In fact, many restaurants open only for dinner, and there are traditional diners open only for breakfast and lunch. So the data are suspect for being voluntary responses and for not being “break-down-able” into meaningful categories related to kind of restaurant and time of day.
Also, we get into the usual nonsense of U.S. racial categories. So does Asian mean a Turkish-American who is eating pad thai at a Thai restaurant? Japanese-Americans going out for fessenjan at a Persian place for dinner? When I am at my company’s Mother Ship in downtown NYC, I eat lunch at a great Lebanese / Palestinian takeout place in the complex. Is that an Asian food experience?
My strongest impression is that the researchers were looking for free data on line, since all information wants to be free!, and they stumbled upon Yelp. I have a feeling that some of the delivery services and reservations platforms have better data, although none of these would be a randomized sample either.
This reminded me of my days as a young analyst visiting NY to meet with my Wall Street counterparts who rarely ventured outside the city except in a cab on a business trip. White people eat grits and bisquits and gravy. This is popular food in the South and parts of the Midwest. In fact, I see grits on the menu at many restaurants in Scottsdale. This study proves nothing.