By Wolf Richter, a San Francisco based executive, entrepreneur, start up specialist, and author, with extensive international work experience. Originally published at Wolf Street.
In the minutes of the FOMC meeting on June 12 and 13, released this afternoon, there was a doozie, obscured somewhat by the dynamics of the rate hike plus the indication that there would be two more rate hikes this year, for a total of four, up from three at the prior meeting, with more hikes to come in 2019, along with other changes – a phenomenon I called, This Fed Grows Relentlessly More Hawkish, Gone are the Kid Gloves.
But the doozie in the minutes was about the flattening “yield curve.”
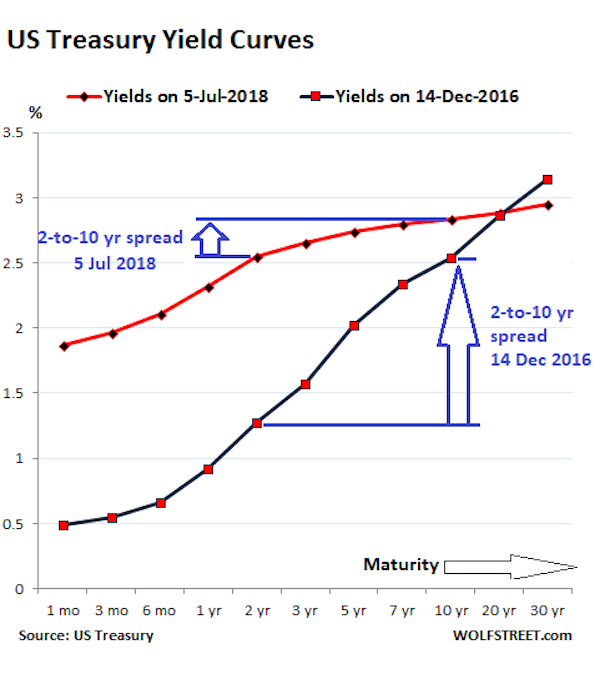
The yield curve is formed by Treasury yields of different maturities: normally, the two-year yield is quite a bit lower than the 10-year yield. Over the last several decades, each time the yield curve “inverted” – when the two-year yield ended up higher than the 10-year yield – a recession followed. The last time, the Financial Crisis followed.
So this has become a popular recession indicator that has cropped up a lot in the discussions of various Fed governors since last year. Today, the two-year yield closed at 2.55% and the 10-year yield at 2.84%. The spread between them was just 29 basis points, the lowest since before the Financial Crisis.
The chart below shows the yield curves on December 14, 2016, when the Fed got serious about raising rates (black line); and today (red line). Note how the red line has “flattened” between the two-year and the 10-year markers, and how the spread has narrowed to just 29 basis points:
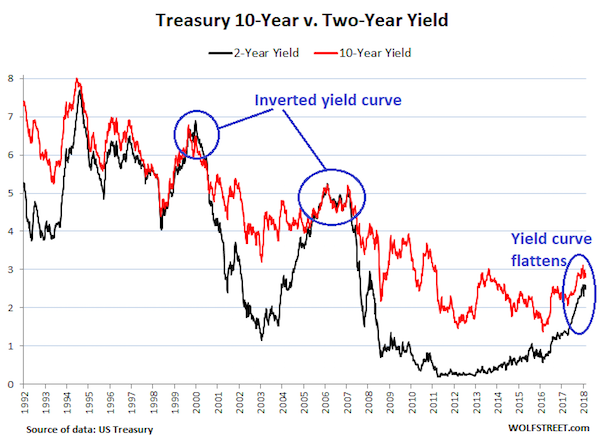
The chart below shows the two-year yield (black) and the 10-year yield (red) going back to 1992. Note how the spread has been narrowing in recent months (click to enlarge):
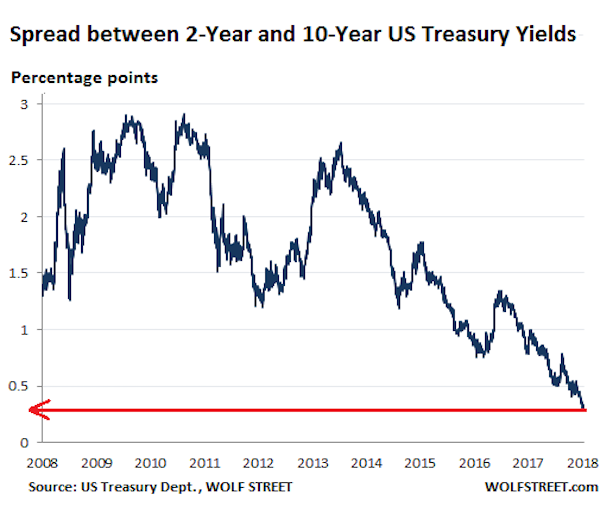
The chart below tracks this spread for every day back to 2008. Today, the spread, at just 29 basis points, is the lowest since before the Financial Crisis:
There has been a lot of handwringing about this being an indicator that the next recession is nearing and that the Fed should back off with its rate hikes.
But this Fed is getting seriously hawkish: In the minutes today, it revealed that instead of thinking about backing off with its rate hikes, it’s throwing out the flattening yield curve.
It explained what factors – in addition to the “gradual” rise in the federal funds rate, as per the Fed’s rate hikes – cause the yield curve to flatten that make it unreliable as a recession indicator:
- A “reduction in investors’ estimates of the longer-run neutral real interest rate”
- “Lower longer-term inflation expectations”
- “Lower level of term premiums in recent years relative to historical experience reflecting, in part, central bank asset purchases” – meaning that QE are artificially repressing long-term yields in relationship to shorter-term yields.
And according to “some participants,” these types of factors “might temper the reliability of the slope of the yield curve as an indicator of future economic activity,” the minutes said.
In other words, the Fed’s massive balance sheet, nine years of near-zero interest rate policy, and other factors might be distorting investors’ thinking. And this distorted thinking causes investors to pile into long-term Treasuries at these low yields, and thus push down these yields further.
Hence, the “information content” of the yield curve – the signals of a coming recession – might be distorted.
There was no consensus among FOMC members about the lack of “reliability” of the yield curve as a predictor, but there was a “staff presentation” about a new recession indicator to replace the yield curve:
This new indicator – rather than looking at the spread between longer-term yields of two years and 10 years – is looking at the spread between short-term yields. It’s “based on the spread between the current level of the federal funds rate and the expected federal funds rate several quarters ahead derived from futures market prices.”
The staff noted that this measure may be less affected by many of the factors that have contributed to the flattening of the yield curve, such as depressed term premiums at longer horizons.
This “staff presentation” took place during the meeting on June 12 or 13. On June 28, the Federal Reserve Board published a note that explained in greater detail why this new recession indicator would be superior to the yield curve.
The note by two staff economists, Eric Engstrom and Steven Sharpe, tracks the market’s expectations of the next rate cut, based on the logic that the Fed will cut rates when the next recession begins.
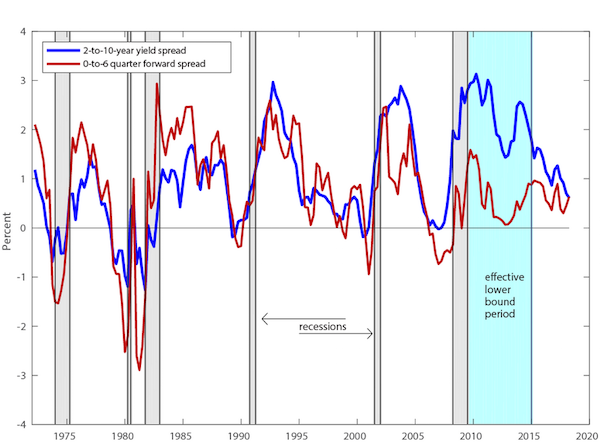
The note included the chart below that compares the “long-term spread model” (the yield curve, blue line) to the new “near-term spread model” (red line). It shows that the new model accurately predicted the last five recessions, similar to, but perhaps slightly better than, the yield curve. This occurs when the lines drop toward and below zero. The chart also shows that the spread of the new model is well within range of the past few years and pointing in the right direction (up), while the spread of the long-term yield curve is at the lowest point in 10 years and seriously pointing in the wrong direction (click to enlarge):
To convert this into an indication of recession probability expressed in percent, as the market sees it, the Fed economists offer the chart below (click to enlarge):

It shows how the yield curve (blue line) is indicating a rising probability of a recession – while, according to the new indicator, “the market is putting fairly low odds” on this scenario.
So just in the nick of time, with the spread between the two-year and the 10-year yields approaching zero, the Fed begins the process of throwing out that indicator and replacing it with a new indicator it came up with that doesn’t suffer from these distortions.
And I have to agree that the Fed’s gyrations over the past 10 years have distorted the markets, have muddled the calculations, have surgically removed “fundamentals” as a consideration for the markets, and have brainwashed the markets into believing that the Fed will always bail them out at the smallest dip. And the yield curve, reflecting all those distortions to some extent, might have become worthless as an indicator of anything other than those distortions.
There are no more excuses for the Fed. Read… Rate Hike Ammo


Is it any wonder why they call it ‘the dismal science’. Though I think science is objectively a misnomer.
To quote Rick Sanchez of Rick and Morty fame, “Science is more of an art than a science, Morty. A lot of people don’t get that.”
The Fed does bear some passing resemblance to the smartest man in the multi-verse, in that they both tinker with dangerous things until they accidentally screw up the world, at which point they make some intelligent sounding but lame excuses for their actions while they keep right on tinkering.
“WUBBA LUBBA DUBB DUBB!”
– the Fed
*belch*
Let’s get schwifty with the economy!
“The note by two staff economists, Eric Engstrom and Steven Sharpe, tracks the market’s expectations of the next rate cut, based on the logic that the Fed will cut rates when the next recession begins.”
What if the Fed doesn’t cut rates during the next recession? If it happens under Trump’s watch, he may refuse to lower rates as to him, it may be a sign of weakness and being in the wrong. I think that this is a possibility that should not be discounted.
Isn’t the Fed theoretically independent? Why then should they take cognizance of what the President, or, for that matter, any politician wants? The Feds behaviour over the last decade has demonstrated institutional capture in its’ purest form. Everything for the financial sector and nothing for the “Main Street” sector.
The Fed is carrying out a grand experiment. Do these ‘Quaint Quant Quotients’ have a measurable relationship to the ‘Real World’ or do they not? My criteria for how well this ‘realignment’ amongst the ‘Financial Stars’ works out is going to be the severity of the next “Recession.”
Good point but I would ask. Isn’t the President theoretically independent too? Maybe not. Remember how it came out that Obama’s 2008 Cabinet list was provided by Citigroup? I suppose that you could call that institutional capture as well. Not good either way.
Point well taken. The proposed “Institut d’ Obamique” to be housed in the Chicago School of Orientalist Studies being a Trailing Indicator thereof. Odalisques and oddsmakers, the Fed services the New Sublime Porte in so many ways.
(Odalisques you might well ask? Yes. It is a homage to the Patron of the Chicago School: Saint Ayn. Now there was a woman who understood the multifarious meanings of the word: ‘service.’)
To be fair, Obama himself was provided by Citigroup.
The President from Citigroup.
Bernanke asked that question, members spontaneously erupted into a Monty Python skit….
The money management was hived off some decades ago.
Which skit skippy?
There are so many appropriate ones to consider.
“Look on the Bright Side of Life?” “The economy’s full of s—, when you look at it…”
“The Economist Song?” “I’m an economist and I’m okay…”
“Miltons’ Political Philosophy Song?” (A target rich environment, that.)
“The Accountancy Shanty?” Stands proud, needing no ‘cooking’ to produce suitable yields.
“Hived off” evokes so much….
Nope
Care to expand on that?
Not the disheveled one Lambert, email would confirm, and I only use the lower case S due to auto fill for name.
Wonder who is using the Masculine Skippy for this and why only utter nope.
I think in my case its pretty clear considering the neoliberal period and the dominate money – IR views at the Fed along with Congresses views on distribution.
I guess a possibility is the Fed let’s the economy get really bad (not that we haven’t seen that recently even but it could be worse) in order to punish Trump. Yea but people are going to suffer and die in the next recession, they not only already do in recessions anyway, but there is literally no economic slack in most people’s lives anymore. Yea this whole economic system is screwy as can be, but if they produce mass unemployment we need a guaranteed income at that point just to keep people from dying.
Please jrs read about the broader ideological opinions of those that forwarded a UBI or GI, same mob wrt the Chicago plan.
“(Don’t Fear) the Yield Curve” is the title of the staff paper, riffing on “(Don’t Fear) the Reaper” by Blue Oyster Cult which evidently still exerts a powerful sway on the Fed’s balding eggheads 42 years on.
What distinguishes this model is its use of an interest rate dear to the hearts of economists but absent from bond market quotes: the forward rate. Or as the Blue Oyster Cult fanboys explain:
Not a big deal to calculate — so voracious is Big Gov’s appetite for borrowing as we approach the promised land of “trillion dollar deficits forever” that 2-year T-notes are auctioned monthly, meaning there’s always a handy pair of notes with maturities 18 and 21 months ahead whose yields can be used to derive the 6q7q forward rate for the long end of the spread.
The joke is likely to be on the Fed, though. As their chart shows, the 0-6q forward spread is volatile, and could well lurch down to meet the 2y10y spread any time. Moreover, despite the June 28th date on the staff paper, the chart is stale, showing a 0.5%-plus value for the 2y10y spread which last existed several months ago.
In other words, prepare to hoist the Fedsters on their own forward-rate petard.
From the WSJ’s Treasury page, the yield on a note due 12/31/2019 is 2.470%, while the 3/31/2020 note yields 2.511%. Yield on the current 3mo T-bill is 1.951%.
Doing a little exponential maff, we can derive a 6q7q forward rate of 2.76%, for a spread of 0.81% over the current 3mo T-bill. This compares to a 2y10y spread of only 0.28%.
So according to the Fed’s shiny new moved goalpost, there’s room for three more rate hikes, whereas the old goalpost would’ve allowed just one.
Carry on, lads …
If the policy is not supported by the understanding of the evidence, change the understanding.
Seems very reasonable. For witchcraft.
See — she floats = A Witch! Kill her.
See– she sinks = Not a witch. Dies.
Outcome — as desired.
aka: Tell the Boss what he wants to hear.
We’re gonna hold the Boss responsible with our own data. Here are the traditional 2y10y and new 6q7q fwd yield curves for 2018:
First one to hit the x-axis is the crack of doom.
Note that the two curves almost coincided on Feb 9th, and could do again one day soon. :-)
It is well within the Fed’s capabilities to sell Treasury and Agency bonds with maturities concentrated in the long end of the yield curve. Were the Fed to do that, particularly against a backdrop of deep corporate tax cuts and the resultant increased supply of Treasury debt, what is likely to happen to mortgage rates, real estate and collateral values?…
I suspect the people complaining loudest about this emergent Fed policy are those who have benefited most from both longtime negative real interest rates and a positively sloping yield curve. Those were lucrative monetary policy features for them over the past nine years.
One more note … in the Fed’s chart, the new 6q7q fwd spread dips below zero during the Russia/LTCM crisis in 1998, whereas the 2y10y spread didn’t.
So it’s not quite as reliable. When both go negative, it’s “game ovahhhhh …“
I am an economist
>Inhales herbes
The patient appears to be in most excellent health
>Ignores dreadful symptomes
>Eviscerates a bleating lamb
Yes, the patient is strong. I must bleed the patient to remove any vapours
> Pokes the viscera of the lamb using a stick with a dead rat tied to it
Patient is fit and ready to return to building hedgerows
>Chants in Latin for several minutes
>Inhales herbes
I am an economist
I have long been annoyed by the way Fed staff / hobbyists blithely treat the yield curve as just another “indicator”, as if they were forecasting the weather from changes in barometric pressure or temperature.
Seeking a forecasting crystal in a calculated “forward” rate, supposedly mirroring “expectations” of (a representative?) investors reflects a world view that imagines economic actors confidently act on expectations that they believe will be fulfilled. It is not taking uncertainty seriously.
The yield curve has worked not thru magic, but because it reflects a fundamental mechanism of sorts that drives credit and the transformation of maturities: that some key institutions borrow short and lend long, to coin a phrase, in the creation of credit that typically drives the expansion of business activity. Inverting the yield curve forces the contraction of credit by institutions that hedge a borrow short, lend long strategy with Treasuries.
It probably is not lost on those with a memory of past cycles that speculation about whether things will be different this time with regard to the yield curve qua indicator emerges regularly from Fed hobbyshops near the end of very long expansions. If memory serves the Cleveland Fed research shop circulated such speculation in the 2005-7 period.
Tough to ween an entire community off its generational addiction to financial heroin. But as Jerome himself recently observed, “Congress has assigned us very important jobs… maximum employment, stable prices, we have a role in financial stability that we share with other agencies..”… “Our role, though, is also to make sure that maximum employment happens in a context of price stability and financial stability, which is why we’re gradually raising rates.” … In response to a question about the so-called “neutral” interest rate, Powell said: “It’s worth noting that the last two business cycles didn’t end with high inflation — they ended with financial instability — so that’s something we need to also keep our eye on.”
The question in my mind is whether this Fed policy reversal is too little, too late?
In any event, for those who are inclined to blithely continue to play on into the wee hours in the casino, doesn’t “Don’t fight the Fed” also work when the Fed is in reverse?…
Of course, there’s still the carry trade if you’ve got the global presence, although looking at Kuroda-san’s choppy BOJ balance sheet totals and the numbers of Peoples Bank of China, there is some question about legs on that front, too. Maybe that’s just subtle posturing by Abe-san for tariff negotiations?…
Wonder if Super Mario at the ECB and his negative rate neighbors can carry this one ton bull solo?
So the Fed is looking for better control, a rate hiking model that is not a long-term self-fulfilling prophecy. But the evidence of the effectiveness of basing the FFR on more volatile futures doesn’t mean it will respond effectively going up and coming back down. The Fed can be as selective as they wish -but if they allow the FFR to go as high as the banksters want it will show up in the dreaded budget and skew even further our uncontrolled inequality. Sounds like Fed Minsky.
Forwards and futures are a bit different. The forward rate can be derived with a formula from the quoted yields on bonds traded over the counter for cash settlement.
A 2-year Treasury note futures contract exists. But it keys off the cash market, and in particular a “cheapest to deliver” T-note which can change over time. This is way too messy.
The 18 and 21-month ahead yields needed to derive the 6q7q forward yield are published in the WSJ. Current ones are marked with arrows:
Admittedly, I haven’t had my coffee yet, but I think I may have reached a conclusion: a country whose economic system can’t be understood in an hour is doomed to failure.
Trying to impose calm on a chaotic system is likely to produce the wrong result. Sometimes the action is calming, sometimes it make the problem, worse.
Oh but it worked last time is both correct and futile. The conditions now are not identical the the last time.
When your options are:
1. Change Interest rates
2. Flood the Banks with money
It is hard to see how these two levers, and only these two levers, can constitute management of anything.
modernmoneybasics.com takes about an hour to read. Then there is the children’s book about it.
It is of doubt in me that we really need the Fed. In my model I combine the Treasury with the Insurance company & don’t have a Fed that just raises and lowers interest rates.
My design is for a small nation where human capital is the major resource represented by insurance actuary tables and whole life for everyone from birth. I use shared equity as the basis for the currency.
This is not a fiat currency for a small start up nation has to build a reputation.
I have a lot more trouble really grasping the Fed, than I do understanding the Treasury. I understand it was created to reduce financial suffering from the business cycle.
I think that it was Glass Steagall did more than the Fed to prevent Great Recession or Depression.
Something else about the second chart: overall, BOTH rates have been falling since 1992. Money is getting cheaper, at least for the federal government (aside from the question of why it’s paying for its own product at all).
Perchance, does this mean it’s getting harder and harder to keep the economy going at all? What does it mean, long term, that financial capital is declining in value? Isn’t that a form of deflation?
This traces back to 1981/1982: http://theweek.com/articles/618964/forgotten-recession-that-irrevocably-damaged-american-economy
That article shows the history of the Fed Funds rate, which peaked in 1981/1982. But the envelope is provided by the 10Y yield: see https://fred.stlouisfed.org/graph/?g=kmTD . When the Fed Reserve raises their rate above the 10Y yield, it inverts the curve. Obviously they have less and less space as they 10Y yield gets smaller and smaller over time. Seems like this will not be able to continue at some point. But what would that mean? Have no idea.
Anyways, I put the 2Y in the graph as well, just to show how it fits between the Fed Funds rate and the 10Y. But make no mistake, inverted yield curves in the US are triggered by the action of the Fed Reserve increasing their rate.
If you want more history on what happened in 1981/1982, recommend: William Greider’s “Secrets of the Temple: How the Federal Reserve Runs the Country” Basically the Volcker Fed Reserve pulled the rug out from the working class in being a “playah” when it comes to inflation.
Yes, I read that back when. One point I remember is that policy was favoring financial industry over production; we’re living in the consequences. One wonders just when it all becomes so top heavy that it falls over.
Doesn’t the laundering of trillions of black and “top secret” DoD money off the public (but not necessarily Fed) books suggest that such time has already come and gone?
Sounds more like petrol Yuan and bipartisan popular & global saturation w never-ending war theaters is pulling the fig leaf off of the naked emperor (Jim’s distinctions of futures and forwards notwithstanding).
In the house of mirrors, if we the public can start to see clearly, surely what is needed is … MORE funny mirrors!
Something I’m just noticing looking at that same graph https://fred.stlouisfed.org/graph/?g=kmTD. When the Fed Funds rate eclipses the 10Y yield it also eclipses the 2Y yield: the 2Y yield eclipses the 10Y yield, but the Fed Funds rate eclipses even higher.
Maybe we can ask the Fed Reserve if we can use that metric instead (2Y vs Fed Funds rate), so we’re no longer dependent on whatever bad-cocktail is supposedly showing up in the 10Y yield.
A footnote: back in the 60’s, an investment manage (OK, my father) told me that the “natural”, baseline interest rate was 5%. Not true now; why not?
Well, 50 years ago we weren’t scraping the bottom of the barrel for pretty much every resource of value, be it oil, topsoil, industrial ores, clean water, etc. The opportunities for Moar Graof just aren’t there anymore.
Good sh*t dun got all used up. in other words.
And we are also at the bottom of the Kondratief cycle, as well. Hint: That’s deflationary, and often is when big wars start.
Yeah, that’s what I suspected – that resources were running out.
However, there’s another element (which may come to the same thing): overinvestment. It’s a defect of capitalism that the decision makers benefit only from returns to capital, so they tend to expand capital use at the expense of labor. The result is what we see – but this ultimately devalues capital. As there is more and more wealth in relation to the economy, it’s worth less and less.
Yes, and that drives the expansion of the wealth gap because the power of the wealthy derives from the difference between their ability to spend and everyone else’s ability to spend. So as their accumulated wealth looses absolute value, they increase it’s relative value by squeezing the rest of us to compensate thereby maintaining, or even increasing, their relative power in society.
–
Whether you believe that annual births are the same today as they were in the sixties because people are being more responsible in having children over the last half century, or because (as I think) people simply can’t find the new resources to expand the population faster than that any more, either way the population growth is in percentage terms less than it was in the sixties. So the natural baseline interest rate is less, too.
The corollary of this is that land, resource, and asset owners will always argue for population growth. It makes them money.