By Wolf Richter, a San Francisco based executive, entrepreneur, start up specialist, and author, with extensive international work experience. Originally published at Wolf Street
Exports increase economic activity as measured by GDP; and imports do the opposite, they reduce GDP though they tend to increase corporate profits — or else why would Corporate America run its supply chains around the world? So a trade deficit is a net negative for the economy. And this is what we got today from the Commerce Department:
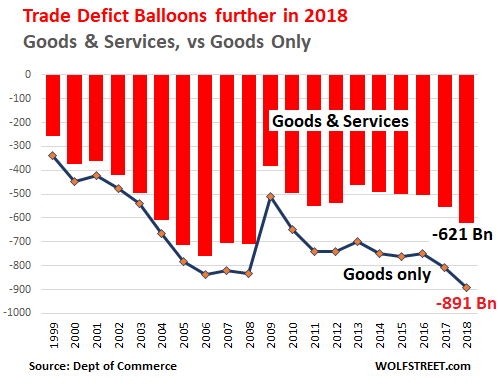
- US trade deficit in goods jumped by 10.4%, or by $84 billion to $891 billion, after having jumped 7.5% in 2017 (to $552 billion). Worst trade deficit in goods ever.
- US trade surplus in services improved by 5.9% or by $15 billion, to $270 billion, edging out the prior record of 2015.
- US trade deficit in goods and services jumped 12.4%, or by $69 billion, to $621.0 billion, after it had already jumped by 10% in 2017. The worst trade deficit in goods and services since 2008.
Exports of goods and services rose by $149 billion to $2.5 trillion, as imports surged by $218 billion to $3.12 trillion. The chart shows the annual trade deficit in goods and services (red columns) versus the deficit in goods only (black line):
The Goods Deficit
Exports of goods increased by $118 billion in 2018, to $1.67 trillion. One third of this increase was the $39-billion increase in exports of crude oil and petroleum products.
Imports of goods rose by $202 billion to $2.56 trillion. The largest categories of imports:
- Capital goods (computers, electrical equipment, etc. but not automotive): +8.2% to $693 billion
- Industrial supplies and materials (including crude oil): +13% to $576 billion
- Consumer goods, except automotive: +7.6% to $647 billion
- Automotive vehicles and components: +4% to $372 billion
- Food, feeds, and beverages: +7%, to $147 billion
A special word about “pharmaceutical preparations,” the legal kind: imports surged 21% to $134 billion. This is now the largest sub-category of Consumer Goods – because more and more of your prescription drugs are made in other countries. In 2016, pharma products blew past cellphones, currently the second largest category, stagnating at around $108 billion.
Below are the 14 countries with which the US has the largest trade deficits in goods (services not included). I put China and Hong Kong together since a lot of merchandise is transshipped and/or invoiced via Hong Kong. I included the EU (purple bar) for memo purposes, though it is not a country and though some member states are also included in the chart:
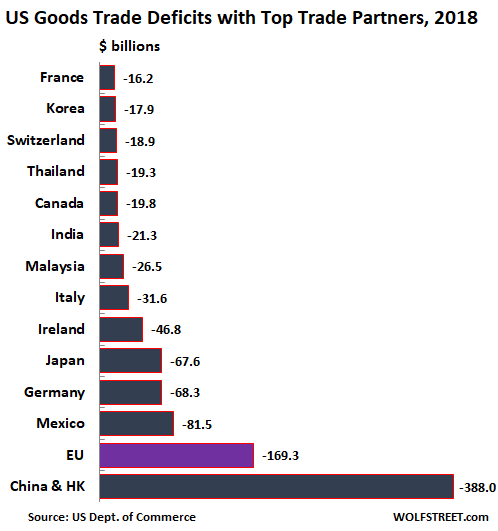
Some special words about the countries with which the US has the largest goods trade deficits:
- China and Hong Kong: the deficit soared 13.5%, or by $45 billion, to a phenomenal $388 billion, after having jumped 7% in 2017. Imports rose by $33 billion, and exports actually dropped by $13 billion.
- Mexico: the deficit increased by $10.5 billion, as imports and exports surged by 10.2% and 9.1% respectively.
- Germany: the deficit remained about flat.
- Japan: the deficit declined a smidgen, by $3 billion.
The opaque nature of trade dealings – transshipments, trade invoicing, tax issues, etc. – along with issues of ports of entry, etc., can produce peculiar results. For instance, the US had a trade surplus of $25 billion with the Netherlands and of $14 billion with Belgium, and not because the end-users of US products are in the Netherlands and Belgium. And the US had a huge trade deficit of $47 billion with tiny Ireland (up from $38 billion in 2017) where many US companies shelter part of their profits from US taxes.
The chart below shows US imports (red) and exports (black), in order of the trade deficit:
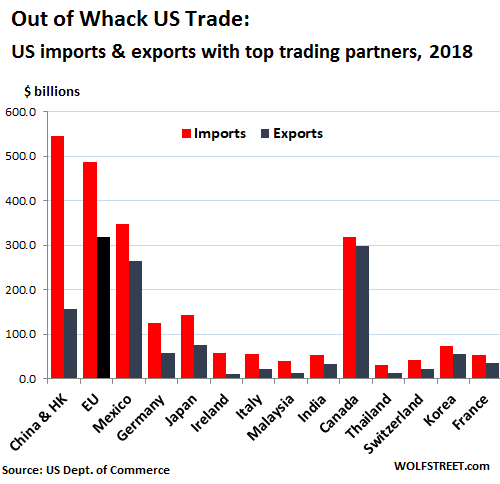
Here are the ratios of imports to exports by top country. A value of “1” means that trade is balanced, with imports equaling exports. A value of “3.5” means that US imports from the country are 3.5 times the size of US exports to that country:
- China/Hong Kong: 3.5
- Germany: 2.2
- Japan: 1.9
- Mexico: 1.5
- Canada: 1.1 (trade in goods is almost balanced).
This indicates that the US has a booming bilateral trade in goods with Canada that is almost balanced. If services are included, the trade relationship is balanced.
It also shows that Corporate America has routed its supply chain so deeply into China that by now 3.5 times as many goods are imported from China to the US than are exported from the US to China.
Corporate America is largely responsible for the trade deficit. No one forces companies to run their supply chains through China and around the world. Incentives in the US tax code and cheap labor overseas make it very profitable.
While the systems in China, Japan, and Germany coddle their local exporters, and impede imports, the US system does the opposite: It coddles US importers, and they range across the spectrum, from Walmart and GM to Apple and Pfizer. And these importers ruthlessly take advantage of what the system offers them.


This is a very good analysis on trade, eventhough the data do not reflect real destinations but money flows as stated in the case of Netherlands, Belgium or Ireland, and we could add Switzerland and HK, being the latter places for easy financial exchange. It would be interesting to analize the items exchanged with this two countries. Tons of ‘taxhavenservitzeren’ i guess.
It seems Trump is failing miserably in his stated objective of bringing jobs back to America through commerce wars. Looks like tariffs only work to exchange money somehow differently and I wonder where goes that extra money the US gets from tariffs.
Take a walk on the wild side and Trump is succeeding quite well, particularly when he fails miserably. It reminds me of a truly a sinister version of May West’s classic, “When I’m bad, I’m good!” I suppose one could call it getting your cake and eating it. https://jonathanturley.org/2019/03/04/polls-show-trump-holding-base-and-even-improving-among-voters/
It doesn’t require much to determine where Trump’s sympathies actually lie regardless of his stated goals.
I’m not sure how reliable the information in that article is, but even allowing for considerable bias and error, Trump seems bullet proof. Just looking at Professor Turley’s comment section one could say Trump is doing brilliantly given the mess his base is hypnotically ignoring. And I think you would be the first to agree it doesn’t mean these are “bad people”.
Trump is another matter. A thug with lizard smarts. I suspect he derives some of his greatest pleasure from getting away with this sort of head fakery.
Thank you BB. Following your reasoning, how easy is to mislabel people with bad or incomplete understanding as ‘bad people’.
Good data
Services are, I assume, mostly flows of finance, which should be its own separate category, imo.
“…and imports do the opposite, they reduce GDP though they tend to increase corporate profits…”
But remember: imports to the US still mostly don’t come from Chinese companies: they come from American companies (or suppliers servicing American companies) located in China! So in a real sense, American corporations are benefiting directly from Chinese exports, not just indirectly from cheap imports from China.
But China has other ideas than just being.a nice docile source of cheap labor like Mexico or Indonesia. China wants to control these industries, it wants to be a power unto itself. The so-called “trade war” has nothing to do with the well-being of the average US citizen, it’s about which elites are going to be in charge.
Yes. US elites have sold out citizens of this country for profits and in the process have made a rival that wants to destroy and/or dominate them. How foolish will the Western elites be?
As Michael Hudson points out GDP now includes earned income and unearned income. How much GDP comes from the FIRE sector would be good to know. Maybe it needs to be subtracted twice – once because it shouldn’t have been included in the first place, and the second time because it is a burden on the economy rather than a help to the economy.
Sometimes I am reminded of the Hunger Games when looking at the deficit numbers. The various “Districts” sending their tributes to the center. “May the deficits ever be in your favor” ;)
And always remember.
China did not TAKE our jobs. The 0.01% gave away our jobs so that they could become richer.
The sad thing is most people will probably not understand this. They would rather believe the opposite than consider that their fellow countrymen, their neighbors might have done this.