Yves here. This short piece looks at some of the intuitions about the relationship between rising household debt levels and increasing inequality. And they sure do look to be connected!
By Alina Bartscher, University of Bonn, Moritz Kuhn, Professor, Department of Economics, University of Bonn and Moritz Schularick, Professor of Economics, University of Bonn. Originally published at the Institute for New Economic Thinking website
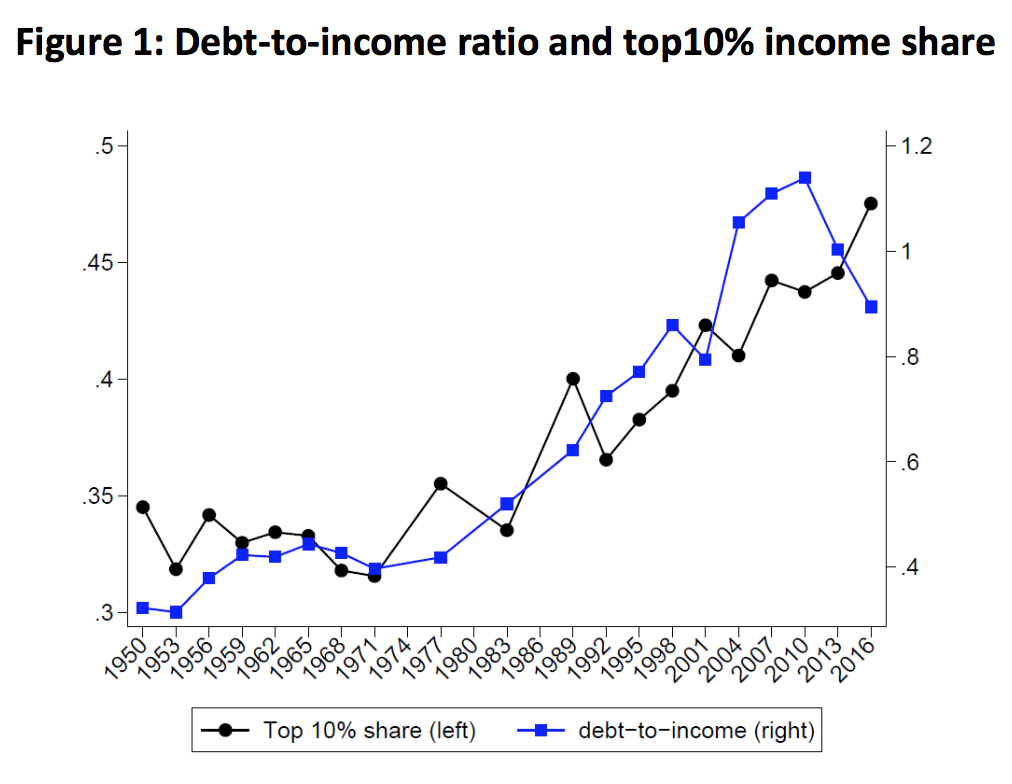
American household debt has skyrocketed in the past seven decades. The household debt-to-income ratio stood at 30% at the end of World War II. It peaked at close to 120% in the wake of the last financial crisis (Jordà et al. 2017). How do we make sense of this long-run increase in household debt over so many decades?
Rising income inequality is frequently invoked as a key factor. Over the past half century, the share of the richest 10% of households in total household income increased from below 35% to almost 50% (Piketty and Saez 2003; Kuhn et al 2020), as shown in figure 1. Rajan’s (2011) book “Fault Lines” made the case that for large parts of the population debt growth substituted for income growth. Are growing income inequality and indebtedness two sides of the same coin? Did households with stagnant incomes increasingly rely on debt to finance consumption, sustained by lending from the top-1%, as argued in recent paper by Mian, Straub and Sufi (2020)?
We still know surprisingly little about the growth of household debt in America over the past half century. From the perspective of the borrowers, the financial history of the increase of U.S. household debt and its changing distribution remains largely unwritten. Our new paper closes this gap. We study the evolution of household debt over the entire postwar period, asking which households borrowed so much more, and why.
Without long-run household-level data for the joint distributions of income, debt, and assets, this task would be impossible. However, we can rely on a new dataset that combines historical waves of the Survey of Consumer Finances (SCF), going back to 1949, with the modern SCF that the Federal Reserve Board has administered since 1983 (for details see Kuhn et al., 2020) This long-run “SCF+” makes it possible to follow the evolution of household borrowing across the entire income distribution over seven decades.
Low Income-Growth Households with High Debt Growth
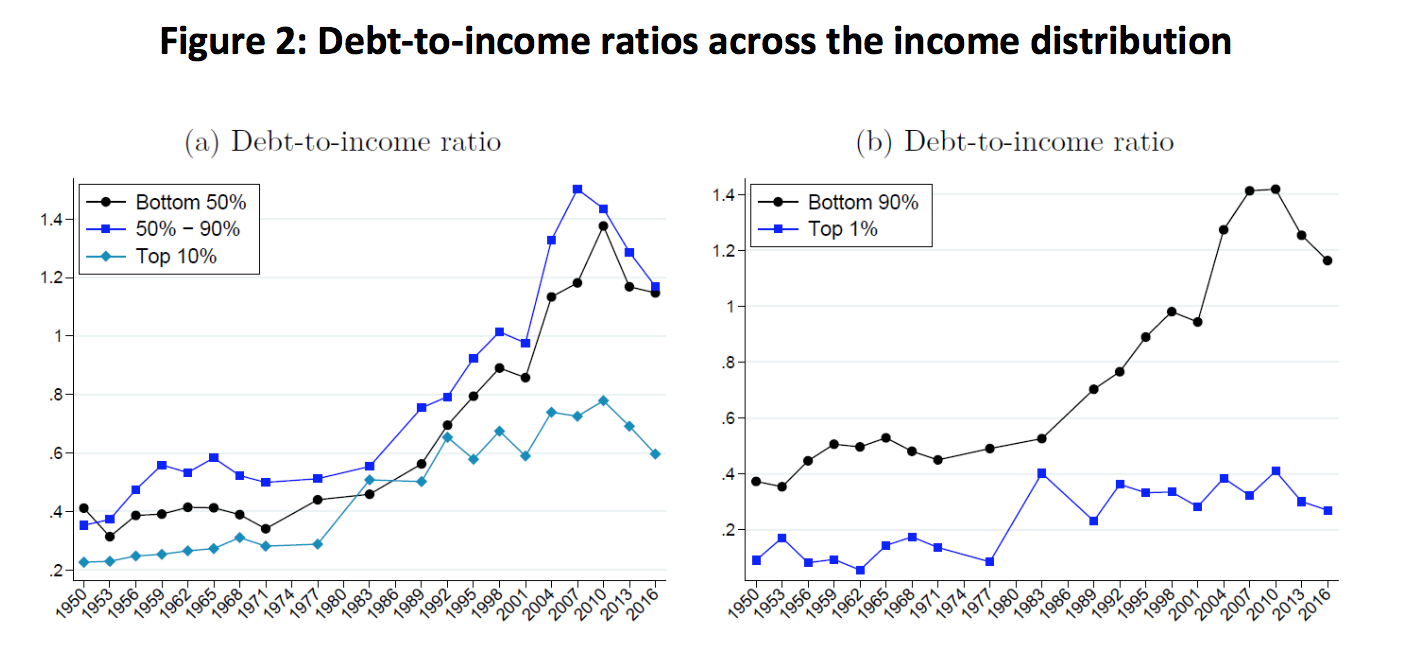
The data confirm that debt growth was indeed concentrated among households with low income growth. Debt-to-income ratios have risen most dramatically for households whose share in aggregate income has stagnated or fallen. This is particularly true for middle-class households, defined as households between the 50th and 90th percentiles of the income distribution. They account for about 55% of the total increase in household debt since 1950. Households in the bottom 50% of the income distribution account for a relatively small share of the total debt increase with only 15%. Their share in total debt has actually fallen over time.
The American household debt boom of the past decades was first and foremost a middle-class affair. Middle class incomes grew by 20% since 1970, middle-class debt by 250%. Figure 2 displays the sharp divergence in debt-to-income ratios across the distribution. This association between low income growth and high borrowing is puzzling. In standard economic logic, households are typically expected to borrow against the expectation of higher, not lower or stagnant, future income.
What was going on? In a nutshell, middle-class American families fell behind with regard to income and borrowed against their houses to finance spending. As house prices went up the main financial asset of middle-class households appreciated in value. In inflation-adjusted terms, quality-adjusted house prices in the United States increased by 75% between the mid-1970s and the mid-2000s. Housing wealth-to-income ratios of middle-class households more than doubled from 140% of income to 300% in 2007. This allowed households to borrow against higher housing wealth and grow spending in excess of income. We show that this “housing as an ATM mechanism” explains 50% of the household debt increase in the US since the 1970s. Two developments came together to sustain this mechanism over multiple decades. First, financial liberalization in the 1980s led to the development of new financial products that allowed households to tap into housing equity such as home equity loans. The 1986 tax reform was particularly important. It abolished interest deductibility for personal loans, but maintained it for mortgages, and thereby created incentives to switch to home-equity-based products. Banks heavily advertised these new products in the 1980s with catchphrases such as “Now, when the value of your home goes up, you can take credit for it.” Second, falling interest rates meant that cash-out refinancing became possible while keeping debt service manageable in the face of higher debt levels.
Home-Equity Borrowing and Financial Fragility
Using the Panel Survey of Income Dynamics (PSID), we quantify the effects of home-equity-based borrowing. We decompose the debt increase into additional debt incurred by extractors, new homeowners, and upgraders moving to larger homes. Home-equity-based borrowing against existing owner-occupied real estate accounts for around 50% of the increase in housing debt since the 1980s. From the early 1980s to the 2008 crisis, equity extraction alone pushed the household debt-to-income ratio up by more than 30 percentage points. Stratifying home equity extraction by income groups, it turns out that about half of total home-equity-based borrowing is accounted for by middle-class households (50%-90%).
This behavior of households can be rationalized as a Modigliani-style response of middle-class households to capital gains they made in housing markets. The intuition for the positive response is straightforward. When homeowners make capital gains in the housing market, they are richer than they expected when they originally made their financial planning decisions. As housing is indivisible, households need to liquidate some of their home equity if they want to smooth consumption over time. We argue that the observed equity extraction is qualitatively and quantitatively in line with the predictions of recent models such as Berger et al. (2017).
However, this rational response of Modigliani households over time led to a more fragile macro-economy. Home-equity-based borrowing may be rational from an individual household’s point of view, but in the process balance sheets are extended and become more sensitive to shocks. We document this “Minsky” aspect of the debt buildup by conducting a quantitative assessment of household balance sheets akin to stress test for banks. We trace the results of this stress test over seven decades of postwar history and show the increased vulnerability of households to income and house price shocks.
New Perspectives on the American Debt Boom
Taken together, these findings lead us to a more nuanced interpretation of the postwar household debt boom. It is true that middle-class families with low average income growth were chiefly responsible for increased borrowing. It is also true that these households relied on debt to finance consumption in the face of stagnant incomes. But they did so because they had become richer, at least temporarily.
With the housing bust of 2008, the painkiller mechanism for stagnating incomes imploded. What remained was more debt, stagnating incomes and lower wealth. The decade since the global financial crisis has witnessed the largest spike in wealth inequality in American history. The Covid pandemic thus hit American society at a time when the consequences of the last crisis were still tangible.
Note that this history of household debt in America meshes nicely with the idea of a savings glut — arising either from global factors or from growing income concentration at the top as in Mian et al. (2020) – that depressed interest rates. The argument we make is that once the house price increase was under way, home-owning middle-class households made large wealth gains and turned those wealth gains into spending via home-equity-based borrowing. The cumulative effects of this response to higher housing wealth were quantitatively important and turned the American middle class into the epicenter of financial fragility.
See original post for references


If the data stopped in 2010 then their commentary would be perfect. Don’t know how much weight to give two data points, but since the bust a decade ago there seems to be de-gearing and rising 1% share. Would be curious if something different is going on or these are just blips in the larger trend.
The economics of globalisation has always had an Achilles’ heel.
In the US, the 1920s roared with debt based consumption and speculation until it all tipped over into the debt deflation of the Great Depression. No one realised the problems that were building up in the economy as they used an economics that doesn’t look at private debt, neoclassical economics.
Not considering private debt is the Achilles’ heel of neoclassical economics.
The new scientific economics of globalisation was basically 1920s neoclassical economics with some complex maths on top, and it’s still got all those old problems.
It’s free market theories, and belief in price discovery, get people thinking you are creating real wealth by inflating asset prices.
Bank credit starts to flow into inflating asset prices rather than activities that grow GDP until you get a financial crisis.
Can you see when the UK started to use neoclassical economics?
https://www.housepricecrash.co.uk/forum/uploads/monthly_2018_02/Screen-Shot-2017-04-21-at-13_53_09.png.e32e8fee4ffd68b566ed5235dc1266c2.png
What happened in 1979?
The UK eliminated corset controls on banking in 1979 and the banks invaded the mortgage market and this is where the problem starts.
The transfer of existing assets, like real estate, doesn’t add to GDP so debt rises faster than GDP
Before 1980 – banks lending into the right places that result in GDP growth (business and industry, creating new products and services in the economy)
Debt grows with GDP
After 1980 – banks lending into the wrong places that don’t result in GDP growth (real estate and financial speculation)
Debt rises faster than GDP
2008 – Minsky Moment, the financial crisis where debt has over whelmed the economy
After 2008 – Balance sheet recession and the economy struggles as debt repayments to banks destroy money. We are making the repayments on the debt we built up from 1980 – 2008.
Japan has been like this since 1991.
The FED does the best it can with an economics that doesn’t consider debt, which really isn’t very good at all.
Greenspan and Bernanke can’t see the problems building before 2008.
https://www.youtube.com/watch?v=vAStZJCKmbU&list=PLmtuEaMvhDZZQLxg24CAiFgZYldtoCR-R&index=6
At 18 mins.
(When you use neoclassical economics that doesn’t consider debt, the economy runs on debt and then crashes in a Minsky Moment, 1929 and 2008.)
No one can work out what caused 2008, and afterwards and they attribute it to a “black swan”.
Janet Yellen is not going to be looking at that debt overhang after 2008 and so she can’t work out why inflation isn’t coming back.
It’s called a balance sheet recession Janet, you know, like Japan since the 1990s.
Jerome Powell is not looking at the debt overhang after 2008 and so thinks the US economy is fixed and raises interest rates. Raising interest rates with all that debt in the economy will soon cause a downturn and there is no way he will get anywhere near normalising rates.
Those poor central bankers don’t stand a chance.
One ideology, one economics.
Global group think.
China was one of the last places to make the same mistake as everyone else, but have realised where they went wrong.
Davos 2019 – The Chinese now know bank lending needs to be directed into areas that grow the economy and that their earlier stimulus went into the wrong places.
https://www.youtube.com/watch?v=MNBcIFu-_V0
This is what the UK used to do before 1980.
At 25.30 mins you can see the super imposed private debt-to-GDP ratios.
https://www.youtube.com/watch?v=vAStZJCKmbU&list=PLmtuEaMvhDZZQLxg24CAiFgZYldtoCR-R&index=6
Debt rises faster than GDP until you get a financial crisis.
1929 – US
1991 – Japan
2008 – US, UK and Euro-zone
The PBoC saw the Chinese Minsky Moment coming and you can too by looking at the chart above.
Where did the PBoC look to see the financial crisis coming?
Davos 2018 – The Chinese know financial crises come from the private debt-to-GDP ratio and inflated asset prices
https://www.youtube.com/watch?v=1WOs6S0VrlA
The PBoC know how to spot a Minsky Moment coming, unlike the FED, BoE, ECB and BoJ.
The black swan flies in under our policymakers’ radar.
They are looking at public debt and consumer price inflation, while the problems are developing in private debt and asset price inflation.
Japan was the canary in the mine.
Our experts couldn’t work out what happened in Japan because they thought banks were financial intermediaries.
Not being able to see the real problem they put it down to demographics, which was a very plausible explanation, but wrong.
This has allowed real estate booms and busts to plague the global economy ever since.
1990s – UK, US (S&L), Canada (Toronto), Scandinavia, Japan, Philippines, Thailand
2000s – Iceland, Dubai, US (2008), Vietnam
2010s – Ireland, Spain, Greece, India
Get ready to put Australia, Canada, Norway, Sweden and Hong Kong on the list.
2008 was so bad because Wall Street had leveraged it up.
“It’s nearly $14 trillion pyramid of super leveraged toxic assets was built on the back of $1.4 trillion of US sub-prime loans, and dispersed throughout the world” All the Presidents Bankers, Nomi Prins.
Normally it just wrecks the economy of the nation with the real estate bust
What is really happening in the real estate boom and bust?
When you use bank credit to inflate asset prices, the debt rises faster than GDP.
https://www.housepricecrash.co.uk/forum/uploads/monthly_2018_02/Screen-Shot-2017-04-21-at-13_53_09.png.e32e8fee4ffd68b566ed5235dc1266c2.png
The bank credit of real estate lending is bringing future spending power into today.
Bank loans create money and the repayment of debt to banks destroys money.
https://www.bankofengland.co.uk/-/media/boe/files/quarterly-bulletin/2014/money-creation-in-the-modern-economy.pdf
In the real estate boom, new money pours into the economy from real estate lending, fuelling a boom in the real economy, which feeds back into the real estate boom.
The Japanese real estate boom of the 1980s was so excessive the people even commented on the “excess money”, and everyone enjoyed spending that excess money in the economy.
The money creation of bank loans causes the economy to boom, but this is only a secondary effect so debt rises faster than GDP.
There is lots of new money going into the economy, but the inflation is only seen in asset prices, not consumer prices, so the central bankers and economists don’t see the problems developing.
In the real estate bust, debt repayments to banks destroy money and push the economy towards debt deflation (a shrinking money supply).
Japan has been like this for thirty years as they pay back the debts from their 1980s excesses, it’s called a balance sheet recession.
https://www.youtube.com/watch?v=8YTyJzmiHGk
Using future spending power to inflate asset prices today is a mistake that comes from thinking inflating asset prices creates real wealth.
GDP measures real wealth creation.
Thank you, SotS.
Ah, it’s interesting the central bankers regard rising wages as inflationary but not rising asset prices; or think keeping wages low while supporting rising asset prices would not lead to a huge private debt buildup; or think private debt is not meaningful data in their economic modeling.
Thanks for the comments.
The type of debt being discussed is mostly associated with the middle-class.
The poor and homeless typically have much less debt, but the debt they do get can be proportionally worse, such as payday loans and loan sharks.
Unfortunately those advocating for debt holidays often forgot about the poor and homeless, which unfortunately includes disproportionate numbers of racial minorities and other groups which suffer from systemic discrimination.
100,000 % – Sound of the Suburbs –
I am a bit more cynical –
The FED, Janet Yellen, Jerome Powell, Central Bankers, Those doing ‘Gods Work’, and others who have the media and congress bought owned and bamboozled.
Bamboozled because the ‘Smurf’ masters only plead ignorance to avoid a long stretch ,,,- they absolutely know what their actions do— backed by a long history and on the ground fact as to what their actions bring
We had to struggle with the old enemies of peace–business and financial monopoly, speculation, reckless banking, class antagonism, sectionalism, war profiteering.
They had begun to consider the Government of the United States as a mere appendage to their own affairs. We know now that Government by organized money is just as dangerous as Government by organized mob.
Never before in all our history have these forces been so united against one candidate as they stand today. They are unanimous in their hate for me–and I welcome their hatred.”
Election eve speech at Madison Square Garden (October 31, 1936)
Franklin Delano Roosevelt
It would be interesting to correlate debt-income levels with whether you voted for biden or bernie.
I am going to guess that a coupla decades ago that the banks did an analysis on the worth of the properties owned by all Americans and then worked out that if they could get those same people to borrow against it, that there would be billions of dollars in fees that they could make. Yes, it undermined the stability of the middle class and sent untold numbers of people into debt but hey, nothing personal. Right? This is one practice that should have been outlawed from the get-go but the sums of money were too large to ignore. And now here we are.
I am thinking that housing for most people is both an asset and a liability – everyone needs somewhere to live and most people don’t have more than they (think they) need? So rising house prices looked at that way don’t increase wealth at all since the liability increases proportionately.
Also, if consumption growth is financed by such borrowing and this process ceases, consumption does not just stagnate, it falls back to that level supported by income – and what is that?
And here is the heart of the housing crisis, and any of the zoning battles we all have witnessed. Zoning is a form of value insurance which protects incumbent owners and ensures a standardized product line. With homeowners seeing all these wealth gains, plus feeling other pressures, no wonder they want limit new housing from being built.
It had seemed to me that this is the natural operation of the War on Payroll. From the late-mid 1970s on, the trend was to stop increasing nominal wages, so cutting real wages. People were meant to fill the gap with consumer borrowing.
This was a double benefit for corporate accounts. Income statements were improved by reducing payroll expenses. Balance sheets were boosted by the value of the new loan assets. So HELOCs and Reverse Mortgages, and plain old credit card borrowing boomed.
But it all does have to be paid back. Those are the rules. Corporate policies have a lot to say about when it has to be paid back; for some reason they chose 2010 and on. So we see the deleveraging. It’s coming out now in collapsing living standards in place of increasing debt.
Another factor in the explosion of mortgage debt and concomitant inflation of real estate values was the dropping of reserve requirements for bank lending. This happened in 1991 for Canada, here is a good synopsis. We would have experienced that as a lowering of interest paid on deposits and a reduction in advertising for people to open savings accounts. We also would have seen a reduction in collateral requirements for mortgages, etc., and an easing of unsecured credit (credit cards and such).
Freed from the constraint of having to have 10% or whatever in deposits to back loans, banks became quite literally creators of money from thin air, as they say, and reduce the need for them to hold reserves, ie, our deposits. This is totally amazing! It is as if a retailer got and infinite amount of inventory for free, or a manufacturer got an infinite amount of raw materials for free. With only some overheads and payroll to cover, banks could record, as they did, record profits quarter after quarter. The only limit is market for mortgages, loans and other services. How to increase that market? Canadian population is fairly inelastic, so you have to increase consumption debt per capita. Encourage retail consumption via credit cards, raise fees, invent more services such as reverse-action mortgages, but the gold mine is real estate because you can (in)directly affect the price (I hesitate to call it value) of real estate by simply permitting higher mortgages and reducing the downpayment requirement. Back when I bought it was 10%, now I hear it can be as low as zero.
Homebuyers will bid up and up, real estate agents are gung-ho for that, too, and will advise sellers to price higher. A discouraged neighbour who rented but was hoping to buy told me, “They list at $899,999 but won’t accept an offer under a million.”
Back when I bought the rule of thumb was 25% of your take-home pay was for housing, now it’s more like 50% for a two-income family. Back in the 50’s and 60’s, a family could manage nicely on one income, and maybe have a boat or cottage.
Modern banks have always created money out of thin air by granting loans, whether they’re required to have 10% of reserve money related to deposits or not.
Deposits aren’t reserve money, they are claims on cash and the fact that banks in certain countries aren’t required to hold a minimum amount of reserve money doesn’t mean they don’t need to have enough of it.
Reserve money is the money banks use for payments among each other and the central bank.
Even with no minimum requirement, banks need reserve money for their daily business.
If you wire transfer 1000$ to an account in a bank other than yours, this money transfer has to be accompanied by a transfer of 1000$ of reserve money from your bank to that other bank for ‘clearing’ purposes.
So, a bank has to always have reserve money. If the supply of reserve money gets too low, the bank will lend it on the inter-banking market. And having a zero-interest policy, you know how much the loan would cost the bank…
If, as it happens these days, central banks are spending billions over billions to buy bonds from banks, the latter will have more reserve money than they want and they will use it to inflate the stock market.
A zero-minimum only means that, at the end of the day, the bank can decide how much reserve money it keeps.
Since deposits are claims on cash, what the bank needs is enough cash in the vault and in the ATM-machines.
The amount of reserve money the bank holds is not relevant to customers.
Well, at least that’s what I know. Corrections are welcome.
Where did it all go wrong?
Do you remember how bad it was in the 1970s?
Oh yeah, that Keynesian, demand side economics was terrible.
Do you remember how bad it was in the 1930s?
No, I wasn’t even alive then.
They couldn’t remember the problems with neoclassical, supply side economics.
Let’s find out from Mariner Eccles, he was there.
Mariner Eccles, FED chair 1934 – 48, observed what the capital accumulation of neoclassical economics did to the US economy in the 1920s.
“a giant suction pump had by 1929 to 1930 drawn into a few hands an increasing proportion of currently produced wealth. This served then as capital accumulations. But by taking purchasing power out of the hands of mass consumers, the savers denied themselves the kind of effective demand for their products which would justify reinvestment of the capital accumulation in new plants. In consequence as in a poker game where the chips were concentrated in fewer and fewer hands, the other fellows could stay in the game only by borrowing. When the credit ran out, the game stopped”
That’s what it’s like, and nearly everyone gets loaded up with debt.
The problem; wealth concentrates until the system collapses.
Do you remember when they let the robber barons and reckless bankers run riot in the US in the 1920s?
No, I wasn’t even alive then.
Well, they brought capitalism to its knees in the 1930s.
After the Wall Street Crash the Americans pulled their loans out of Germany, and the German economy got really bad. This made the Nazi Party more popular, leading to the rise of Hitler, WW2 and the Holocaust.
Oh yeah, I had forgotten how dangerous economic liberalism was.
Why would a few people getting very rich drive everyone else into debt?
It’s actually lies in the mechanics of the monetary system.
The BoE has revealed how banks create money out of nothing
https://www.bankofengland.co.uk/-/media/boe/files/quarterly-bulletin/2014/money-creation-in-the-modern-economy.pdf
Now we can see the zero sum nature of the monetary system.
Money and debt come into existence together and disappear together like matter and anti-matter.
It all sums to zero.
Hard to believe initially, but the whole universe is the same. It came out of nothing, with the big bang, and if you put all the matter and anti-matter back together again, you would have nothing.
The whole universe sums to zero.
The Americans didn’t realise what would happen if they tried to balance the budget while running a large current account deficit.
This is the US (46.30 mins.)
https://www.youtube.com/watch?v=ba8XdDqZ-Jg
The private sector going negative is the problem as you can see in the chart. This is when the financial crises occur.
As the Government goes positive, into Bill Clinton’s surplus, the private sector is going negative causing a financial crisis.
The current account deficit/surplus, public deficit/surplus and private deficit/surplus are all tied together and sum to zero.
Trying to balance the government budget, while running a large current account deficit, will drive the private sector into debt and cause a financial crisis.
Richard Koo used to work in the Federal Reserve Bank of New York and is only too familiar with the flow of funds in the economy.
Central banks use the flow of funds to see what is going on in the economy, it sums to zero.
It’s essentially the same as the chart of the US above (46.30 mins.), but divides the private sector into household and corporate sectors to give more information on what is happening in the economy in monetary terms.
This is Japan when they had a financial crisis in the early 1990s, the Government was running a surplus.
Richard Koo shows the graph central bankers use, and it’s the flow of funds within the economy, which sums to zero (32-34 mins.).
https://www.youtube.com/watch?v=8YTyJzmiHGk
Richard Koo’s graph of the flow of funds shows the Japanese Government ran a surplus as the financial crisis hit.
The terms sum to zero so, as one is going positive, another is going negative.
The Government was going positive, as the corporate sector was going negative into a financial crisis.
How can the private sector be nett positive?
You either have to run a current account surplus or a Government deficit as it all sums to zero.
If you balance the Government budget and balance trade, then the private sector must nett to zero.
The billionaires large positives must be matched with other peoples debt.
Warren Mosler is almost there in the MMT video (46.30 mins).
The private sector can’t nett save unless the Government runs a deficit.
The Government deficit also has to cover the trade deficit before the private sector can nett save.
If there is no nett private sector saving, but the billionaires are getting more and more, everyone else is taking on more debt.
Excellent set of posts. Your comments on national income accounting are similar to the work of Wynne Godley. He had some very interesting articles in the LRB from before 2008.
I like your comments, but to be correct, the zero-sum analogy doesn’t apply to matter and anti-matter in our universe.
In fact, our universe is the way it is because the big bang created more matter than anti-matter:
https://home.cern/science/physics/matter-antimatter-asymmetry-problem
Great historical reference, thank you!
Why has household debt grown? It’s been on purpose!!!!! They have figured out that the serfs can no longer be tied to the land, so they have given them credit cards so they can be tied down no matter where they move.
Modigliani wealth effects aside — “Home-equity-based borrowing may be rational from an individual household’s point of view, but in the process balance sheets are extended and become more sensitive to shocks.” is — I believe — the most important take-away from this post and the referenced working paper. “The rising indebtedness of U.S. households is a much-debated phenomenon. … The underlying drivers of the process, however, remain controversial.” Why not study the rising economic fragility of the Populace and its origins?
There is too little economic theorizing supported by data and this paper does indeed “…provide new and potentially important insights for future research on household portfolio choices…”. But I feel some deeper, simpler truths remain hidden in this mass of data, graphs, and analysis. Consider household portfolios — what class of investments remains available to the middle class other than housing? I have been unable to regard stocks or bonds as investments for several decades. And is housing an investment in the usual sense of the word? And consider the ratios of debt-to-income. I believe they hide several other issues. To incur debt requires collateral of some kind, collateral which includes a relatively reliable income stream — which limits the long-term debts the poor can incur. A family can consume only so much house and furnishings to satisfy basic needs exclusive of ostentation. Upper income families could obtain the greatest benefit of the 1986 tax laws while assuming the least risk of becoming homeless. What about the declines in job stability and their impacts on the number of times various groups much sell their house-investments and move?
Although this post and paper is restrained in this regard — economic discussions of debt often chime with discordant moral undertones: “housing as an ATM mechanism”. Where is the discussion of the costs and their proportional impacts facing various sectors of the population? Debt supports spending and spending is for consumption. But the category consumption nicely tucks in spending for consumption of medical and dental care, education, periods of unemployment and other costs impacting consumers. How much are the available Government data aggregates like — debt, consumption, income, costs-of-living, standard-of-living, unemployment numbers — warped by Government juking?
What is Modigliani style?
Every time the Fed cuts interest rates to stimulate consumption through borrowing, I am reminded that almost everyone is focused on the flow of debt–not the stock–and its implications for future consumption. Households who borrowed against their home equity were basically raiding their retirement funds to support current spending. Mortgages used to be one of the best forced savings vehicles out there (they are also a leveraged investment in real estate). So we were left with the leverage and none of the savings.
Apparently no one at the Fed has done any serious analysis of the retirement capital needs (and looming deficits) of middle class Americans–or they would realize what an incredible disservice their policies have done to families. Macro econonists are focused on averages and abstractions, and completely missed this critical issue. I figured it out in 2015 and was appalled by how low interest rate policies have pulled the rug out from under ordinary families. They encouraged excess borrowing, while depleting the yield on savings vehicles ordinary Americans rely on–while raising the price of assets that they can never afford to own. For the Fed not to understand that it is driving inequality DIRECTLY through its policy of generating “wealth effects” that are not available to most Americans is incomprehensible. If they don’t know, it’s becaus they don’t want to know.
After 2009 households realized how royally they were screwed, so tried to fix their balance sheets. Unfortunately, memories are short, and the borrowing restarted in ~2015, so debt burdens are back to where they were (in $, not % of household income, fortunately, at least pre-coronavirus). With very little margin of error. Fool me twice…
The big mistake Japan made–and that we repeated–was to use financial assets as collateral, rather than productive capacity. Both assets and debts have been massively inflated, and financial markets have become a Ponzi scheme for the rich. They are not as wealthy as they think they are.