Yves here. I am running this article as a critical thinking exercise. On the one hand, it is not difficult to make a case that the accounting net worth of most companies is a questionable measure, for instance because pretty much any public company of significance has made acquisitions and paid a handsome premium over the seller’s market value….when over 3/4 of deals don’t work out due to buyer overpayment.
Even though this post is about non-financial corporations, the financial/non-financial distinction isn’t as tidy as it seems. Multinational run their Treasuries as profit centers; many earn more than 25% of their profits from trading. That means the issues Steve Waldman raised about the net worth of banks apply to them to a degree:
The bottom line is simple. The capital positions reported by “large complex financial institutions” are so difficult to compute that the confidence interval surrounding those estimates is greater than 100% even for a bank “conservatively” levered at 11× tier one capital.
Errors in reported capital are almost guaranteed to be overstatements. Complex, highly leveraged financial firms are different from other kinds of firm in that optimistically shading asset values enhances long-term firm value…
When I say stuff like “confidence intervals surrounding measures of bank capital are greater than 100%”, what does that even mean? Capital does not exist in the world. It is not accessible to the senses. When we claim a bank or any other firm has so much “capital” we are modeling its assets and liabilities and contingent positions and coming up with a number. Unfortunately, there is not one uniquely “true” model of bank capital. Even hewing to GAAP and all regulatory requirements, thousands of estimates and arbitrary choices must be made to compute the capital position of a modern bank. There is a broad, multidimensional “space” of defensible models by which capital might be computed. When we “measure” capital, we select a model and then compute. If we were to randomly select among potential models (even weighted by regulatory acceptability, so that a compliant model is much more likely than an iffy one), we would generate a probability distribution of capital values. That distribution would be very broad, so that for large, complex banks negative values would be moderately probable, as would the highly positive values that actually get reported.
Finally, I have difficulty with the notion that share prices in secondary markets have much meaning, despite how commonly they are held as investments. Unlike bonds, shares are a legally weak and ambiguous promise, basically “We’ll pay you dividends if we make money and feel like sharing” and “You have a vote but we can dilute it at any time, and we have staggered boards too, so pound sand.” Share prices of most companies move 100% in a year. How can you say the value at the low point is any more valid than at the high point? As Warren Buffett has said, in the short term, the stock market is a popularity contest, while in the long term, he contends it is a weighing machine.
Similarly, even though market cap is widely used as a key metric of company value, that price is set at the margin. It isn’t the price sellers can expect to realize if every one, at the same time every day, decided to cash in.1
By Steve Roth (steve@steve-roth.com), a serial entrepreneur and the publisher of Evonomics.com and Sabri Öncü (sabri.oncu@gmail.com) is an economist based in İstanbul, Turkey. A slighly edited version of this article first appeared in the a href=”https://www.epw.in/journal/2020/28-29/h-t-parekh-finance-column/wealth-corporations.html”>Economic and Political Weekly on 11 July 2020
“Financial Assets = Liabilities.” It’s one of the great accounting-identity truisms of economic understanding — both among traditional, mainstream economists, and even (especially) among many heterodox, “accounting based” practitioners. It seems obvious: When a company issues and sells bonds, it posts a liability to its balance sheet; the bond buyers hold financial assets on theirs.[1]
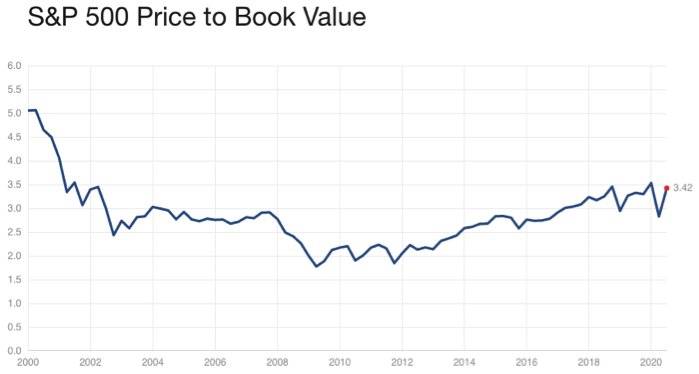
The problem is, that truism isn’t even close to true. The most obvious example is corporate equity shares — financial assets by any definition. The asset value of outstanding shares is vastly larger than firms’ book value, shareholders’ equity — the bottom-line balancing item on the liability side of firms’ balance sheets. Over the last half century, the market-to-book ratio of the S&P 500 has ranged between 2X and 5X.
The discrepancy exists even for U.S. Treasury bondsoutstanding, though that discrepancy is quite small.
As soon as a new financial asset is issued, at least if it’s tradeable in the markets, its price starts changing. Asset holders look at their brokerage statements, which are marked to market instant by instant, and see that they have more or less assets. Meanwhile the liabilities on issuers’ balance sheets remain (mostly) unchanged. Financial Assets ≠ Liabilities.
Economists can hardly be blamed for this incorrect understanding. The national accounts themselves obscure this reality. If you look at the Flow[2]tables in the Fed’s quarterly Financial Accountsor “Flow of Funds,” for instance, you won’t find any accounting for changes in asset holdings due to changes in market prices — revaluation. So those tables can’t explain changes in assets and net worth from period to period. They’re accounting-incomplete — certainly so if you compare them to the Consolidated Statements of Comprehensive Income that publicly traded corporations are required to publish quarterly.[3]
| BERKSHIRE HATHAWAY INC | ||||||||
| and Subsidiaries | ||||||||
| CONSOLIDATED STATEMENT OF COMPREHENSIVE INCOME | ||||||||
| (dollars in milions) | ||||||||
| Year Ended December 31 | ||||||||
| 2016 | 2015 | 2014 | ||||||
| Net earnings | $24,427 | $24,414 | $20,170 | |||||
| Other comprehensive income | ||||||||
| Net change in unrealized appreciation of investments | 13,858 | (8,520) | 5,831 | |||||
| Applicable income taxes | (4,846) | 3,104 | (2,602) | |||||
| Reclassification of investment appreciation in net savings | (6,820) | (2,332) | (3,360) | |||||
| Applicable income taxes | 2,387 | 816 | 1,176 | |||||
| Foreign currency translation | (1,541) | (1,931) | (2,032) | |||||
| Applicable income taxes | 66 | (43) | 183 | |||||
| Prior service cost and actuarial gains/losses of defined benefit pension plans | 354 | 424 | (1,7023) | |||||
| Applicable income taxes | (187) | (140) | 624 | |||||
| Other, net | (17) | (94) | 8 | |||||
| Other comprehensive income, net | 3,254 | (8,806) | (1,335) | |||||
| Comprehensive income | 27,681 | 15,608 | 18,835 | |||||
| Comprehensive income attributable to noncontrolling interests | 291 | 275 | 256 | |||||
| Comprehensive income attributable to Berkshire Hathaway Shareholders | $27,390 | $15,333 | $18,579 | |||||
The same is true, even more, of The National Income and Product Accounts (NIPAs) — though those accounts make no claim or aspiration to such complete accounting; they don’t include anything resembling sectoral balance sheets.
How can we make An Inquiry into the Nature and Causes of the Wealth of Nationsabsent a comprehensive accounting of wealth accumulation?
Happily, there is a set of complete, fully stock-flow-consistent sectoral accounting statements available, based on the System of National Accounts(SNA) standards developed and promulgated by the United Nations and allied institutions. Think of them as Generally Accepted Accounting Practices (GAAP), but for countries. In the U.S., the SNA-compliant accounts are called the Integrated Macroeconomic Accounts (IMAs). They were released only in 2006, with quarterly tables released in 2012 (annual-only for financial subsectors). Their data extends back to 1960. You’ll find them as the “S” tables at the end of the Fed’s quarterly “Z.1” or Financial Accounts report. They’re also very conveniently available in interactive form here, and all the sectoral tables are available in a single Excel workbook here.
In the IMAs, each sector has a balance-sheet account (with Net Worth as the bottom-line item), and crucially, a Revaluation account tallying “Changes in net worth due to nominal holding gains/losses,” broken out for various asset classes. With this inclusion, each sector’s table fully explains change in net worth during an accounting period.
But that finally returns us to the title of this article: the net worth of firms. There is what seems to be a very particular oddity in the IMAs, which on examination yields a rather revelatory understanding of economies and economic statements:
In the twenty-five years since 1995, according to the IMAs, the net worth of the U. S. nonfinancial firms sector has been positive in only two.
It’s pretty eye-popping. “Nonfinancial firms aren’t worth anything, are worth less than nothing?” No. Rather, these notional net worth figures reveal an important accounting and economic reality, embodied in a quirk of the IMAs’ accounting: net worth is meaningless for firms.Or to put it another way: unlike households, firms don’t own their own net worth. Their bottom-line, right-hand side balancing item is not net worth, it’s shareholders’ equity. The possessive apostrophe says it all: shareholdersown firms’ net worth.[4]
And ultimately, all that value is owned by the household sector. (This ignoring the Rest of World sector, non-domestic ownership, for simplicity.) Sure, firms own shares in firms which own shares in firms, but ultimately households own it all. Because since 1865 in the U.S., nobody can own “equity shares” in households, in people. People own firms but firms don’t own people. It’s a one-way, asymmetrical ownership relationship. The IMAs reflect that asymmetry.
Jumping to the IMAs’ Household balance sheet, you see exactly that: household assets include the total value of all firms, at current market prices (“market capitalization”). The firms sector[5]is a wholly-owned subsidiary of the household sector. Its value is “telescoped” onto the left-hand side of the household sector balance sheet.
And this is how the IMAs’ apparent quirk arises, for three reasons. First, there’s an attempt to present all sectors similarly, with net worth at the bottom. (Even though sectors aren’t all treated the same in other matters, for good and necessary reasons; their accounting realities are fundamentally different.) That’s problematic when firms don’t actually have anything that’s meaningfully called net worth.
Second, the IMAs post firms’ equity liabilities to their balance sheets as just another liability — not broken out as a singular item as in corporate reports. Think: “Liabilities and Shareholders’ Equity.”
Third, The IMAs post firms’ equity liabilities not at book value, but at market value. Another oddity results: when share prices go up, firms’ liabilities do as well, so their net worth goes down. It’s kind of wacky.
Again, this results from a desire for accounting consistency and closure. The firm sector’s market-priced equity liabilities equal households’ market-priced equity assets. What goes missing is a key measure for firms: book value, the standard measure of shareholders’ equity. It’s quite easy to calculate: subtract firms’ equity liabilities from their total liabilities, and subtract that from their total assets. It’s annoying that the IMAs don’t do that for us as the firms’ bottom line, or at least in a memo item. But the exercise is a great way to understand the underlying economic and ownership reality that the IMAs reveal so well.
Understanding the Wealth of Nations
Some may be wondering, “Why does all of this matter?” It’s important because it reveals a giant lacuna in economists’ understanding of wealth accumulation, the wealth of nations, and the relationship between wealth and “real capital.” Contrary to a quite ubiquitous conception, for instance, neither the household sector’s Net Saving (in the Current Account), or Capital Account accumulation, comes even close to explaining the sector’s wealth accumulation.
Over the twenty years 2000–2019, the U.S. household sector’s Net Saving was $14 trillion, while its net worth increased by $75 trillion. Of that, $38 trillion is attributable to nominal holding gains, unrelated to the sector’s current-account Saving. And of that, $27 trillion is attributable to nominal holding gains on equity shares.
Not all of that $27 trillion materialized magically, of course. The firm sectors’ book value (roughly, their cumulative saving on behalf of their household owners) also increased over that period, by $21 trillion. That explains much, but not nearly all, of the equity holding gains accrued by households. Even in this one equity asset category, there’s a $6 trillion remainder, unexplained — equivalent to $48,000 for every American household.
Absent the complete accounting embodied in the IMAs, these quite massive numbers are completely invisible to economists, and their models. The economy doesn’t balance to “saving.” In an important sense, that’s just an artificial, residual balancing item.
The economy balances to net worth: the wealth of nations.
[1]This is the very definition of a financial asset: it has a related liability on another balance sheet. Nonfinancial assets, such as land titles, don’t. All liabilities are inherently financial; the debt is due to someentity, which holds that obligation as an asset on its balance sheet.
[2]Renamed the Transactions tables as of June 2018, with the following note (emphasis added): “As of this publication, the term “flow” is being replaced by the term “transactions.” The concept being referred to, which is the acquisition of assets or incurrence of liabilities, is not being changed. The change in terminology is intended to prevent confusion with the broader concept sometimes called “economic flow,” which is the change in level from one period to the next and is composed of transactions, revaluations, and other changes in volume. The new terminology brings the Financial Accounts of the United States into better alignment with international guidelines in the System of National Accounts 2008 (SNA2008).”
[3]berkshirehathaway.com/2016ar/2016ar.pdf page 37
[4]It’s revealing to compare nonprofits, which like households and unlike for-profit firms, don’t have shareholders. They own their own net worth (if anyone does). That’s why they’re included in the household sector accounting, and that sector is properly labeled “Households and Nonprofit Institutions Serving Households” (NPISHes).
[5]There are actually three firms sectors in the IMAs: corporate nonfinancial, corporate financial, and noncorporate nonfinancial (with additional tables detailing subsectors of the financial sector). For brevity, simplicity, and clarity, we speak of them here collectively as “the firms sector.”
_____
1 Please don’t say all those public shares could be bought by private equity. Private equity’s share of global equity is only on the order of 5%.


Do I understand this correctly, if the company you own is worth even $1.00, you’ve failed in some respect to take proper care to transfer that $1.00 to your bank account?
That would explain the frantic end-of-month ritual to close the books and divy up the spoils.
And of course the fact that operational cost-cutting is never allowed to be turned into reserves, but are instantly distributed as profit.
I think the current practice of distributing all profits and using borrowings for all (or even more than all, as in share buybacks paid for with debt) working capital requirements is a relatively recent (recent decades) phenomenon. Firms used to retain earnings to help fund working capital requirements. I imagine that many smaller or tiny enterprises, that may have difficulty funding WC requirements through bank borrowings, still do this.
There was some discussion about this when AAPL was holding $200B in cash with a market cap of $600B. The complaint was that if since 1/3 of the market cap was cash, a significant portion of the share price you had to pay for was just buying in to the cash position, and so theoretically the company itself, worth only $400B cost 50% more than it needed to and your yield would be proportionally less. That is, if the money was distributed to shareholders and then you bought in, you could get a lot more stock and a larger share of the profits.
There was a secondary argument that goes a bit like this: if dividend payments are 3% and I can borrow money at 2%, then the company saves money by buying back stock. Though of course there is a risk premium because you can’t skip out on bond payments, but dividends can be suspended. To be fair, I’m not sure AAPL ever paid 3% dividends.
AAPL has in general been trying to wind down its cash position ever since, taking on some debt to make sure it has liquidity. As a stockholder, I have personally found it annoying because almost all of that money went to pay off investors who were not me! The money went to the most fickle of investors, eager to sell. Sure, I end up owning a bit more of the company, but for what they paid for stock, they could have quadrupled the dividend, and I think that would have done more for the stock price than some buybacks. I am always happy to pay capital gains tax, because it means I “earned” some actual money. Paper profits based on today’s stock price can go away as quickly as they appear, and don’t pay the bills. When the bills do come, the paper profits aren’t necessarily there that day and I could even be forced to sell at a loss. I feel like corporate theory has it wrong on this one.
Authors use 1700+ words, but I have no idea what they want to say.
A few comments:
Balance sheet not reflecting the value of financial instruments.Wrong. Published balance sheet is snap in time, correct at the time. Apples/oranges.
US savings vs US companies net worth is irrelevant, unless the author believes that international cross-holdings don’t matter (hint – they do, on both sides, because a lot of very rich don’t hold their stuff directly). Approximately 2/5ths of the S&P (which admitedly is not the whole market, but close) is deemed foreign held (deemed because sometimes it can be pretty hard to establish beneficiar owner).
Anyways, once again. The author may, or may not have some point. But if I was given this to mark, I’d give it F, because I have no idea what the point is.
And this is why I always read the comments.
Thank goodness, I am not the only one that read this and asked myself, What does all this mean? I think it means that accounting principles are very flexible, maneuverable and pliable so that only accountants (maybe) are the ones who know what is going on in the real world. I just think, well, there certainly are a lot of ways to screw the world via finance!
Your statement:”accounting principles are very flexible” reminds me of a joke about Anderson Accounting post Enron: A job applicant comes to interview for an opening in Corporate Audits. The Anderson interviewer asks the applicant, “How much is 2 + 2 ? The confused job seeker answers “4” and is immediately dismissed from the interview. A second applicant comes in — same question — same puzzled answer — followed by immediate end of the interview, thank you for coming, and we’ll call you don’t call us.
A third job applicant is called in — “How much is 2 + 2 ?” The applicant raises an eyebrow, forms a sly grin and answers, “I suppose that depends on how much you want it to be.”
“You’re hired.”
there’s a $6 trillion remainder, unexplained — equivalent to $48,000 for every American household.
for comparison–In America:
What is the real median household income?
$59,039
The U.S. Census Bureau reported in September 2017 that real median household income was $59,039 in 2016, exceeding any previous year.
and a reminder:
What is the difference between median household income and median family income?
The median income is the point where half the people make more and half make less. … Family income is average for a family of two or more related people living in a household. They can be related by birth, marriage, or adoption. Household income is the average income of all people living in a housing unit.
It’s not clear at all from the post it’s really unexplained.
They spend two paragraphs on it right at the end, with the crucial bit being “Not all of that $27 trillion materialized magically, of course. The firm sectors’ book value (roughly, their cumulative saving on behalf of their household owners) also increased over that period, by $21 trillion.”
There nil explanation of where exactly the 21 trilion for firms comes from, so it’s impossible to check whether it’s the right part of the accounts or not.
And that’s ignoring the fact that household equity gains have nothing to do with firm book value gains.
As I said, they might have a point. But if so, it’s extremely poorly structured and put out.
My takeaway was this, which goes to your point of accounting principles being flexible –
So yes stock price changes constantly but you have to list a static number on a balance sheet every quarter, which is out of date as soon as it hits the paper. But other than that, the article was more than a little confusing.
Value is hard to pin down. Especially when it was intentionally never understood in the first place. It’s like position versus momentum, right? Who says it isn’t a quantum world from head to toe? I’m thinking this is just a good explanation of QE. It is what is necessary to continue to provide cost-effective finance which in turn creates the positive energy and synergy for the “economy”. That is until opportunity sputters out and there is too much money chasing too few opportunities. That’s us. And it explains why the Fed just started priming the pump in smaller sovereign countries without much “wealth” – because we need to keep the energy flowing, everywhere. Fiscal is the best way to do it. Back all of their currencies – they are symbolic of the energy of the people; let them do their own QE without the burden of debt which prevents even distributions of wealth, and giving back to the environment. Debt, by creating inequality sets up a wealth v. liabilities trap which cannot go forward. Yet debt is a totally synthetic concept – it has no reality. And right now, today, we have so many unmet necessities and obligations that have been transmogrified into useless profits for the financiers that we are now giving money away. Karma. The financiers pretend they don’t understand. I’m all for it.
I think this is a category error similar to the one made by economists who think sovereign governments can run out of money. Companies don’t hold their own equity on their balance sheet for the same reason that governments don’t hold cash balances – in both cases they are the issuers of the instrument, which is a share of the value of the underlying entity. If the value you have a share in includes shares in the value of the entity which is made up of shares in… then it’s turtles all the way down. Doesn’t make sense (and if you read on it’s actually not the scenario he is discussing anyway, so his framing in terms of company balance sheets is a bit of a strawman).
My main takeaway from the rest of the article is that in the national accounting system, ‘household sector’ includes the likes of Jeff Bezos, which means that it’s a pretty useless concept for any practical purpose. Consequently I struggle to share the author’s enthusiasm for defining it accurately.
It also reminds me of something I’ve noticed previously, namely that “last sale price times shares outstanding” is a horrible way to value companies at the best of times, even less so during periods of Ponzi financing (which seems to be our new normal these days). I felt like the Epicurean Dealmaker would probably have offered a good explanation of this at some point, so I did a quick Google search and he didn’t disappoint:
http://epicureandealmaker.blogspot.com/2014/07/shine-on-you-crazy-diamond.html
As a disclaimer, the following quote:
applies equally well to the Dealmaker himself, but he’s fun to read even though he’ll be first against the wall when the Revolution etc. etc.
“My main takeaway from the rest of the article is that in the national accounting system, ‘household sector’ includes the likes of Jeff Bezos, which means that it’s a pretty useless concept for any practical purpose. ”
I cannot speak for Steve, but I agree. And I doubt that he would disagree. Please view this as a first cut in a longer work that will address the issue you mentioned.
Actually, govts do hold cash balances, and cash balance is a govt liability (well, CB). Except in the case of govt, the liability is to exchange one bit of paper for another (i.e. saying ‘the BoE will give bearer of this pound note a pound on presentation’ – which will be a new crisp pound note).
In case of the company, a share _is_ a legal liability. As I wrote below (and Yves later on), it’s a residual claim on the company. Any claim on the company, by definition, is, literally, a liability, held on balance sheet.
If you’d want to be really technical, Assets = liability + equity, but that is only because equity is an open-ended liability while others are better defined in terms of due.
The equation you wrote is for corporations and it is why corporations have zero net worth. I would write it as:
Assets = Debt + Equity = Liabilities
and it is always true that
Net Worth = Assets – Liabilities.
Therefore, for corporations, net worth is zero.
King Edward the 7th once asked what a postman actually did. On being told that a postman knocked on doors and stuck letters into boxes, the King apparently said, ‘Dear me, it wouldn’t at all do if everyone went around banging on doors!’. Needless to say people don’t go round banging on doors all the time; all houses, cars, bonds and shares are not put up for sale at the same time, and we price things at the value of the last transaction. Asking what a thing is ‘really’ worth is really pointless – my favourite local restaurant was over 40 years old and worth a fortune in March (BC ie before COVID-19) now it is bust.
To my mind, much hinges on the author’s assertion that equity shares are financial assets, which he describes in a footnote, “This is the very definition of a financial asset: it has a related liability on another balance sheet. Nonfinancial assets, such as land titles, don’t.” While equity shares held by the non-issuer are of course financial assets to the owner as we commonly understand the term, if I am firm X, having issued stock and received cash, it is difficult to see where the related liability is, let alone one that can be measured with any sort of accuracy ( a liability which we know can go to zero, as in a bankruptcy, where the owner of the share receives nothing. As Yves points out, stock ownership by the holder is “a legally weak and ambiguous promise.”) I don’t know what the reasoning of the IMA was in deciding that what we traditionally call equity should be called a liability, but I would be interested in seeing it. The decision does not seem particularly clarifying,
>I don’t know what the reasoning of the IMA was in deciding that what we traditionally call equity should be called a liability
I agree and have actually corresponded with their accountants on this. (It’s an SNA methodology, but in any case.)
Should really break with the desire for accounting consistency across sectors for firms, make shareholders’ equity rather than NW the bottom line (with memo items showing market cap, and the discrepancy?). Because firms are different; they don’t own their own net worth — rather the point of the article.
Of course they don’t own their net worth, that’s the whole point of legal point of companies – ability to own in common, indirectly and w/o direct management unlike partnerships (limited liability was added only relatively recently, before that the shareholders got both assets and liabilities).
That’s why they are different legally from trusts, that do own their assets outright and may, or may not, have obligations towards their beneficiaries, but the beneficiary and owner are two very different concepts.
Huh? Shareholders’ equity is a residual claim on the assets and the income of a company, after all other obligations are satisfied, as vlade also points out below. I don’t understand how you can take issue with this treatment.
?? I’m only taking issue with their presentation of bottom-line “net worth,” which they present as book value – market cap. And they don’t even show book value — thought it’s easy to calc yourself: total assets – their total liabilities (which includes equity at market cap) + market cap equity.
As the article says, it’s a quirky presentation.
Equity is a liability by definition – it’s a claim on the company, and any claim on the company comes into “liab ility” column.
Yves’ commentary ending “the price sellers can expect to realize if every one, at the same time every day, decided to cash in” (an impossible prospect), and Vlade’s, “Published balance sheet is snap in time, correct at the time,” focus on market price fluctuations, as opposed to long-term asset/wealth accumulation.
If we focus on the latter, we find that those fluctuations and associated cap gains/losses are not (nearly) symmetrical around book value (~cumulative net investment). ~50% of our accumulated wealth is not attributable to capital formation, and/or to “inside” and “outside” so-called “money printing.” It simply appears utterly ab nihilo due to asset price runups.
https://www.asymptosis.com/wp-content/uploads/2020/08/WealthAndGains.pdf
Viewing that larger context, it seems problematic to claim that the $66T in assets and net worth accumulated from capital gains by individuals, families, and dynasties over half a decade+ don’t count as “real wealth.” (Unless it’s to claim that we’re in The Mother of All Asset Bubbles…)
The headline, BTW, is yes click-baity, hoping to provide a lure and entrée into explaining the Integrated Macroeconomic Accounts’ somewhat quirky but revealing presentation. And likewise the Z.1’s Flow (now Transactions) tables’ failure to even come close to explaining changes in the Levels tables.
Cheers.
Finance experts, from Wilshire & Associates to Mohamed El-Erian in fact have clearly stated that they regard all financial assets as overvalued. So the idea that we are in the midst of a major bubble is hardly controversial, but as we also saw with the tech bubble, prices can get even more extreme before they go into reverse.
Second, it seems intellectually inconsistent to cavil about book value and then tout highly volatile market values as somehow superior.
Third, your comment about the $66 trillion, which from the chart is capital gains, utterly misses the point that those values are based on marginal trading. They are not a market clearing price. In addition, the gains were due in large measure to unsustainable practices: the Fed keeping interest rates in negative real yield territory, which fuels speculation rather than investment, and stock buybacks, in many cases funded by borrowing at those super low rates, a game that is at its end for most companies due to imminent or actual ratings downgrades.
I understand your points, but I’m still perplexed. Is national accountants’ end-2018 wealth tally ($123T in assets, $107T NW) not real wealth for its individual, family, and dynastic holders? And are the nominal holding gains that comprised more than 50% of that wealth accumulation not real?
We’ve only seen that asset measure decline briefly one time, in a single year (by $9T, 11%, based on $10T in capital losses), over more than half a century. 2013 alone showed $7T in nominal gains. Are you predicting an asset-market decline far larger than 2008? You could well be right…
2007 85,145,454
2008 76,094,696
2009 77,054,556
2010 81,163,561
2011 82,319,254
2012 87,486,599
2013 96,545,277
‘It’s important because it reveals a giant lacuna in economists’ understanding of wealth accumulation, the wealth of nations, and the relationship between wealth and “real capital.”’
Yeah, the lacuna being neoclassical economics conflating land and capital; by no means am I an accountant but doesn’t accounting omit the rentier and debt dynamic within the economy?
https://michael-hudson.com/2001/03/how-to-lie-with-real-estate-statistics/
https://www.bloomberg.com/news/articles/2018-04-13/economic-inequality-largely-boils-down-to-housing-inequality
The local restaurant that was worth a fortune but now bust – did the owners ‘own’ the land underneath the restaurant?
NC covered a paper by M. Hudson and D. Bezemer on formulating a more accurate accounting methodology last year –
https://www.nakedcapitalism.com/wp-content/uploads/2019/09/00-Hudson_FMM-Berlin-Conference-October2019__24september.pdf
It was all good energy. Now it is just the collapse of the wave function. ;-) The good news is that it can set up again and start over.
Yves, does the above way of accounting take into consideration value of a firm’s intellectual property? for example a software company might have book value of 100$ (servers, monitors etc) but how does IMA or GAAP for that matter value a firms non-tangible assets? (i.e. brand value, patents). it seems hard to put a number around those things.