Yves here. I’m sure we’ll see more articles of this type. This one is properly ambitious in trying to capture a wide range of Covid costs and effects.
By Eduardo Levy Yeyati, Dean, School of Government, Universidad Torcuato Di Tella, and Federico Filippini, Lecturer, Universidad Torcuato Di Tella; Chief Economist, MindY-Economic. Originally published at VoxEU
The long-term social and economic consequences of Covid-19 are uncertain. This column provides a preliminary assessment of the variation in costs across countries and regions, and suggests that developing economies will suffer the most lasting damage. The pandemic has exposed the differential capacity of governments to mitigate health and economic crises and to allocate scarce resources efficiently, while some labour market structures have inhibited government efforts to attenuate the pandemic’s impact – impediments that will also shape comparative recoveries.
According to the IMF´s latest World Economic Outlook (WEO April 2021), the pandemic recession is the deepest since the end of WWII, with a 3.5% output contraction in 2020, which represents a 7% loss relative to the IMF´s 3.4% growth forecast back in October 2019. More importantly, the consequences of the shock will likely be long-lasting. While the medium-term costs are still uncertain and vary significantly across countries, it is safe to say that developing economies will suffer the most. Whereas the IMF projects that the world GDP will be 3% lower in 2024 relative to the no-Covid scenario, the number doubles to 6% for the developing world despite the fact that the shock, as measured by Covid-related deaths, was more muted in low-income economies. In a recent paper (Levy Yeyati and Filippini 2021), we run a preliminary assessment of these long-term costs by countries and regions.
How Big is Big?
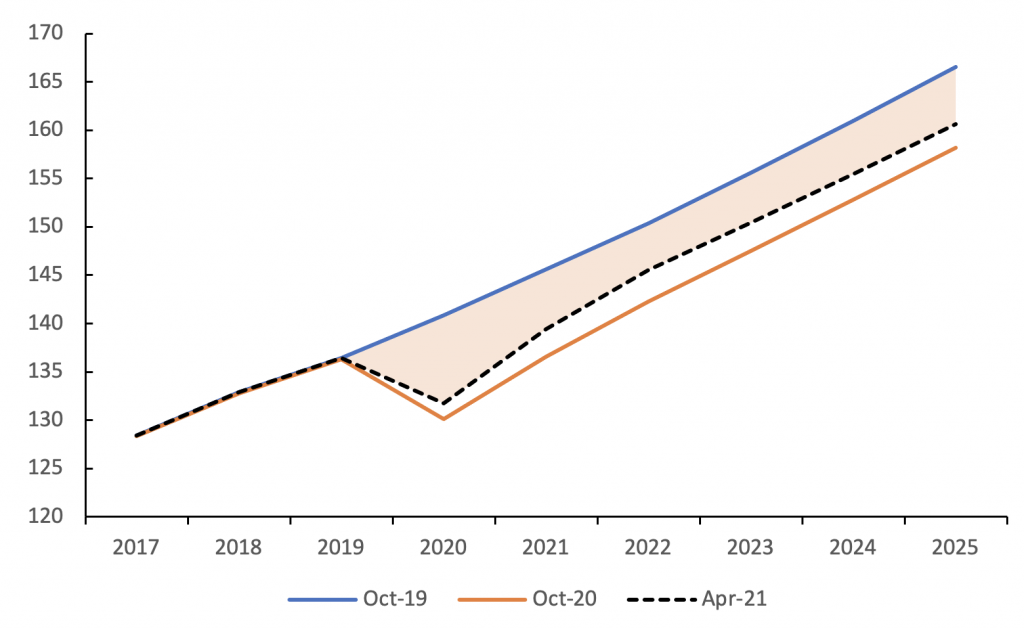
First, we compute the differences between the output paths for 2020–2030 projected before and after the pandemic (the shaded area in Figure 1) and estimate its present value discounting at a 0% real interest rate (a reasonably conservative assumption in a context where real rates are negative for most developed countries). This yields a total loss of about half of global GDP.
Figure 1 Global GDP projections (in constant USD, index 2017=100)
Next, there is the question of the fiscal stimulus (equivalent to 15% of GDP, according to the IMF fiscal monitor) without which the output loss in 2020 would have been much steeper. How much of the economic impact of the fiscal unwinding is properly accounted for in the revised growth projections (Beck et al. 2021), particularly given that a big part of the stimulus (6% of the 15%) was below the line (loans, equity stakes, guarantees) with a cost that is contingent on the speed and composition of economic recovery in each country? There is no simple answer here. Moreover, we are ignoring potential bouts of financial stress or debt restructurings in heavily indebted countries (Persaud 2021), as well as the second wave of stimulus already in line for 2021 in many advanced economies. All things considered, adding the full 15% of GDP as an indicative measure of the cost of fiscal support does not look unreasonable.
Third, there is the value of the excess deaths due to Covid-19. There is, of course, no uncontroversial way to put a value on human life. For the sake of argument, we follow a recent estimation for the US by Cutler and Summers (2020) that uses the ‘statistical lives’ value to place it between $10 million and $7 million per life. If we take the considerably more conservative $5 million per life, acknowledging that the statistical value may vary across countries, the cost related to the global cumulative deaths registered so far amounts to 16.9% of global GDP.
Fourth, we address education losses. School closures translate into a loss of human capital through a decline in both effective hours of schooling and retention ratios (Burgess and Sievertsen 2021). At a global scale, school closures affected 1.6 billion students at the peak of the pandemic (World Bank 2020b). Azevedo et al. (2020) estimated the lifetime loss in labour earnings for the affected cohort at $10 trillion, or roughly 12% of global GDP.
Table 1 Economic costs of the Covid shock (% of GDP)
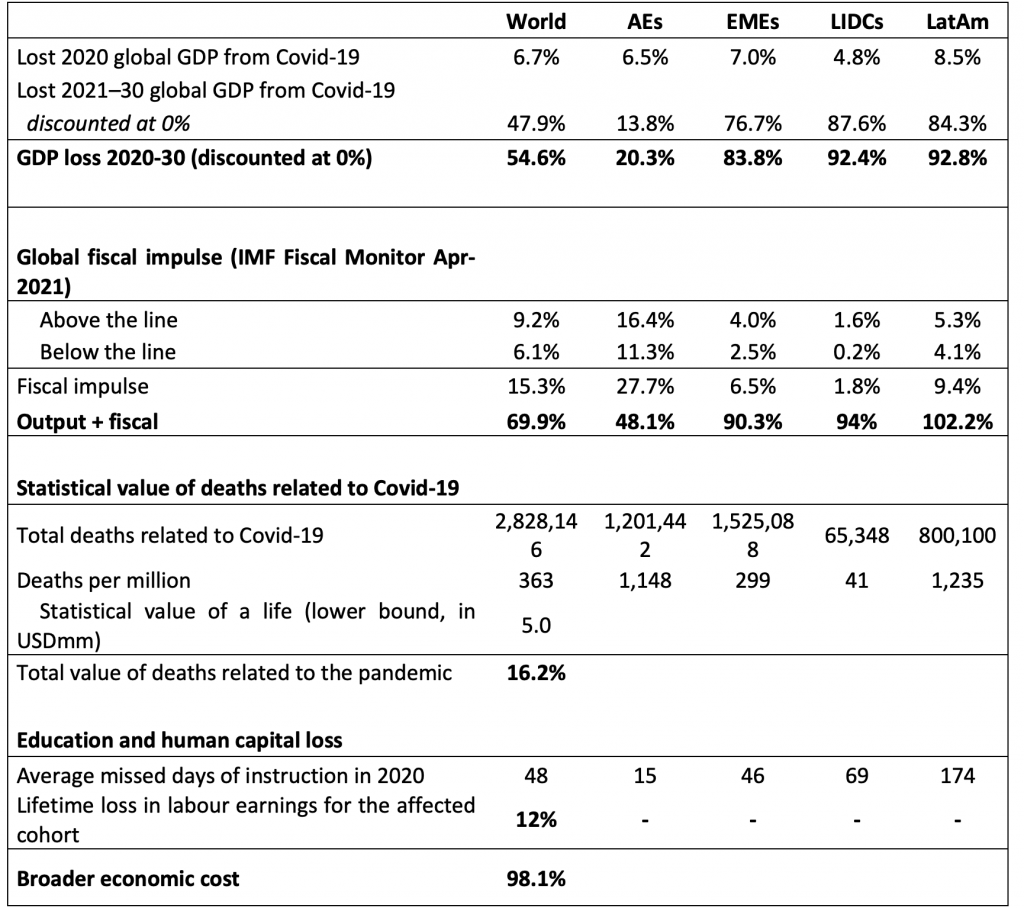
There are many other, harder-to-quantify losses: job and firm destruction (with its concomitant loss of job-specific human capital and the firms´ social capital and know how), untreated/undiagnosed illnesses, and psychological losses from social distancing, which can only be conjectured at this point. At any rate, taking all this into account, our estimated cost of the pandemic, roughly equal to 100% of global GDP in 2019 (see Table 1), should be regarded as a fairly conservative lower bound.
In a Sea of Averages, the Dwarfs Drown
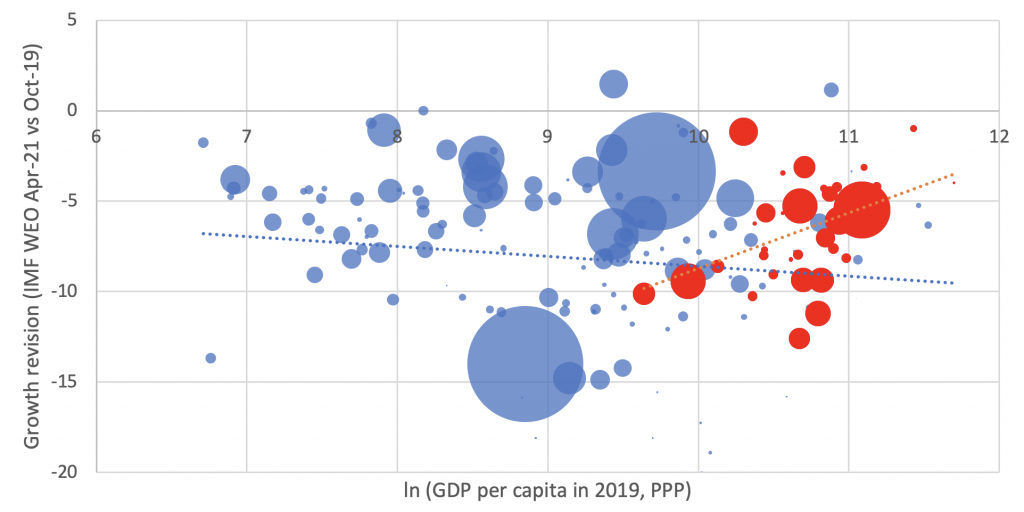
In a recent paper, Deaton (2021) highlights something of a silver lining. For all the relevance of superior initial conditions (state capacity, labour formality) to cope with the Covid shock in advanced economies, the output loss (as measured by the difference in growth projections before and after Covid) was larger in the developed world than elsewhere: 2020 output losses are slightly larger for high-income countries due to the higher virulence (so far) of the Covid shock in advanced economies.
Figure 2 Growth revisions and per capita income (areas proportional to population; advanced economies in red)
However, judging the relative costs solely by the 2020 downturn could be misleading, as it ignores the differential recoveries (Fornaro and Wolf 2021) and, more generally, the fact that many Covid-related costs will be long lasting. For starters, the comparison already changes significantly once we account for the fact that richer economies will likely recover better and faster this year and the next. Downward revisions to growth in 2021 and 2022 clearly favoured the global north.
Figure 3 Revisions to per capita GDP growth (Jan-2020 vs. Apr-2021 WEO forecasts, percentage points)
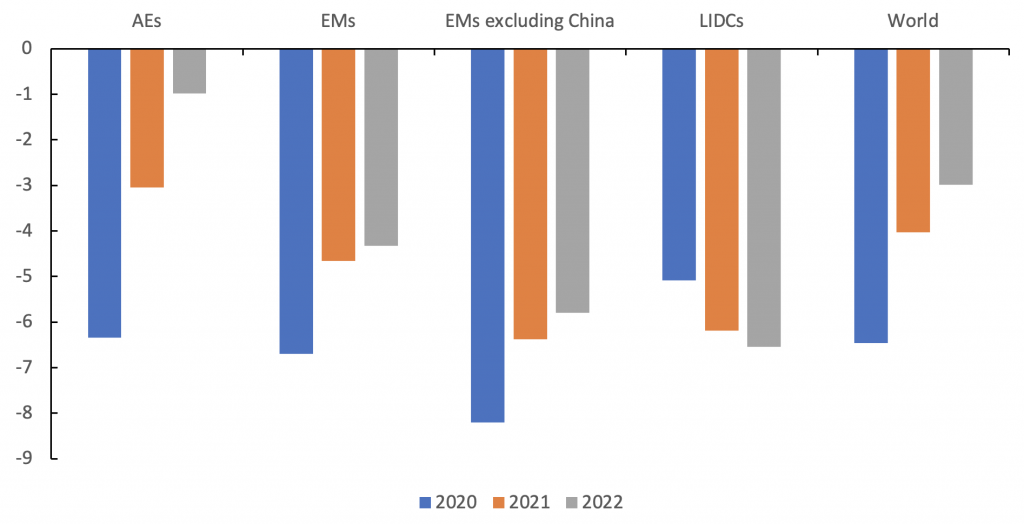
Reasons are not hard to find: better state capacity, stronger labour markets, preferred access to vaccines and, last but not least, larger fiscal packages funded by the issuance of debt at negative real rates, as we have noted here before. The pandemic, besides highlighting the traditional problem of the differential fiscal space to cope with the crisis via fiscal stimuli, revealed two other equally critical aspects: the capacity of governments to buffer the health and economic effect and prioritise and allocate its scarce resources efficiently, and the crucial role played by the labour market structure in inhibiting the government effort to attenuate the impact (Levy Yeyati and Valdes 2020). All of these handicaps will be at play in the comparative recoveries (Cárdenas et al. 2020).
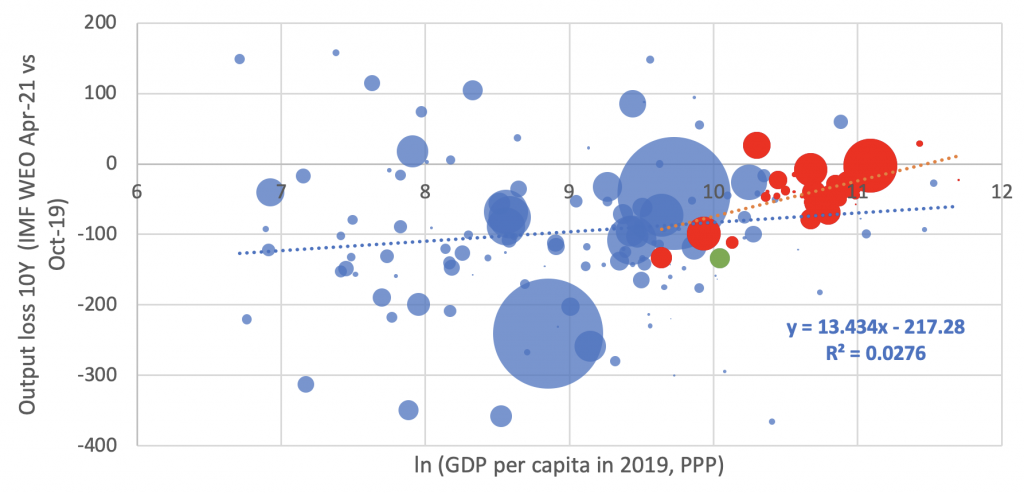
To illustrate how these losses compare across countries and regions, in Filippini and Levy Yeyati (2021) we run the previous Covid cost accounting by country and find that, even if the immediate output loss in 2020 was larger or smaller for developed countries than for advanced economies, that difference – and the absolute cost of the crisis – are dwarfed by the estimated ten-year loss. Predictably, the negative relation between the country´s income and Covid losses changes sign: both globally and within rich OECD countries, poorer countries fare worse.
Figure 4 Economic costs, ten-year window (areas proportional to population; advanced economies in red)
Source: Author’s calculation.
The regression coefficients also change sign. The relationship between the country´s income and Covid have a coefficient of -0.57 (t = -2.16) when considering only the short-term impact (2020); when we look at a longer horizon that includes the recovery path (2020-30), the coefficient turns positive and significant: +13.43 (t = 2.00). This result is robust to running a population-weighted regression, excluding China, or adding the fiscal stimuli. On the latter, the relationship strengthens when only below-the-line measures are considered (coefficient: +14.06, t = 2.19) and softens marginally when including the full stimulus (coefficient: +12.73, t = 2.33) reflecting the fact that advanced economies had a substantially larger above-the-line (debt-funded) fiscal response.
There are other, even harder-to-quantify factors that should be added to this account: job and firm destruction (with its concomitant loss of job-specific human capital and the firms´ social capital and know how), untreated/undiagnosed illnesses, and the psychological loss of social distancing. At any rate, the data indicates that the estimated global cost of the pandemic in Table 1 (roughly 100% of GDP) is likely to be a lower bound, and that the negative correlation with income is probably stronger than the one suggested in Figure 2 and Table 1.
See original post for references


Apropos of the above charts, I would love if all charts could be embedded with the code/data for plotting and the data. Yes, I know, not the fault of our gracious hosts, but I wish the culture around sharing data and findings would move to a more open scientific culture where such transparency was standard practice.
By way of explanation; a lot of these population/GDP-centric regressions would make more sense in the log domain. (For those not of a maths-y bent, logarithms tell you more about rates of change, orders of magnitude and proportionality.) All these charts and papers and coef tables are wonderful to have, but they look to be completely dominated by a handful of outliers that an appropriate transform might help account for. Least Squares is great until it ain’t, and unfortunately that casts a shadow on the interpretability of the coefs.
Not going to contest the overall findings, but it would be nice to poke them into a more robust space and see if the findings still hold up. In a way, they did the right thing by excluding China as it would have determined the estimate, but it’s still a key datapoint. Exclusion of outliers or, indeed, their very existence, suggests the underlying statistical model is poorly-specified.
Still, I didn’t have to do the work myself, and I’m very glad for the hard work of all authors involved.
My comments:
First, the lower bound for the value of a human ($5 million) may be resonable as an expresson of an ethical goal but is far too high as an economic estimate of value for most slow-growth “emerging” economies.
Second, the long-term cost of school closures could be even more devisive because the emerging economies of East Asia (China, Taiwan, Korea and Vietnam) have been less likely to have prolonged closures that India, Pakistan and Black Africa. My guess that in those “closed schools”, less educated countries we will see less female education and more social disruption by less upwardly mobile males. I’d love to know how the low-end garment factories which employ girls are doing.
Third, the chart with red and blue circles looks suspect. I don’t think the PPP ranges are really accurate or reasonable.
Fourth,we will probably see an end of or slowdown in immigration into democracies; the top 10% loves cheap labor, the bottom 90% doesn’t and will be more nationalistic and ready to “Vote the bastards out”. This will also favor small cities over huge, immigrant-dependant ones.
Finally, the “Let’s spend every dollar we make on social programs” crowd in the south (Brazil comes to mind) had no cushion for bad times… except for the IMF. So the IMF numbers may be special pleading, setting us up for “We need a huge special assessment- it wasn’t the fault of the governments”. The sucessful countries didn’t depend on the World Bank and the IMF; they read Marx on Capitalism and did it with internal savings. Economics may favor ethnically homogeneous countries with low levels of ethnic conflict and less democracy. Not exactly what we planned…
States which issue their own currency cannot “save” in that currency, so the notion of their not spending to afford themselves a “cushion for bad times” is faulty.
So Larry Summers and a Harvard colleague estimate US lives as worth between $7 and $10 million apiece… How did they reach these figures: value generated by the average American individual during the course of their life?