Yves here. Somebody has to do the unpleasant but highly valuable duty of taking the latest bit of Larry Summers bad policy advice apart. A bit of stimulus, supply-chain issues (particularly related to cars) and some catch-up spending and suddenly everyone is freaked out about inflation. For what it’s worth, I’m not seeing it in my spending categories. Confirming that anecdata occasionally have merit, this post confirms that inflation is spotty, as in pronounced in some categories, like the afore-mentioned cars, mis-measured in others, and tame elsewhere.
Many experts expect these sector-specific bottlenecks to get sorted out and for the apparent inflation to abate. However, Covid in India is expected to cause additional supply chain stresses, so we may see price pressures in other areas.
I’ve not seen it mentioned, but so-called hedonic adjustments have to be making matters worse. In electronics, historically led to price deflation. That more powerful, feature-bloated devices are treated as if there were priced at what they would have cost in the computer-equivalent of time immemorial. So the current price is a screaming discount compared to processing power cost in the day of, say, the Apple Lisa and is deflated accordingly.
But now due to chip shortages, new cars are being sold at established prices for that model, even though they are missing or have greatly degraded computer features like entertainment centers. Hedonic adjustments would treat the loss of features at the same price as inflation.
By Claudia Fontanari, Post-Doctoral Research Fellow in Economics, Roma Tre University; Antonella Palumbo, Associate Professor, Economics, Roma Tre University; and Chiara Salvatori, Ph.D. Student in Economics, Roma Tre University. Originally published at the Institute for New Economic Thinking website
With US consumer prices rising at 4.2% on an annual basis in April, the fears of those who have recently been predicting a sharp rise in inflation seem finally to have come true. Shortages of some commodities and some types of labor are fueling the debate about the possibility that inflation has come back to stay, making its way into expectations and forcing the Federal Reserve to change soon its current very expansive monetary stance.
The debate about inflation was building before the latest data releases. It was especially heated in February and early March, when the $1.9 trillion stimulus package crafted by the Biden administration was up for legislative approval. If in 2020 the initial reaction of economists and commentators to the dramatic recession induced by the pandemic was unanimous, with almost everyone urging immediate measures both of relief and stimulus, the first Biden package stimulated criticism and misgivings in various quarters. Some economists, like Lawrence Summers and Olivier Blanchard, were especially vocal in pointing out the dangers associated with the stimulus package later approved by Congress, fearing that another major fiscal effort on top of those enacted in 2020, would be much more than what would be needed to close the recessionary gap, thus causing overheating and potentially stoking long-dormant inflation. Others, like Paul Krugman, have judged these fears to be excessive. Based on the general consensus on the very flat slope of the Phillips curve in recent decades, he has noted that even an overheated economy would be unlikely to produce serious inflation.
The latest numbers, far from entirely confirming the former view, reveal instead a rather nuanced situation. The increase of prices in April comes 12 months after the biggest drop due to the initial impact of the pandemic closures – which automatically produces high numbers. Moreover, it seems to be concentrated in particular items and sectors (used and rental cars, airfares, commodities such as copper and lumber) where a combination occurred, possibly of short duration, of bottlenecks in supply and a suddenly increasing demand. Various commentators suppose the surge in prices will fade away later during the year or next year, at most, when bottlenecks are removed and activity brought back to normal in all sectors. Also, labor shortages seem to be very selectively concentrated in particular sectors, especially leisure and hospitality. Josh Bivens and Heidi Shierholz of the Economic Policy Institute note that what seems a huge increase in the wages of the workers in the leisure and hospitality sector (about 18% at an annualized rate in the last three months) has in fact simply brought back those sectoral wages, enormously affected by the crisis, to their pre-Covid trend. With an overall unemployment rate as high as 6.1 percent, a labor shortage is far from being a generalized phenomenon.
Officials at the Federal Reserve do not seem to be much worried, at least for the time being. They expected some increase in the rate of inflation associated with the re-openings, and bet that it will be transitory. Expected inflation as implicit in long-term interest rates, though increasing in 2021, is still quite moderate.
Whether the US economy runs a serious risk of inflation will become clear in the next months. But one aspect of the debate is crucial, and it has to do with the supposed relationship between the size of the fiscal stimulus and the inflationary pressures. The main argument of those who predict a resurgence of inflation is that the big fiscal stimulus, even assuming cautiously small values for the various fiscal multipliers and even allowing for some savings on the part of the recipients of public transfers, could boost actual output several times well beyond the output gap – the distance between actual output and potential output. The latter is inferred from the estimates and projections produced by the Congressional Budget Office (CBO), particularly in its last release of February 2021.
Commenting on the April inflation data, Summers once again scores “the amount of money we are putting in the households’ hands relative to the capacity of the economy to produce,” invoking a need for tax increases to cool down an overheated economy. Based on IMF estimates, according to which the US economy is projected to run above potential in 2021, Martin Wolfbelieves the Fed should raise interest rates. Evidently, the question of how reliable output gap estimates are is crucial.
Actually, the question mixes several different questions. It’s not only a matter of the reliability of estimates – after all, as remarked by Claudia Sahm, the long history of frequent revisions of the estimates of potential output should invite much caution in using them as a basis for policy. More basically, there is the question of what the official institutions and mainstream economics define as potential output, how they measure in practice such an unobservable magnitude, and whether there is any stable relationship between the estimated output gaps and inflation. We addressed such basic questions in Fontanari et al. (2020) (preceded by an INET working paper in 2019), where we not only reviewed the fundamental flaws of the standard conception of potential output and the standard estimation methods but also proposed an alternative notion and measurement. In a new INET working paper, we now take up the issue both by proposing a refinement of our own method and reflecting on the appropriate measure of slack in the US economy.
The Problems with the Standard Way of Measuring Output Gaps
The standard notion defines potential output as the level of output compatible with stable inflation, thus corresponding to the ‘natural’ or non-accelerating-inflation rate of unemployment (NAIRU). Supposedly, standard estimation methods identify such natural rate empirically by observing the behavior of inflation. In practice, the unemployment-inflation relationship has revealed itself as particularly irregular over time, up to the point of the apparent and puzzling ‘disconnect’ observed in recent decades (see Del Negro et al 2020). This implies that inflation data play in practice a comparatively minor role in the procedures for empirical identification of the NAIRU (see the critical analysis on European economies in Brooks and Fortun, 2020). The main role is played by the theoretical idea that deviations of actual from equilibrium unemployment only occur on a temporary basis, so that standard estimation methods are based on the implicit assumption that the NAIRU must be the trend component of the time series of the actual rate of unemployment. Once this is fed into the elaborate models used for estimation of potential output, the latter ends up being measured in practice as very close to the trend of actual output. The procedure has obvious implications: if actual output is affected by a deep and long-lasting crisis followed by a slow recovery, as happened with the Great Recession, the estimated path of potential output is dragged down automatically and the measured output gaps, after the initial period of the recession, soon become of the order of few percentage points. There is nothing wrong in assuming that a protracted slowing down of actual output may seriously affect the long-term growth prospects – indeed, this is one of the main tenets of the demand-led growth approach. Over time, unused resources tend to dry up and progressively disappear – fixed capital is not replaced, firms close down, labor skills become obsolete in the unemployed. But these phenomena happen over long periods rather than in few quarters and happen precisely as a consequence of persistentunderutilization. This means that big negative output gaps should be observable for protracted periods, a possibility that standard estimation methods rule out by construction.
Due to such excess sensitivity to the path of actual output, standard methods tend to underestimate systematically potential output and the output gaps, especially after a recession. The gross underestimation of output gaps for some European countries during the 2010s is something to which Blanchard himself has drawn attention in past works. But a further problematic feature of standard methods is that they produce output gaps that tend to be in fact poor predictors of inflation. The experience of the USA in the late 2010s may be instructive in this respect. According to the CBO’s estimates, the US economy has been in dangerous inflationary territory for years. Looking at real-time estimates, the unemployment gap (the difference between the actual rate of unemployment and the natural rate, a notion which is strictly linked to the output gap) has constantly been negative from 2017Q1 to 2020Q1, three full years. Yet, no uncontrolled acceleration in inflation happened in that period.
Instead, inflation has been oscillating around target, often below it. Figure 1 illustrates this. Even the multiple increases of the Federal Funds rate that the Federal Open Market Committee (FOMC) engineered from 2015 to 2018 were not justified on the basis of excessive actual inflation, but rather on estimates of inflation expectations and the presumption that very low unemployment rates would surely produce too much inflation later. Still more relevant, when the FOMC decided to lower the interest rates in July 2019, despite the estimated sign of the unemployment gap had been negative for 9 consecutive quarters, no appreciable burst of inflation took place. Inflation even declined in 2019Q3.
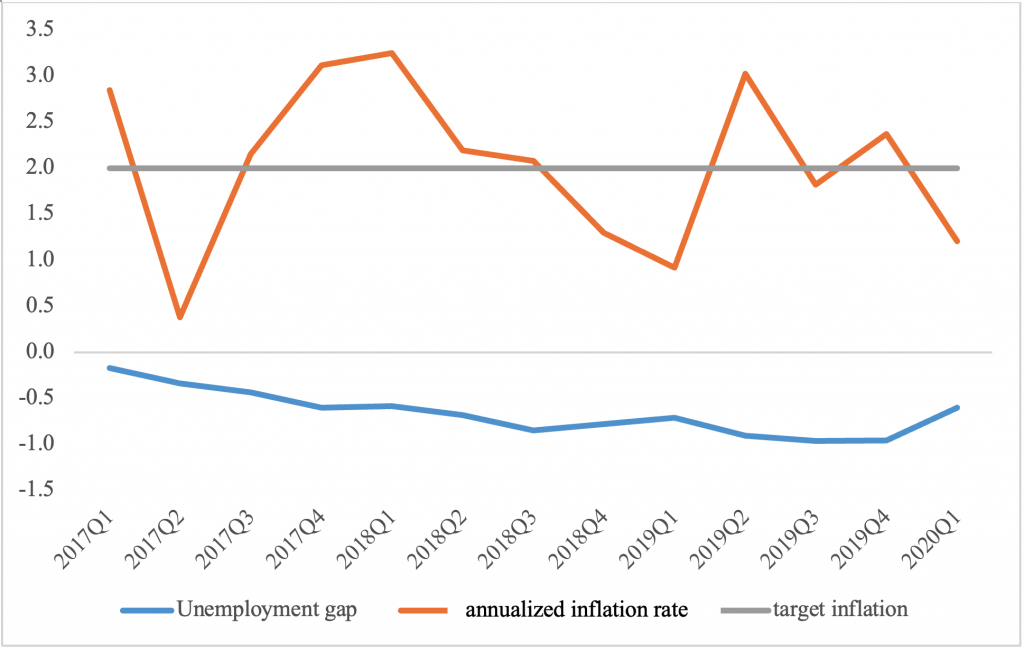
Figure 1. The unemployment gap and the annualized inflation rate in the USA – 2017Q1-2020Q1 Source: Our elaboration on CBO data
Clearly, it is not possible to base inflation fears on such flimsy measures because of their obvious failure to predict it or to be significantly correlated to it in the past. It is indeed ironic that measures of equilibrium unemployment and potential output entirely based on the definition of such magnitudes as the non-inflationary limit should prove in practice so utterly disconnected from the actual behavior of inflation.
Equally problematic is the uncertainty of the estimates of the output gaps and their variability across different agencies and institutions. Given that they employ different models to compute potential output – though all of them practically define it as some sort of trend component of actual output – and given the irregularity of the unemployment-inflation relationship in actual data, differences in model specification or in the value of particular parameters easily lead to different assessments of the output gaps. Uncertainty of estimates is well known since the same institutions producing estimates sometimes warn against putting too much weight on them (see for example Barkema et al. 2020).
To such traditional volatility and unreliability, the pandemic has added problems of its own, linked to the wild swings in economic activity and employment suffered by most economies and some practical difficulties in data collection. For its sudden and deep character, the pandemic recession has opened a wide output gap in 2020, but assessments of the size of the gap change quite remarkably across the different agencies.[1] Quite naturally, estimates also change as events unfold.
An Alternative Notion of Potential Output
It is not only a question of using estimates with more caution. The deeper problem lies with the notion itself, i.e. with the attempt at identifying a supposedly unique non-accelerating inflation rate of unemployment that in practice defies any quantification and the insistence in believing in a regular relation of some kind between unemployment and inflation that empirical evidence disproves. In our previous paper, we proposed to discard entirely the mainstream notion of potential output and turn back to the notion and measurement proposed by A.M. Okun in the 1960s, who defined and estimated potential output as an empirical approximation to a traditional Keynesian notion of full-employment output, understood as a sort of ‘maximum’ of production attainable in any given situation.
In updating Okun’s method and applying it to US data of the 1959-2018 period, we have shown that our measure is both immune to the flaws of the standard notion of potential output and consistent with the disconnect between inflation and unemployment so clearly borne out by empirical evidence in the last decades. Indeed, it entirely refrains from the use of inflation data, which implies that the deeply problematic Phillips relationship plays no role in it. It also avoids defining potential output as the trend component of actual output, allowing instead the opening up of sizeable, non-self-correcting divergences, in phases of slack, between actual and potential output. This reflects our theoretical idea, typical of the demand-side perspective, that no automatic mechanisms ensure the tendency of actual output towards potential.
What we propose, in other words, is to separate the analysis of inflation from the analysis of the level of unemployment, and to use the notion and measure of potential output to assess the distance of the economy from the full employment goal. The experience (but also the economic literature) of the last decades clearly shows the failure of models based on a strict link between activity level and inflation and the relevance of cost-push factors in determining inflation. This does not amount to renouncing the fight against inflation (if and when the April surge in prices becomes a true inflation process in the following months), but to renouncing the hypothesis that such a fight necessarily implies increasing unemployment and reducing the level of activity.
What Is Full Employment?
The measure of full employment is necessarily conventional, since allowance must be made for some amount of irreducible unemployment that inevitably characterizes even a very healthy labor market. Based on this, in our 2020 paper, we proposed to consider different values of the rate of unemployment as possible targets and showed that in all cases the output gaps computed with our Updated Okun Method tend more often to be negative and are bigger in size than those obtained by the CBO.
Yet, both the experience of the late 2010s and, more recently, the turmoil that the pandemic has caused in the labor market have shown clearly that the (official) rate of unemployment may be a highly imperfect indicator of labor underutilization. The very low unemployment rates of the late 2010s went together, in the USA, not only with a sluggish growth of wages but also with comparatively low participation rates, even in the 25-54 age range. In other countries like Germany low unemployment was accompanied by a reduction of individual working time for various categories of workers. If doubts could already be cast on the reliability of the unemployment rate as an indicator of labor underutilization in the long recovery of the 2010s, the dramatic events associated with the pandemic have only reinforced these doubts. The contrasting cross-national policy responses to the crisis, which in most European countries have taken the form of short-time work schemes, have meant that the (possibly analogous) strong reduction in the labor input in 2020 has had enormously different effects on the unemployment rates in Europe and the USA. Moreover, the pandemic has brought remarkable changes in participation rates and working time, implying a rather more substantial amount of slack, in most economies, than that recorded by the official unemployment rates.
Our new paper addresses such questions. In it we review possible alternative indicators of labor underutilization, starting from the ‘broad’ indicators of unemployment computed by the Bureau of Labor Statistics (BLS), which take into account such phenomena as discouragement in participation and part-time employment for lack of full-time opportunities. We test Okun’s law – originally a regular empirical relationship between output growth and changes in unemployment – with some of these ‘broad’ unemployment indicators (both for the United States and for a panel of OECD countries) and find confirmation of the general validity of the law, both across countries and with different indicators of unemployment
But these broad indicators, although likely to be better indicators of actual unemployment than the official rate, may fail to properly account for the full degree of slackness in the labor market. After all, such indicators hit historically minimum values in 2019, along with the official unemployment rate, while data on labor force participation and the subdued growth of wages pointed to the existence of margins for further expansion of labor utilization.
We thus explore, in the paper, other indicators of labor underutilization that take into account working time, so as to capture that kind of underutilization that derives from people working fewer hours than they would be prepared to work. The literature review brings us to propose a new indicator of the labor input based on hours worked, which we regard as a more accurate expression of the actual extent of labor utilization. This indicator, which we obtain by dividing the total number of hours worked in the economy by the working-age population,[2] we label ‘standardized hours worked.’ On testing Okun’s law with such an indicator, we find again confirmation of the validity of the law, both on a panel of OECD countries and on US data.
Output Gaps
In the final part of our paper, we offer estimates of the US output gaps. We focus on the last part of the 2010s and on a tentative assessment of the gaps opened up by the pandemic crisis in 2020. As a rule, we believe that all estimates of the output gaps – even our own – should be used with caution, due to the inevitable approximations and simplifying hypotheses that are implicit in the procedure (in any procedure). Especially real-time estimates may prove less than entirely reliable.
However, our calculations offer in our view some interesting insights. Our Updated Okun Method requires setting an appropriate target value for each indicator of labor utilization/underutilization, supposedly identifying a situation of full (or almost full) use of the labor input, against which potential output is estimated. Thus, in the first place, our calculations allow focusing on the comparative merits of the various indicators and their ability to correctly measure the quantitative dimension of labor underutilization. Due to the conventional nature of the full-employment measure, we may set different target values for each indicator, which implies that the measure of the output gaps varies according to both the indicator and the value chosen as a desirable policy target. This we regard as a positive feature of our method since it transparently links the extent of the gap to the policy objective and invites proper policy use of the gap notion.
In the second place, notwithstanding such possible multiple estimates, our method gives across all indicators uniformly wideroutput gaps than those calculated by the CBO or the IMF, thus revealing once more the strong tendency of standard methods to systematically underestimate the margins for output expansion. Particularly wide is the gap revealed by our indicator of standardized hours worked, pointing to the relevance of the time-related dimension of labor underutilization both in the long recovery of the 2010s and in the pandemic crisis of 2020.
The latest data on the labor market in the USA show a slowing down in the pace of recovery, with a slight increase in the unemployment rate and 8 million jobs still missing with respect to the pre-pandemic period. Not only does the unemployment rate still linger at 6%, well above the pre-pandemic level, but data on participation (particularly on women’s participation, doubly hit by low wages and lack of affordable child care) reveal how such figures grossly underestimate potential labor reserves. Current inflationary pressures are likely a temporary phenomenon, linked to the peculiarity of the pandemic crisis and the bottlenecks it has produced. Even if they are not, it is not an excessively tight labor market or a too rapid filling (or even overshooting) of the output gap that is to blame. If anything, the pandemic has reinforced the disconnect between unemployment and inflation already well established in the literature. The more relevant risk remains that of taking too seriously the official measures of the output gap, thus neglecting both the actual extent of slack that they are not able to reveal and subtracting vital stimulus and much-needed relief from a still suffering labor market. This would cause slow growth and stagnating demand, which, as past history has shown more than once, do not only produce underutilization and distress in the short period but also create long-term damage to growth.
____________
[1] For example, the International Monetary Fund (IMF), in its World Economic Outlook of October 2020, calculated that the output gap in 2020 would be -3.2% for the USA (the figure is confirmed in the IMF’s WEO of April 2021), while according to the Economic Outlook of the Organization for Economic Co-operation and Development (OECD) of December 2020, it would amount to -6.0%. A still wider discrepancy regards the UK output gap, estimated at -4.4% for the IMF and -8.9 for the OECD.
[2] The ‘standardization’ ensures that the indicator is not influenced by the changing size of the economy. We actually build two different indicators, since the working-age population may be defined, alternatively, either as the population between the ages of 16-64 or as the whole population of 16 years or more. See the paper for details.
See original post for references


Personally I disagree with the term “Stimulus” because it has so many antiquarian ideological trip wires. Per se a more honest term is “investment” by the polity aka the state to make up or to transition to a new economy which provides opportunity for all and deals with various environmental and geopolitical factors.
The other consideration its the term “labour market” forced un-under employment in my mind is not a market of any sort and the only way it will ever be a market is if anyone that wants to work can get a living wage job.
After the 1930s they could analyse what had gone wrong.
http://delong.typepad.com/kalecki43.pdf
The main issue is control; and the private sector like to be in control.
Unfortunately, the private sector doesn’t really do anything when times get bad, but they still don’t want the Government to do anything either.
The only thing they will tolerate is military spending, and this is how fascism develops.
Governments are back in the hot seat again driving the economy.
They need to nip this in the bud before anyone gets used to the idea.
After 2008, Governments used fiscal stimulus to aid recovery.
Then the scare story started to circulate.
You will end up like Greece if you carry on with fiscal stimulus.
Governments cut back on fiscal stimulus.
Analysis showed this was false; you couldn’t end up like Greece if you had your own currency (MMT have worked this out).
The scare story may have been false, but it did the trick.
What can they think of this time?
The inflation bogey man is coming to get you.
The UK’s Daily Telegraph is really going to town with inflation bogey man articles.
It is a right wing newspaper.
Yes, Ambrose Evas- Pritchard has had three articles, in succession, with apocalyptic headlines about inflation ;
“Markets losing Ffederal Reserve’scredibility” (13 May)
“Fed really will cause inflation this time” (11 May)
“US inflation fears mount as Fed monetises Joe Biden’s deficits” (7 May)
Yves, before getting into your post, a couple things. First, cars drive so much of the economy. If there is a shortage, first we will have a shortage, then wont we have a down point once they run out or buying settles? Further what about gas prices? Premium is nearing $4 a gallon. I can see overpriced autos affecting other parts of the economy. What about heavy construction equipment? But on the other hand, auto prices wont hurt businesses who need trucks and such because they will just take accelerated depreciation & a higher price means more depreciation expense, thus reducing tax expense.
Also, i read the other day, everything from China is starting to show shortages. Bicycles are selling at a premium due to shortages.
Inflation is a regressive tax, we should not be so quick to dismiss it. How many years of higher inflation are we willing to tolerate to hopefully arrive at a low-slack labor market? And once we’ve reached that point will real wages meaningfully increase or will corporate America simply accelerate automation, offshoring, etc?
We run a risk of unleashing inflation on those who can least afford it while we chase some dream of a tight labor market, which hasn’t been a reality for decades. We can do better.
This is very confused IMO. Inflation is inflation and taxes are taxes. Starting equalling both concepts makes the rest unreadable. Econodiocy?
Semantics. Less-wealthy people spend more of their income on consumption, especially of basic goods. Therefore inflation is more costly to them than to others. Inflation is a policy choice with a regressive incidence of financial burden. Same conclusions apply.
Did you read the piece? It looks like not, which is a violation of our site Policies. Inflation is confined to a few sectors like cars. Low income people buy cars with less frequency than higher income people.
Yes i read the piece. For a high-earner a car purchase is trivial. For the bottom of the income-distribution it can represent months of after-tax earnings (additionally, used cars are inflating more than new cars). Not to mention car parts, which are also inflating. The next inflation shoe to drop will be housing when owners-equivalent-rent catches up with market-based rents…also disastrous for the bottom of the income distribution.
Obviously we’ll get more info in the coming months. If it truly is just cars and a few items like lumber we should see a fairly quick reversal in inflation and I will stand corrected.
“months of after-tax earnings”?
Wow. I suspect that either “the bottom of the income-distribution” is much lower than that, or perhaps I do need a pay rise.
That inflation disproportionately affects the less wealthy is a strange claim.
First of all, inflation favours debtors and hurts lenders — which of these two groups is less wealthy?
Second, the “store of value” function of money is hurt by inflation, so those who have more money fear inflation more than those who never have enough to save any in the first place.
Finally, all the “zomg! inflayshun!” stories in the press are a tell — the press (clearly NOT owned by the less wealthy) always favours the views and fears of the rich. A recent study came out with empirical evidence that the vast majority of press coverage of the economy focuses on the interests of the rich — which ought to come as no surprise in a country where policy consistently reflects the interest of the wealthy.
Sorry, but no — the less wealthy are always living hand to mouth, so inflation is NOT their primary concern.
Inflation favors debtors only if your income is outpacing the inflation rate.
The biggest debt for most is the mortgage that probably represents 30% of household expenses. If inflation is 5% , meaning the other 70% of household expenses are increasing at 5%, and your wage in most cases is not keeping up with 5% inflation, I would like to know how is inflation helping the poor?
The poor still has to make his mortgage payments but on top of it has to pay 5% more for the rest of 70% expenses?
I would like to see the math behind your conclusion that inflation helps the poor.
Even in the event of hyperinflation where the mortgage will become worthless in current dollars, the poor will still be bankrupt as it will incur a capital gain tax liability (house sells for $5 billion) he can’t pay because it’s the rich and connected who have first access to freshly printed money, aka cantillion effects.
Some say that some inflation is a good thing, even acting as an automatic stabilizer because it causes debts to shrink. And because the lower and working glasses tend to have a higher percentage locked up in debt, inflation has a way of reducing the debt burden. What has been called “debt deflation.”
But evidence suggest its not that simple. 1. The debt sector isn’t inflating. It’s the supply chain that is experiencing shocks, which is causing price inflation. And this impacts the poor and working classes. That is also why TPTB doesn’t seem all that worried about inflation. 2. Debt deflation is the ultimate bogie man in corporates and government circles. So a lot of policy has been set in place to combat it. Their are variable interest rates and assorted fee structures that compensate. Law #2 of neoliberalism – you never take debt from poor people. Thall shalt not abide the evils of debt deflation.
*Sigh* This is not generalized inflation. I know the plural of anecdote is not data, but I haven’t seen much at all in the things I buy. So your exposure very much depends on your consumption profile.
Can you name one single item that hasn’t gone up significantly in price compared to pre-covid, and I mean significantly more than 5% not the joke that is the CPI calculation.
I dont know what kind of shopping you do but I can tell you that for a family of four with kids in high school and going through college, CPI is vastly under reporting the price increases.
Wages.
Also outdoor exercise, and general fitness.
*Sigh* ? Pull up a few charts and have a look at the price of iron ore, copper, nickel, zinc, aluminium, tin, oil, gas, wheat, corn, soybeans, sugar, coffee, lumber etc. etc. etc. – basically the price of everything we eat or use to make and run stuff, including all the flavor of the month solar panels, wind turbines, EVs, batteries etc. etc. etc. And what about the cost of education, health, insurance, utilities etc. This sows the seeds for classic “cost push” inflation. Businesses raise prices to cover the higher costs. Minimum wages are raised and workers demand higher wages to cover higher prices, and so the wheel turns. The last time soft commodities rose like this, the “Arab Spring” followed!
In addition to hedonic adjustments, consider also the Cantillon Effect, which postulates that inflation starts closest to the money spigot and spreads from there. First artificially low interest rates and freshly printed money benefit the banking system and the elite and inflate asset prices, particularly stocks and real estate. Rising asset prices increase inequality by stealth, even without general price inflation. From there, the money flows outwards, like the ripples from a pebble thrown into a pond. Printing more money for direct payments to households and any future UBI will just add further fuel to the fire.
The article notes that “Officials at the Federal Reserve do not seem to be much worried”, which I take to mean that significant and rising inflation is now a virtual certainty! If you haven’t seen it in your life yet, be patient, because it’s just a matter of time.
No matter how many features are a car has, it loses value as soon as you drive it off the lot.
And, considering that for many wages haven’t kept up…cars are overpriced.
When it’s pointed out that wages for most suck, people are told inflation has to do with money supply. When there’s concern about supply, people are told wage suppression will keep inflation down.
Tremendous borrowing and fear of popping those prices for homes have people not wanting to see a lot of stuff.
NC’s shopping categories obviously do not include DIY home maintenance. Take a walk through your local Lowe’s or HD and you will see prices for many building materials are 50-100% higher than past years with lumber up by 3-4X. As a prior commenter noted in relation to auto prices, construction is a big business so increased costs there will feed through to higher prices elsewhere.
so…”thanks Obama!”?
Actually, Trump’s tariffs on Canadian lumber might have a bigger effect.
Meanwhile, lumber is a relatively small portion of building costs (2.5% – 8% is my calculation). A U.K. study says 80% of price inflation in real estate is related to land (which no longer deserves separation as a component of production in neoclassical economics).
So…meh!
Might want to take a look at copper wire price, as well as lumber. It also appears to have doubled or tripled in cost.
Yes, lumber, gasoline, food, automobiles, prices for lawnscaping/maintenance, home additions, homes, rent, utilities and the like have all gone up. Nah, there’s no inflation according to Larry Summers and the Fed. They only care about wage inflation not price inflation. People on limited income are having a tough time.
I haven’t seen much and I do the shopping. I haven’t even seen much in restaurant items.
https://www.ers.usda.gov/data-products/food-price-outlook/summary-findings/
I used to go to 4 restaurants most of the time pre-covid and had my one special dish I always took in each of them.
As they opened post-covid, I checked them out and all of them have increased their prices by 15%, 12% , 18% and 22% and I have the receipts to prove it. Nothing changed to the dish.
Of course its anecdotal but I keep detailed records of my expenses and every single item I buy for my household has increased significantly (more than 5%) since last year, if you can find it sometimes.
Inflation is only a problem if people don’t get extra money to pay for it. Under general demand-pull inflation, it is almost associated with tighter labor markets and rising wages, so it is largely a wash, and its debt-deflating qualities make it a net slightly progressive phenomenon for most (not all) non-wealthy folks. Which is why conservatives (the rich and their lackeys) are so dead-set against inflation–they certainly wouldn’t be if it were regressive!
Post-Covid inflation is especially not a problem because of the stimulus. The average bottom-80% household got $4800 in extra cash during covid. If they kept their jobs, and their mean household income was say $64,000, that’s a 7.5% raise, minus say 4% (annual average, not the first few months of re-opening) inflation, and almost everybody comes out 3.5% ahead (not behind). The smaller your income, the bigger the percentage raise, and the more ahead you come out–helicopter money is by definition progressive, not regressive.
If they didn’t keep their jobs, they got much higher unemployment compensation than normal, and most are soon likely to get their jobs back with the re-opening. [These extra labor costs are one reason to expect some inflation during the initial re-opening.] But nobody who gets their job back (a raise of thousands of percent) will complain about 4% inflation over the next year as the price to do so.
Finally, almost all the people above SAVED a substantial amount of money during covid, simply because there was nothing they could spend it on socially–services and entertainment and travel disappeared, which most people spend a fair amount of money on. They will now start to spend some of those savings, which increase in demand naturally drives a mild hike in inflation, but they won’t spend all of it unless they have plenty of money to do so (in which case no need to worry about them.) So most still come out net winners with respect to inflation in this aspect, as well as in the aspects above.
Yes, a fairly small group will have through their own particular circumstances have come out net losers, but that was because of covid itself–the worst disaster since WWII, so there’s going to be some damage. The US govt. should have done much more to alleviate all such damage, but viewing some minor, partial, and natural post-covid inflation as some sort of big problem, when most people have come out ahead, doesn’t make much sense.
If the govt. simply left in the extra unemployment benefits another year, but on a steadily decreasing basis, at the end of that the number of folks who had been economically significantly damaged by covid would be quite small–again, not a big problem considering we underwent the worst catastrophe since WWII.
Inflation hurts first and foremost the poor and the middle class, you are misleading the readers. The rich have assets, they will only get richer, albeit nominally.
Sorry, but Paul is correct — see my response to effem.
I shop the perimeter of the store and still use the same benchmark prices I’ve used for at least a few years. Chips and packaged food are somewhat divorced form the price per pound so for instance the snickers bar of my youth had to be twice as big as it is now and certainly did not cost as much but that’s not a new phenomenon brought on by covid.
Some things like lumber are subject to hysteresis
From way back machine, although there are more recent examples
“Hysteresis, a term borrowed from physics, is the idea that short-run shocks to the economy can alter its long-term trend. One example of hysteresis is workers who lose jobs in recessions and then are not drawn back into the labuor[sic] market but rather permanently locked out, therefore increasing the long-term unemployment rate.”
from https://www.nakedcapitalism.com/2016/12/macroeconomics-in-the-crossfire-again.html
In the current case the employment and subsequent production came to a halt, but now is starting up again so pretty much demand driven price increases that in theory should not last as prices will curtail projects and supply rebounding will supposedly lower prices.
As an estimator for a large general contractor… its not just lumber, these following suppliers will not hold pricing for more than a week or have already been subject to multiple price increase since last fall:
– wire
– any steel products
– roof top units
– appliances
– tile
– any material from another country
– paint
– PVC products
– rebar
– finished wood products; trim, doors, cabinets
– pretty much everything else!
I do feel most of it is logistical issues like you mention in the article but it is to the point where owners are either cancelling projects or putting them on hold. That is where it starts to get scary… projects as a whole are +15% more expensive than 6 months ago. I’ll take a bet that people arent going to get a raise to match that increase either!
Me too. RV parks, self storage, restaurant meals, beverages, hardware, oil change, mail forwarding in my world. Glad some have not been affected, but I think in 6 months at least some of this will show up in the data. We’ll see, unless it all gets edited out or never counted.
My shopping categories do include DIY home maintenance and yes I do see price increases in materials. Case in point, I need to replace a hot water heater. Checked the price of a 40 gallon gas water heater at The Home Depot a couple of weeks ago and it was $399.95. Looked at it last Saturday, it was $439.95, an increase of 10%. With all of the armchair Federal Reserve chairmen running around with their hair on fire shouting that the Fed is destroying the dollar and turning the US into Weimar Germany or Zimbabwe, they would say “there’s the terrible inflation”. Do they know if this just isn’t Home Depot taking advantage of the situation and raising the price simply to make more money under the cover of the belief by many that runaway inflation is being caused by the Fed’s reckless money printing.
Take lumber. There is plenty of timber in the southeast but not enough mills. The situation is reversed in the northwest. Not enough timber but plenty of mills. It will take some time but the price signal will take care of the mismatch. This is not inflation from the standpoint of an economist.
Being an inveterate DIYer, a truck is a necessary tool for me. I bought a ’97 F150 XLT new that I paid $15,000 for. I read recently that someone paid $24,000 for a similar used truck. Is that inflation? To replace it with a new model, the price would be around $45,000. No inflation there because hedonic adjustments tell me it is a much better truck even though it would do the same job.
I would very much like to be proven wrong about this, but it is my opinion that we’ve been treated to an organized effort by the Wall Street, federal government, some prominent economists, the central bank, and media to spin a narrative of economic recovery and reflation. It seems to gradually be losing steam as the effects of federal fiscal stimulus dissipate and monetary policy to suppress rates and drive up financial asset prices to generate economic recovery through a so called “Wealth Effect” have been disappointing for the majority of Americans. I read a definition of depression yesterday evening that I feel aligns with our broad experience since the GFC in 2008:
… “A depression is not an unrelenting contraction or an uncommonly severe recession, It is the prolonged absence of upside and advancement where economic opportunity, recovery, and reflation are repeatedly denied, deterred, and deflated.”
It seems to me the monetary and economic policy prescriptions that have been applied to date are not yielding the desired results, assuming economic growth is compatible with policies to address climate change. Statements last week by a couple of CEOs at large banks regarding their respective decisions to raise their minimum floor on wages are constructive in my view.
Excellent observations. Really, then house of cards on the economy/covid recovery is falling apart. In my opinion, poop will hit the fan when the Eviction Moratorium ends. Based on comments by Fauci, this will end sometime in June. We can expect a huge mess then has borrowers and landlords default across the summer, creating a major economic meltdown at the end of the year in October or November. Just like the original ’29 crash.
On the same idea of 1929, back then a big problem for auto companies was that Americans weren’t buying enough cars, and there were too many used cars causing car prices to be abnormally low. I think this is the case again, with increasing new car prices used as a cover for larger economic problems within auto mfg’ers. I also think the phone industry will have a similar reckoning, fact is there’s so many used phones on the market (even sell-your-phone kiosks at Walmart) where new production might be untenable.
Time will tell as my thoughts are just speculation.
The unnerving quality of inflation is that no one knows anything for sure.
How much your money is overvalued, how much your prosperity is illusory, how much of your work is useless and would not even exist in conditions of stability.
All standards are lost.
If there is any lesson to be learned from a study of inflations, it is that one never knows where he is in the midst of it, but he certainly is not where he appears to be.
The same applies to deflation.
Deflation has a lower bound. Zero.
Inflation has no upper bound.
Perhaps I’m not getting what you mean, but zero would be the upper bound of deflation.
Also, hyperinflation is not simply very high inflation, it requires extra structural crises in supply.
Isn’t deflation a negative number?
“the turmoil that the pandemic has caused in the labor market have shown clearly that the (official) rate of unemployment may be a highly imperfect indicator of labor underutilization. The very low unemployment rates of the late 2010s went together, in the USA, not only with a sluggish growth of wages but also with comparatively low participation rates, even in the 25-54 age range.”
U3 is not reflecting the reality of the job market.
“The contrasting cross-national policy responses to the crisis, which in most European countries have taken the form of short-time work schemes, have meant that the (possibly analogous) strong reduction in the labor input in 2020 has had enormously different effects on the unemployment rates in Europe and the USA. Moreover, the pandemic has brought remarkable changes in participation rates and working time, implying a rather more substantial amount of slack, in most economies, than that recorded by the official unemployment rates.”
PR went up 2 tenths of 1% in April; however it is still lower than what it was pre-December 2019. 2001 PR exceeded 67% and dropped. (Repubs were blowing smoke as ~ 440,000 workers rejoined the Civilian Labor Force as either employed or looking for work).
By 2008, PR recovered most of its ground.
Today, we are sitting at a PR of 61.7 which is up 2 tenths (seasonal). There appears to be a great amount of slack in the Civilian Labor Force consisted of Employed and Unemployed. U3 does not capture the slack or the true unemployed. https://data.bls.gov/pdq/SurveyOutputServlet
Repubs need someone to blame and workers are it. It has only been a couple of months in the recession of the pandemic. More will come back. Slack in the Labor Force makes it harder to enforce low wages.
And yes women are home watching children until schools reopen.
My $.02
Yup. For a better indicator of labour slack look to the U6.
eg:
True.
Other than economists or people who salivate at the numbers, who talks about U6? U3 is a popular meme and is simple to repeat by the newscasters. If only they had to explain it and how it is derived.
Sorry, I did not proof read and my thoughts are kind of scattered.
The article deserves a better survey than what I gave to it.
I understand the concept, but have trouble with the ideas in practice. I think Einstein’s point in his theory of relativity, that the velocity depends on the reference frame, is also applicable here. Generally the frame of reference you will choose is the one your in, which works great for anyone else that is in your reference frame and most people choose the dollar itself, but since there seem to be no Einsteins in economics we don’t have an equivalent formula to shift between reference frames. Commodities and services are intimately linked to space and time, thus an orange in Florida is not the same as an orange in Nebraska in the middle of winter, even if it is the same orange. I have no doubt the dollar has been loosing purchase power since the treasury lost control to the Fed in 1913 and at an even greater rate when the Fed lost control to derivatives market ,”Eurodollars”, in the late 60s. Banks create the vast amount of “dollars” via credit or derivatives there off, the Fed can do asset swaps, but at the moment can’t print dollars only reserves, and the treasure only prints a small amount of cash and borrows the rest (see Richard Werner) thus the expansion of the money supply is dependent on the banks and a large part of that is offshore and unregulated, thus not quantified. Currently the large banks mainly provide credit for the large institutions, particularly the financial institutions (that is where the profit is) so that is where most of the expansion is occurring. Jeff Snider does a great job of reading the tea leaves (TIC data) to determine what is happening in the Eurodollar market and doesn’t see an increased rate of “money” growth (see eurodollar university). Of course, because we have a just in time supply network that is efficient, but not resilient it doesn’t take much of a shock to throw everything out of wack and if you’ve ever played the supply chain game it is crazy difficult to get all the suppliers inputs and outputs matched up again because all the feedback loops are out of sync with one another. For the items I buy it seems the ones that are rising the most are those controlled by monopolies, some foods, healthcare, education, cars, etc. Matt Stoller does a great job of point out how pervasive these have become. Who knew Bain Capital has a monopoly over cheerleading? Isn’t there some saying about judging a society by how it treats it children? Then again with a plan to grow at 2% a year we are planning to double what we consume as a society in 35 yrs, that is double from the beginning of humanity! (see Dr Albert Bartlett’s lecture for the math)
No in the West has really had any idea what they are doing for an awfully long time.
How can we kill growth?
Try copying Japan.
Japan led the way and everyone followed.
At 25.30 mins you can see the super imposed private debt-to-GDP ratios.
https://www.youtube.com/watch?v=vAStZJCKmbU&list=PLmtuEaMvhDZZQLxg24CAiFgZYldtoCR-R&index=6
What Japan does in the 1980s; the US, the UK and Euro-zone do leading up to 2008 and China has done more recently.
The PBoC saw the financial crisis coming unlike the BoJ, ECB, BoE and the FED.
“Oh dear, we did what you did in Japan. Now we’ve had a financial crisis and are facing a Great Depression just like you.” US, UK and Euro-zone policymakers in 2008.
Japan could study the Great Depression to avoid this fate.
(The US had done the same thing in the 1920s (see graph above), it always seems to happen with neoclassical economics)
https://www.youtube.com/watch?v=8YTyJzmiHGk
How did Japan avoid a Great Depression?
They saved the banks
How did Japan kill growth and inflation for the next thirty years?
They left the debt in place and the repayments on that debt killed growth and inflation (Japanification)
No one knew why austerity was the worst thing you could do in this situation.
The IMF predicted Greek GDP would have recovered by 2015 with austerity.
By 2015 Greek GDP was down 27% and still falling.
The money supply ≈ public debt + private debt
The “private debt” component was going down with deleveraging from a debt fuelled boom. The Troika then wrecked the Greek economy by cutting the “public debt” component and pushed the economy into debt deflation (a shrinking money supply).
Greece was pushed into a Great Depression type event by the Troika.
We don’t understand the deflationary forces we have unleashed, and so do tend to worry unduly about inflation coming back.
Japan has hardly seen any inflation in thirty years.
In 2008 the Queen visited the revered economists of the LSE and said “If these things were so large, how come everyone missed it?”
It’s that neoclassical economics they use Ma’am, it doesn’t consider private debt.
1929 and 2008 stick out like sore thumbs.
https://www.youtube.com/watch?v=vAStZJCKmbU&list=PLmtuEaMvhDZZQLxg24CAiFgZYldtoCR-R&index=6
At 18 mins.
The economics of globalisation has always had an Achilles’ heel.
The 1920s roared with debt based consumption and speculation until it all tipped over into the debt deflation of the Great Depression. No one realised the problems that were building up in the economy as they used an economics that doesn’t look at debt, neoclassical economics.
Not considering private debt is the Achilles’ heel of neoclassical economics.
That explains it.
When did the UK start using neoclassical economics?
Hint: Not considering private debt is the Achilles’ heel of neoclassical economics.
https://www.housepricecrash.co.uk/forum/uploads/monthly_2018_02/Screen-Shot-2017-04-21-at-13_53_09.png.e32e8fee4ffd68b566ed5235dc1266c2.png
Hard, isn’t it?