Yves here. As readers may have worked out, even at my days at McKinsey, I was a big fan of qualitative analysis. One big reason is that once you get outside transaction data (X sold at Y price on Z date), most quantitative data is “squishy” because it depends on the conditions under which it was collected, but those who handle that kind of information tend to forget its limitations. This is an even bigger in business than in economics. As we explained in our 2006 Conference Board article, Management’s Great Addiction:
Corporate America is ob-sessed with numbers. Analyst meetings focus on earn-ings expectations, revenue growth, and margins rather than business fundamentals. PowerPoint presentations look naked if they lack charts and graphs to buttress their three-point message. Lofty corporate mission statements are often trumped by pressure to “hit the targets.” Job applicants are advised to stress tangible achievements and, above all, to quantify them. And the ultimate sign of a trend past its sell-by date: a January 2006 Business Weekcover story, “Math Will Rock Your World.”
This love affair with figures increasingly looks like an addiction. Numbers serve to analyze, justify, and communicate. But they are, fundamentally, abstractions. When numbers begin to assume a reality of their own, independent of the reality they are meant to represent, it’s time for a reality check. Some are already frustrated with the trend: In a recent McKinsey survey of more than a thousand public-company directors, most said they wanted to hear less about financial results and more about things not so readily quantified, such as strategy, risks, leadership development, organizational issues, and markets.
Metrics presuppose that situations are orderly, predictable, and rational. When that tenet collides with situations that are chaotic, non-linear, and subject to the force of personalities, that faith—the belief in the sanctity of numbers—often trumps seemingly irrefutable facts. At that point, the addiction begins to have real-world consequences.
In an important Nassim Nicholas Taleb paper I came across much later, The Fourth Quadrant, he identifies describes phenomena that are unsuited to statistical analysis. I was lucky enough to see him speak about it in 2009. From my writeup:
…his “fourth quadrant” construct. He sets up a 2 by 2 matrix. On one axis is phenomena that are normally distributed versus ones that have fat tails or unknown tails or unknown characteristics. On the other axis is the simple versus payoff from events. Simple payoffs are yes/no (dead or alive, for instance). “How much” payoffs are complex.
Models fail in the quadrant where you have fat or unknown tails and complex payoffs. A lot of phenomena fall there, such as epidemics, environmental problems, general risk management, insurance, natural catastrophes. And there are phenomena in that quadrant that have very complex payoffs, like payoffs from innovation, errors in analysis of deviation, derivative payoffs.
By Alex Bryson, Professor of Quantitative Social Science, Social Research Institute, UCL and David Blanchflower, Bruce V. Rauner Professor of Economics, Dartmouth College. Originally published at VoxEU
When Queen Elizabeth II asked economists why none of them had seen the Great Recession coming, they presented her with a number of reasons but forgot to mention the main one: they hadn’t paid attention to ‘red lights’ that had been flashing in the qualitative survey data from consumers and producers that predicted the downturn. Chief among these was the fear of unemployment which, as this column shows, predicts upticks in unemployment 12 months ahead.
Predicting economic downturns and rising unemployment is notoriously difficult. Economists usually characterise recessions as random shocks which, by construction, cannot be predicted. This is a mistake.
Several economists such as Nouriel Roubini did in fact spot the recession coming but were ignored.1 The recession started in the US housing market in 2006 and spread, just as the Great Depression did (Blanchflower 2008). Early warning signs of the impending Great Recession were apparent in business and consumer surveys and purchasing manager indices (PMIs) with similar stories from around the globe, but only a very few policymakers were willing to take them at face value that they signaled an imminent recession.
The early literature on the causes of unemployment emphasised the role of labour market institutions in either causing or exacerbating the conditions leading to recession (Blanchard and Wolfers 2000, Nickell 1997, Layard and Nickell 1986, Bean 1994, Nickell et al. 2005). These were predominantly time-series country-level studies with a small number of country-year observations. They were heavily criticised for their lack of robustness to the inclusion of country and time fixed effects (ILO 1995, Howell et al. 2007, Heckman 2007, Freeman 2007). With few countries and annual or quarterly data, these studies suffered from over-parameterisation. They also relied on macro-aggregate data that are quasi-fixed – such as labour market institutions – and broad indicators of economic conditions which had a poor track record in being able to estimate economic outcomes. Countries that had the biggest increases in unemployment in the Great Recession had housing market bubbles (the UK, the US, Spain, and Ireland), big financial sectors (the UK and the US), and were open to foreign trade (Sweden). Of note is that countries with high job protection and unionisation rates did best in the pandemic.
A new wave of economic forecasting emerged in the early 2000s with the advent of what became known as ‘the economics of walking about’, a term coined by one of us when a member of the Monetary Policy Committee of the Bank of England (Blanchflower 2007). This new economics was designed so that economists could get a real-time picture of what was happening from economic actors on the ground – workers, consumers, producers, and agents, all of whom had a ‘front row’ seat in terms of what was going on in daily economic transactions. The data were contained in a range of qualitative surveys which asked them what they thought of the economic situation now and going forward. These included questions such as “How do you expect the number of people unemployed in this country to change over the next 12 months?” The question has been asked of workers and consumers, as well as producers, across many countries on a biweekly or monthly basis.
In the last decade or so a body of research, reviewed in Blanchflower and Bryson (2021), has emerged using these high-frequency qualitative data to predict unemployment. Aggregating those perceptions to country-month or country-year means analysts are leveraging insights from ‘the wisdom of crowds’ which, as Surowiecki (2005) noted, often produces more accurate assessments of situations than those offered by ‘experts’. A consensus has emerged: these qualitative data contain real information about the state of the economy which can predict future downturns.
Most of these studies are single-country studies and they predate the COVID-induced recession. In Blanchflower and Bryson (2021), we contribute to this literature using panel data for 29 European countries over 439 months between January 1985 and July 2021 to predict changes in the unemployment rate 12 months in advance based on individuals’ fears of unemployment, their perceptions of the economic situation and their own household financial situation. We find individuals’ fears of unemployment predict subsequent changes in unemployment 12 months later in the presence of country and year fixed effects and lagged unemployment. Individuals’ perceptions of the economic situation in the country and their own household finances also predict unemployment 12 months later. Manufacturing firms’ views on what will happen to employment in the months ahead also play an independent role; the lower they are the higher is unemployment months ahead. Other qualitative variables such as PMIs are also found to be predictive of turning points.
The findings underscore the importance of the ‘economics of walking about’ and suggest that global recessions such as the Great Recession are not simply sudden random shocks to the economy. Rather, they unfold gradually and can be predicted in advance with the right data. These data, which are readily collected in social surveys, purchasing manager surveys and by agents such as those working for the Bank of England, have a number of advantages over other survey series.
- First, they can be collected in real time and with high frequency (monthly in the data we present), thus providing timely insights into how economic actors are viewing the economy. At the time of writing (August 2021), the data from the EU Business and Consumer Surveys we analyse are available through to July 2021.2 Uniquely, data are available monthly from consumers as well as from firms in construction, retail, services, and industry.
- Second, they permit country-level panel analyses. Because they are high-frequency, as are the unemployment data, one can estimate country-level models with greater degrees of freedom than estimates that are reliant on quarterly or annual data.
- Third, they are accurate at the time of data collection and are thus not subject to retrospective revision which plagues most macro-indicators.
- Fourth, these data on attitudes and expectations appear better able to predict economic downturns that other data series than standard economic variables like GDP or the unemployment rate.
To emphasise just how powerful they can be, we find fear of unemployment rose in 16 of our 17 Western European countries between 2007 and 2008 prior to the Great Recession – the only exception is Luxembourg. It also rose in 8 of our 11 Eastern European countries, excluding Croatia, Hungary, and Poland. Perhaps more surprising is the rise in the fear of unemployment prior to the outbreak of the COVID pandemic, suggesting recession may have been in the offing even in the absence of the pandemic. This was the case between 2018 and 2019 in 11 of our 17 Western European countries and 6 of our 11 Eastern European countries.
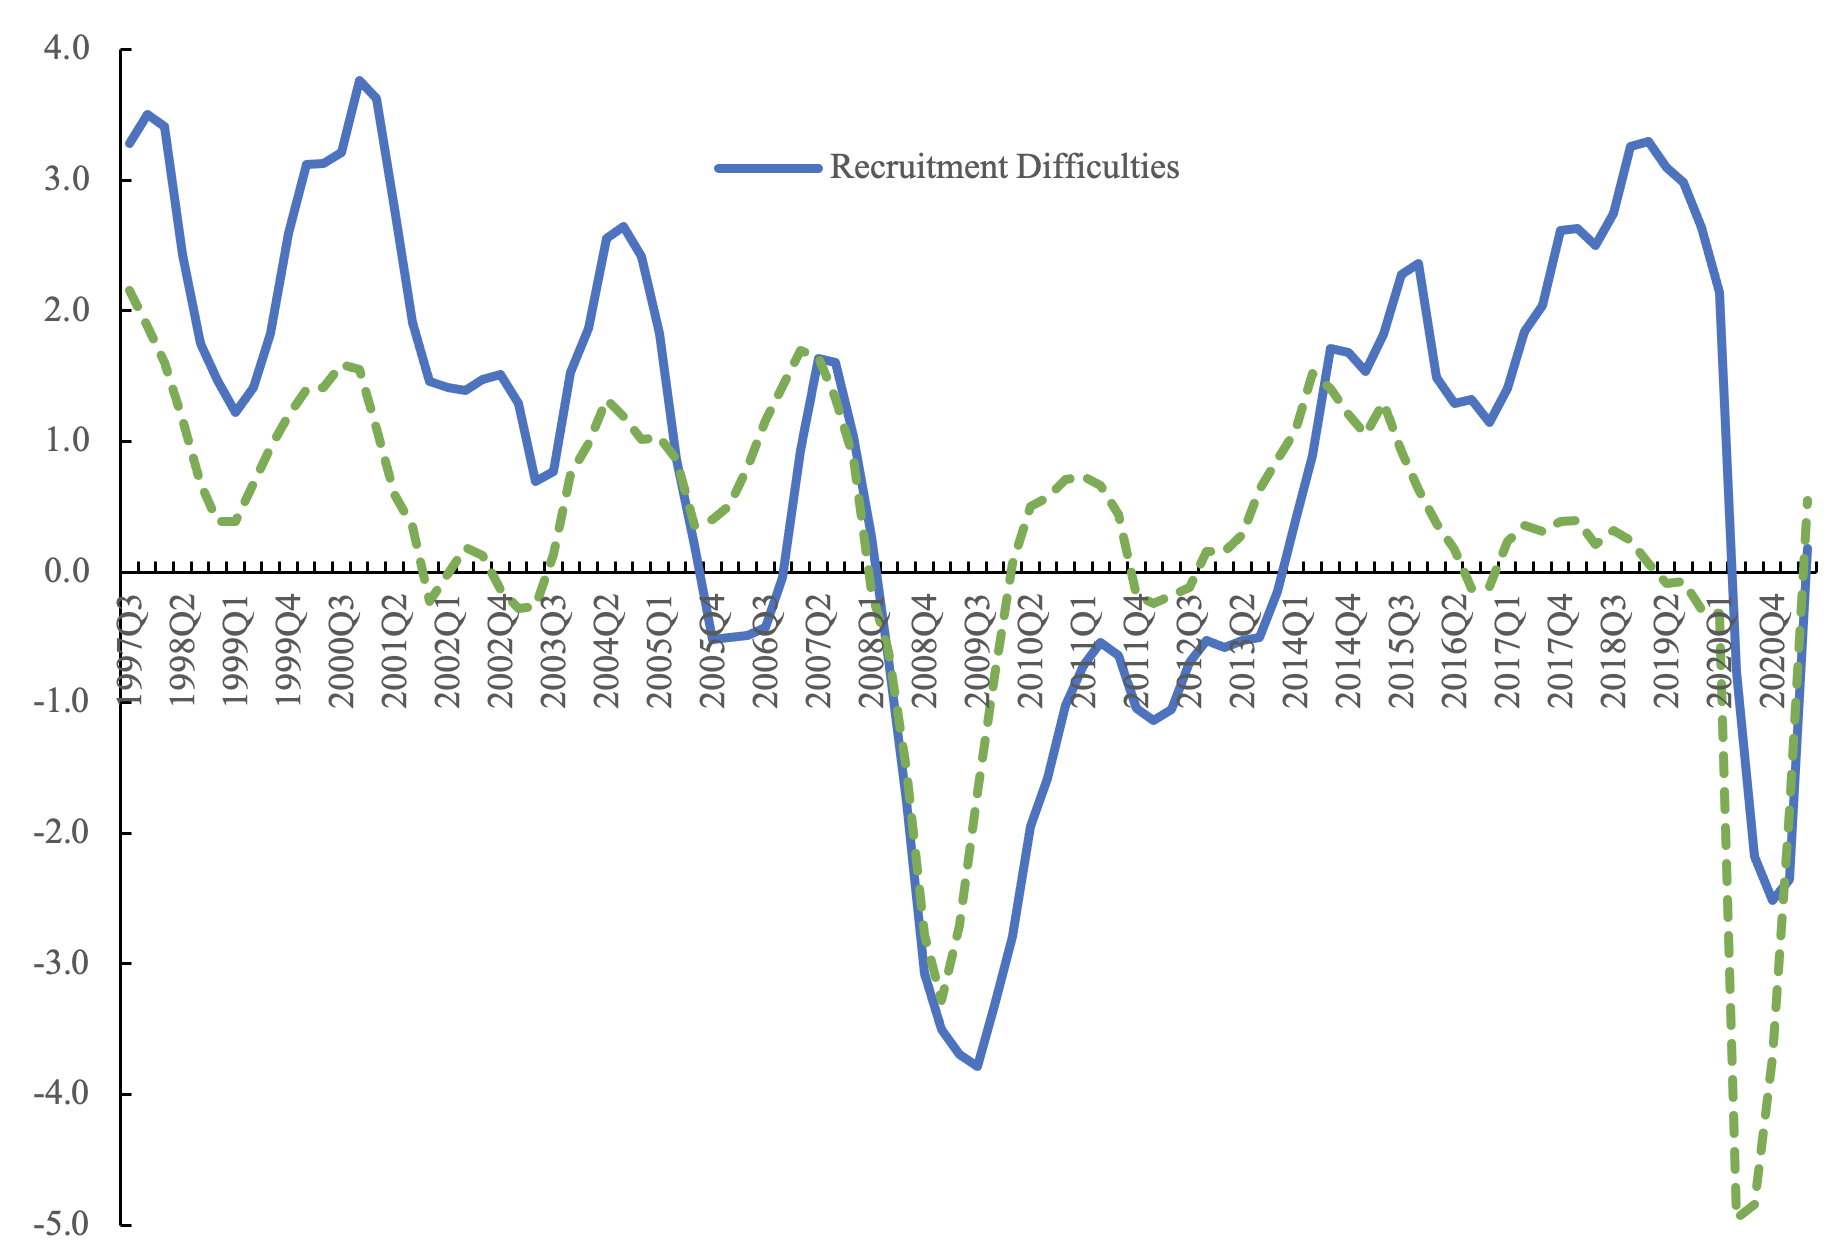
Figure 1 illustrates for the UK. It plots the fear of unemployment series against the unemployment rate 12 months ahead, and shows a marked rise in fear from the start of 2007 and then unemployment rises. Similarly fear starts to rise again from the start of 2015 and then unemployment rises. Figure 2 plots quarterly labour market scores from the Bank of England’s Agents on recruitment difficulties and employment intentions which follow a very similar path. They declined rapidly in 2007 and again from 2018. These scores were flashing red by August 2008 when the MPC forecast in its Inflation Report there would be no recession despite the fact that one had started in April in the UK (and most other EU countries), as suggested by their own agents.
Figure 1 UK: Fear and the unemployment rate 12 months ahead
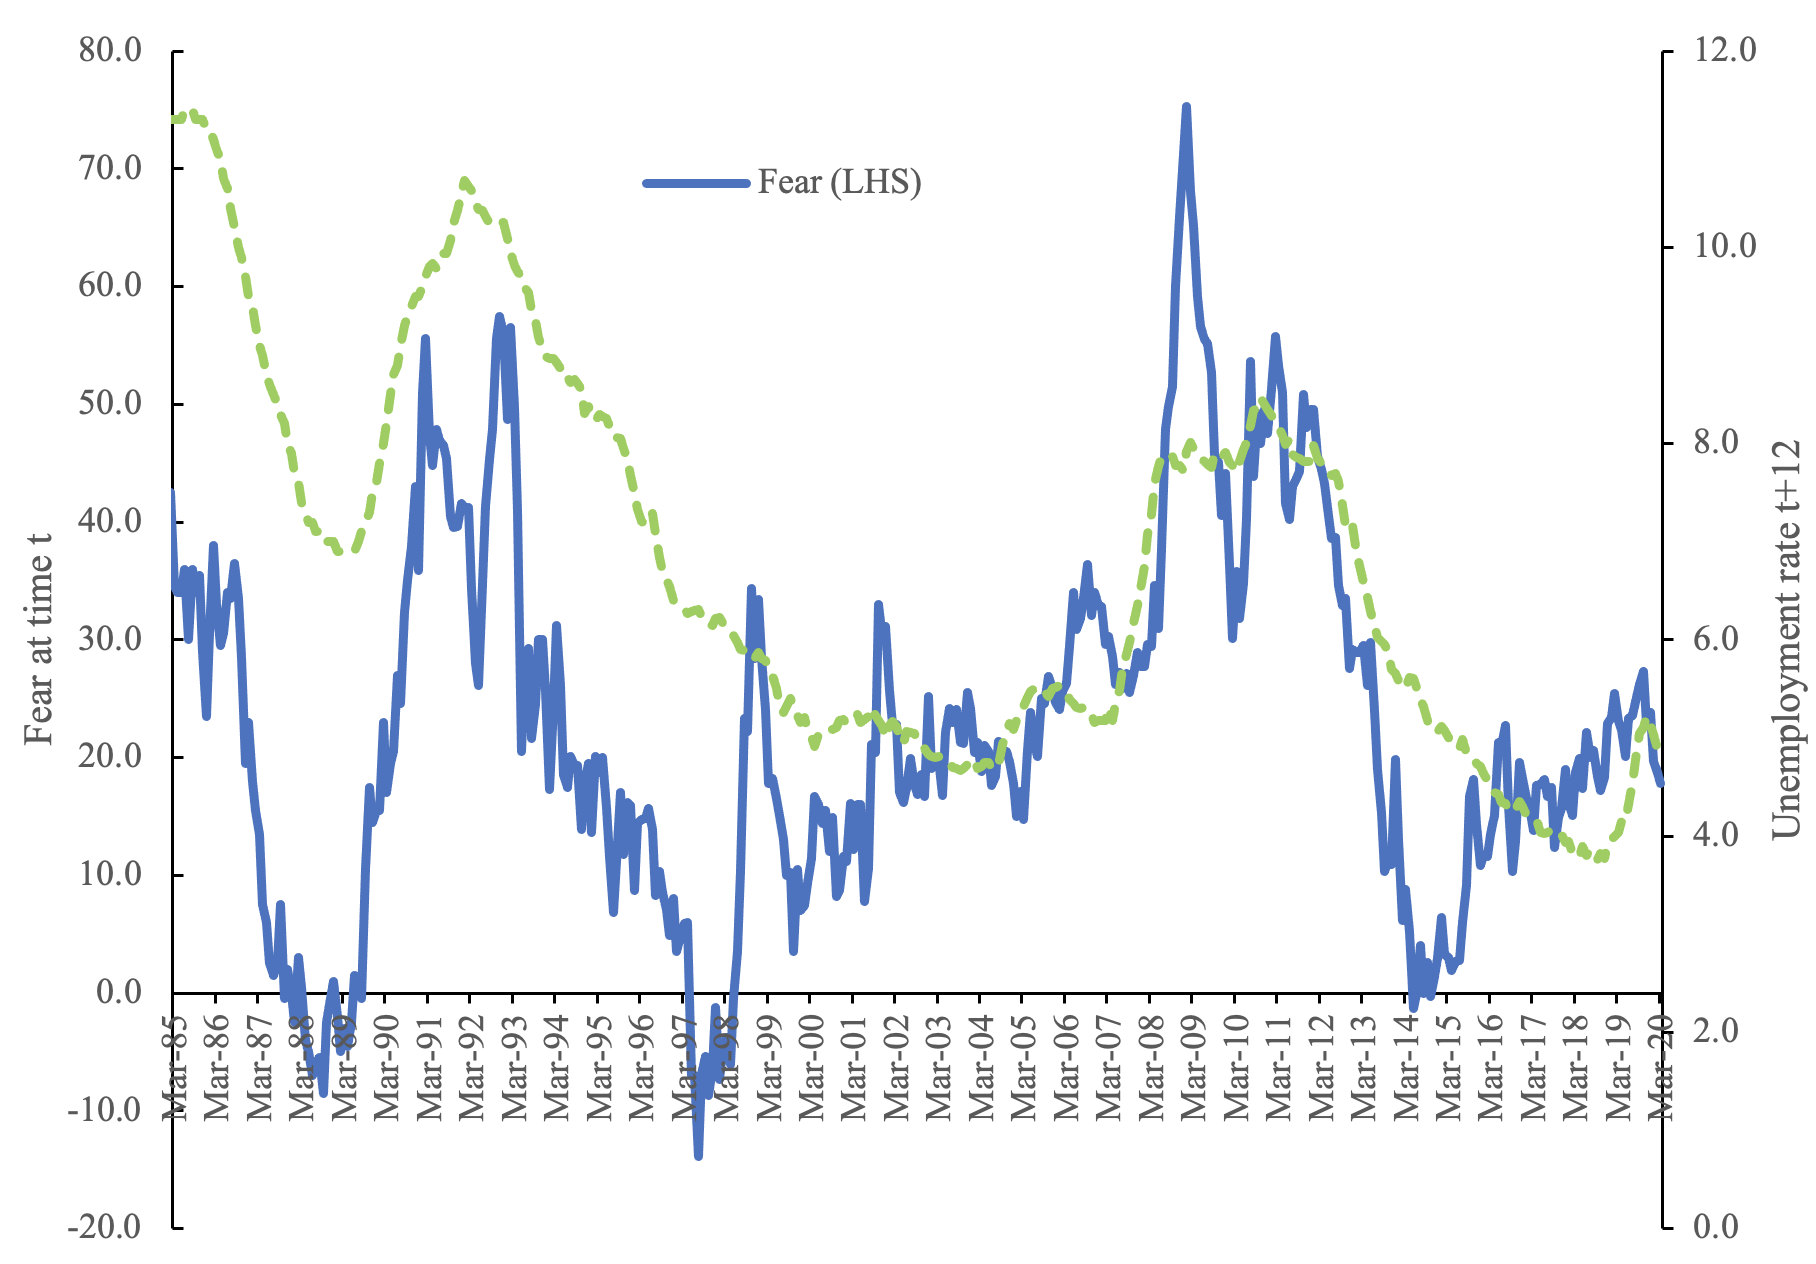
Figure 2 Bank of England agent’s scores on employment prospects
Economists should harness the information available in these surveys to predict economic downturns and, in particular, rising unemployment and slowing output. Qualitative surveys gave a very early indication of the coming of the Great Recession in the US and the same patterns spread around the world, if commentators had only been watching. The surveys also showed early signs of slowing from around 2017, even though central banks were suggesting that full employment was at hand. GDP growth in Europe, and especially in Germany, slowed in 2018 and 2019 versus 2017.
If one goes back further and considers recessions in the post-War period, they come in various guises. All entail loss of output but the precise nature of the unemployment response depends somewhat on endogenous policy response. ‘Nowcasting’, which predicts unemployment in real time, cannot estimate GDP change due to measurement problems in estimating GDP, which result in series revisions such that we do not always know when the turning point has come until late in the day. Thus, we tend to focus on predicting unemployment. However, that may not be a perfect metric for capturing business cycle turning points if the state acts as it did in Europe during COVID. However, in Blanchflower and Bryson (2021) we indicate that fear of unemployment predicts both – that is, it can predict the real GDP change (post revisions) and unemployment change. We know, therefore, that things are getting bad when the fear numbers turn seriously negative in consecutive months. It is this – the turning point in fear of unemployment – that should really be the focus of our modelling efforts if we are to predict turning points in the business cycle.
The potential for further forecasting research using these kinds of data seems high.
See original post for references


In the construction industry there are well established waves of employment, with architects often the first to be hired and the first to be fired in an upturn, followed by ground engineers, structural engineers, surveyors, etc. If the economy seems to be going well, and you hear of architects being laid off, its a pretty good indicator that the peak has passed.
When I was a student in in the late 1980’s doing casual summer construction and bar work in the summers in London, I first heard whispers of contractors being hired to board up semi-complete apartment buildings in the outer suburbs – this was when the newspapers were still full of excited articles about never ending property price rises. I think took more than 6 months for the news to catch up that the bust had well and truly hit.
Its always worth keeping an eye on the ground – you can often learn far more about the economy by looking at job adverts (not just the number, the type of jobs), what type of construction projects are breaking ground, who is working overtime, etc. The official news is usually well past the loop.
In latter part of my academic career I discovered that attitudes were an incredibly powerful “second dataset” to help unpick the mean and variance in the primary one. I really should have thought of this earlier, given that I too had developed a healthy respect for qualitative data (co-supervising PhD students who used techniques like meta-ethnography).
Anyway I used them in my only foray into electoral prediction – very successfully. Totally independent of me, YouGov did so too and this, their “alternative model”, beat their main model along with all the competition in the 2017 UK general election. Alas they’re throwing the baby out with the bathwater as the model broke down by 2019 but I can make a good guess as to why it did and it’s a shame they’re being so quick to declare the method a failure when their only failure was in how they measured the attitudes.
So please let me test my understanding of something I’m learning in my Common Earth course. We read a chapter about the “seven essential skills” of systems thinking, and one of those was “Quantitative Thinking.” The author noted that “quantitative” is not synonymous with “measurable,” and gave the example of “employee commitment” that might be a critical component of company success but was not measurable. “Quantitative Thinking” would assign admittedly arbitrary values like “high,” “medium” and “low” and add an “employee commitment” to the model. While such imprecise measures won’t lead to some exact prediction two quarters in the future, the inclusion of the variable in the model can shed a lot of light on what is happening.
Is that something close to what you’re talking about?
As usual regular NC commenters ask deep, insightful questions that really need an essay to answer. I’ll do my best to give a short version of the answer.
For example consider the quantitative variable expressing left to right political persuasion. Don’t ask a person to place themselves on some numerical scale. Their real position cant be measured – for the maths to work (such that 4 is twice as right wing as 2 – cardinality) forget about asking people. Traditional Chinese people won’t give 4 because it has connotations with death. There are very amusing connotations once you move to Cantonese but those are NSFW. Basically people don’t follow the necessary maths rules.
You FORCE people to conform to the maths by essentially making them do what they do when shopping – make trade offs with a constraint. Here is a real world example I was flabbergasted by.
A friend in Sydney applied for IT position at Macquarie Bank (bluest chip bank). He was worried. He did the ”psychometric test” that is ubiquitous. However he couldn’t game it (like I had been doing since 1994). I was intrigued and asked for an example task he was given. He told me they kept giving him sets of four attitudes and asked which he identified most with and which least. Trouble was two were obviously valued so he didn’t know the answer they wanted. Opposite problem with the other two attitudes. I told him “they ran a best worst scaling experiment on you. My boss invented that and I’m the second most experienced person.”
The answers are all relative frequencies…. Thus on a probability scale which is cardinal. But I pride myself on knowing who was using the technique across the planet via citation alerts and questions. Macquarie were NEVER on my radar. They’d clearly sent someone who had different affiliation to a course we run and then pieced it all together to devise an ungameable ”psychometric” test (quotes because it ain’t psychometrics).
Use probabilistically generated estimates of attitudes and you’ll go far. Use silly Likert scale like YouGov and it’ll go wrong.
Ah yes, the infamous ‘Kobayashi Maru’ consulting wank being pushed by the Leadership Circle(jerk) and probably others. Whose own consultants btw are amazingly deficient in all the prized attributes.
Short version: if colleagues are afraid of you (i.e. worried that you’ll somehow find out how they rated you), you get scored as a brilliant, inspirational and courageous leader. Otherwise, you’re deficient, and it gets used by HR as a stick to beat you at will.
Many thanks for that response. Now I’m off to find out what a Likert scale is.
When I saw the phrase “economics of walking about,” I thought about Chilean economist Manfred Max-Neef. He called simethung like this “barefoot economics”‘ and wrote a book called Outside Looking In: Experiences in Barefoot Economics.
This interview from years ago has stuck with me:https://www.democracynow.org/2010/11/26/chilean_economist_manfred_max_neef_on.
And yes, I remember plenty of worries about the recessionary headwinds back in 2019.
The short term vs long term interest rate weird movements, repo facility moves that had people head scratching, and more businesses seeming slow to hire. This is just some of it. Even then there was a harrowing fear of rising interest rates because of the amount of heavy borrowing.
Covid relief and particularly temporary debt relief saved alot of butts.
All roads out of the trap point to debt jubilee. However, it would have to have a global aspect because finance is international.
I ride my bicycle around Tucson, and I see all sorts of things.
Take, for example, the housing market that the article says began in 2006. Not so here in Tucson. During Q3 2005, I noticed a sharp increase in the number of “for sale” signs. It was as if the monsoon rains had left “for sale” signs behind.
What happened next was REALLY interesting. Some of those signs stayed up for YEARS.
This summer, I’m starting to see more inventory listed in the resale market. Once again, I’m seeing signs that stay up forever. The weeds are growing in the yards of these places, and that doesn’t help the curb appeal at all.
Which way will our local market go? Well, I’m starting to see price cuts at some nearby places that are for sale. Methinks this is the beginning of the end of our local bubble.
The slower you go, the more you observe.
Most of us zip around @ 30-50 mph in our chariots of ICE fire, and all you really get is fleeting glimpses at that speed, but slow it down to a crawl (please don’t get down on all fours-that would look rather humiliating) and you see so much.
Concur. When we first moved to where we still reside, it was less densely populated. A couple of horseback riders could amble along on dirt roads and stop to jawbone with fellow residents. The horses liked that a lot. We could also engage w/the local wildlife (hint, those are not sticks arrayed sideways across sandy trails at night, they are rattlesnakes soaking up heat).
Things changed. A few years ago someone texting while driving struck and killed a much loved local camel who stood 7 ft tall at the top of its hump. The driver said they did not see it.
Now w/all the internet available via car “radios” the exterior might as well be virtual.
Walking good. Driving not so good.
I just encountered this collection of essays through Chris Arnade’s twitter (He wrote the introductory essay). I have not started to read them yet, but here is the description:
Today’s public square is too often closed to those without a narrow set of credentials. Politicians and pundits in Washington are consumed with ideological battles far removed from the day-to-day concerns of American workers and their families, and often seem incapable of even understanding them. Our policy debates are poorer for it, our policymakers less informed, and our fellow citizens excluded.
The Edgerton Essays are a joint project of American Compass and the Ethics and Public Policy Center, featuring working-class Americans sharing their perspectives on what they wish policymakers knew about the challenges facing their families and communities. The goal of the essays goal is to help inform policymakers and pundits about what matters most and why to the vast majority of Americans who have no day-to-day connection to our political debates, focusing especially on those who have not earned a college degree.
The Edgerton Essays are named for Norman Rockwell’s famous 1943 painting, “Freedom of Speech.” Rockwell depicted Jim Edgerton, a farmer in their small town, rising to speak and being respectfully listened to by his neighbors. That respectful, democratic spirit is too often missing today, and what we’re hoping to cultivate with this series.
https://americancompass.org/collections/the-edgerton-essays/
A major indicator for the decline in efficiency and ethics in governance is the character of fiscal policy. Not addressing the difference between earned and unearned income fuels destabilization and acts as a deadweight loss – unduly burdening labor and the environment. Pretty hard to get that narrative across tho….
I’m sorry, but this seems so obvious to me;
Why hadn’t they been paying attention to those “red lights”?
What’s obvious to me is that they were not ignoring “fear of unemployment” as measured in qualitative data surveys, they were paying very close attention to their own “fear of unemployment” as measured by their own discomfort when approaching the impulse to speaking truth to power.
NC readers are well aware of the fact that economists in general understand that their continued employment is ensured in large part by their ability to ignore what most of us understand as economic reality, and instead, cheer on the fabulous illusions proffered by their bosses.
Queen Elizabeth II asked the economists who got it wrong, and consequently got the wrong answers.
Any economist who had been following the housing boom (in the U.S.), the relationship between sale prices and rents, and indefensible lending practices in plain sight, knew the bust was on the way.
And some did predict it, with far more career accuracy than, say, Nouriel Roubini, and with no need of business or consumer surveys. The plain facts — were sale prices sustainable? — were plain enough. No need to invent a new discipline.
As we explained long-form in ECONNED, that’s still not right. Economists and commentators are still engaging in drunk under the streetlight behavior.
Yes, there was a very big housing bubble. But even that bursting would have created a very bad recession, and not a global meltdown of the financial system. The financial crisis was a derivatives crisis. Subprime exposures were 4-6x their real economy value and concentrated at systemically important players like AIG, Citi, Bank of America, and the Eurobanks.
“Not everything that counts can be counted. Not everything that can be counted counts.”
– W.B. Cameron, often misattributed to Einstein.
(…. Although when a Princeton grad student pointed out that his exam questions were the same as last year’s, Einstein responded: “That’s OK, the answers are different this year.”)
Graham Greene has been on my mind a lot lately, go figure, but this passage seems especially apropos in the great Venn diagram of le grande malaise Americaine….
‘York Harding,’ Pyle said, ‘wrote that what the East needed was a Third Force.’ Perhaps I should have seen that fanatic gleam, the quick response to a phrase, the magic sound of figures: Fifth Column, Third Force, Seventh Day. I might have saved all of us a lot of trouble, even Pyle, if I had realized the direction of that indefatigable young brain. But I left him with arid bones of background and took my daily walk up and down the rue Catinat.
He would have to learn for himself the real background that held you as a smell does: the gold of the rice-fields under a flat late sun: the fishers’ fragile cranes hovering over the fields like mosquitoes: the cups of tea on an old abbot’s platform….
Or as every D&D geek knows, it’s the difference between Intelligence and Wisdom.
(another terrific post on an important topic, btw, many thanks again)
Sometimes feels to me that so much of it comes down to people consistently scoffing at and ignoring some very simple ancient wisdoms such as “nothing lasts forever” and “this too shall change” that even the most basic observations of natural cycles make plain.
Of course, what people want is to predict the next best thing and ride the wave of opportunity to their own promised land. Escape (or worse, control) the natural and statistical realities somehow rather than plan and work with and around them.
Can’t help wondering what all this would look like if we planned and acted from a place of basic observations rather than the deluded perspective that we are not part of and subject to nature.