Yves here. Servaas Storm takes apart a widely cited Jackson Hole paper that got a lot of traction because it lets negligent central bankers off the hook. Sadly, we also see that the loanable funds, a major cause of misguided economic policies, is very much alive and well.
By Servaas Storm, a Dutch economist and author who works on macroeconomics, technological progress, income distribution & economic growth, finance, development and structural change, and climate change. Originally published at the Institute for New Economic Thinking website
In the waning days of August, in a world beset by the unending COVID-19 public health crisis, by increasingly frequent extreme climate events, and by the terrible news from Afghanistan, the world’s central bankers, the rich, and the influential gathered (online) for the Federal Reserve Bank of Kansas City’s annual Jackson Hole symposium. The title of this year’s Economic Policy Symposium was “Macroeconomic Policy in an Uneven Economy.”
Few observers were paying attention and most had low expectations, knowing that central bankers are caught in a catch-22: they cannot lower interest rates (already at the zero-lower bound) to boost the economy, and they cannot raise rates, because the current high private and public debts are sustainable only at very low interest rates. Likewise, central bankers are unable to discontinue their accommodative (QE) policies, because this would abruptly end the irrational exuberance in financial markets and risk another global financial crash. Indeed, Fed chair Jay Powell’s speech was predictably careful, cautiously outlining how the Fed will continue its accommodative policy, while steadily monitoring data for signs of persistent broad-based inflation. No news from the monetary policy front, in other words.
However, one of the contributions to the symposium, a paper by Atif Mian, Ludwig Straub, and Amir Sufi (2021), managed to make headlines in the New York Times and the Financial Times (amongst others). The authors argue that high income inequality is the cause, not the result, of the low natural rate of interest r* and high asset prices evident in recent years. “As the rich get richer in terms of income, it creates a saving glut,” Professor Mian told the New York Times, “The saving glut forces interest rates to fall, which makes the rich even wealthier. Inequality begets inequality. It is a vicious cycle, and we are stuck in it” (Irwin 2021). In the same New York Times article, Professor Sufi is quoted, saying “These forces pushing down r-star are probably so powerful that the Fed could never fight against them.” Thus, central bankers are “in this story, […] the equivalent of drivers on a highway who must adapt their speed to road conditions. The Fed has kept rates low for the past decade because those rates have been the ones that keep the economy stable. If it had tried to push them higher, the result would have been a recession.” (Irwin 2021) This message must have been music to the ears of the beleaguered central bankers, and balm for their troubled souls, because, if true, it absolves them from the responsibility for having landed the economy in the catch-22 of low interest rates, excessive indebtedness, and over-inflated asset prices.
The problem with the analysis by Professors Mian, Straub and Sufi (2021) is that it is incoherent on its own terms (i.e. even if we accept the deeply problematic notions of a natural rate of interest and the loanable funds market) and quite at odds with the realities of saving in modern economies. My critique comes in three parts.
The first problem concerns the empirical evidence: the authors incorrectly focus on the increase in the household saving rate, but surely what should matter for their argument is the aggregate savings rate, the rate for the economy as a whole. I will show below that the aggregate savings rate of the U.S. did not rise, which means that even if household savings increased, there was no aggregate saving glut and hence no reason for r* to decrease. This already means that the key argument makes no sense on its own terms.
Secondly, Professors Mian, Straub and Sufi argue that the increase in the average household saving rate must have been caused by a change in household preferences: U.S. households have, on average, become more patient and willing to postpone consumption (today) in favor of higher savings and higher consumption in the future. The authors thus conclude that the ‘rate of time preference’ of the average U.S. household has declined — which (in their reasoning) is also the reason that the natural rate of interest r* has declined.
Unfortunately, their own empirical findings of changes in the class-wise household saving rates contradict this conclusion. Their empirical evidence shows that “the saving rate of the top 10% group in the post-period is similar to the pre-period. [….] the saving rates of the bottom 90% fall considerably” (Mian, Straub and Sufi 2021, p. 21). With savings rates for one group unchanged and the other 90% of the population consuming more, the rate of time preference of the average U.S. household must have increased — which is the exact opposite of what the authors conclude.
However, the biggest problem of all is that there is no such thing as a market for loanable funds. The irrelevance of this old Wicksellian story has been explained many times, starting with Keynes (1936, 1939), but more recently by Lindner (2015), Taylor (2016), and Storm (2017). Banks pre-finance investment; investment creates incomes; people save out of their incomes; and at the end of the day, ex-post savings equal investment. This is what Bank of England economists Jakab and Kumhoff (2015) write:
…. if the loan is for physical investment purposes, this new lending and money is what triggers investment and therefore, by the national accounts identity of saving and investment (for closed economies), saving. Saving is therefore a consequence, not a cause, of such lending. Saving does not finance investment, financing does. To argue otherwise confuses the respective macroeconomic roles of resources (saving) and debt-based money (financing).
There exists no market for ‘savings’ and ‘investment’ which is cleared by an equilibrium interest rate, and, hence the savings glut story of Professors Mian, Straub and Sufi (2021) makes no sense.
This note reviews the three weaknesses mentioned above and concludes that it is incorrect to view central bankers as mere “drivers on a highway who must adapt their speed to road conditions”; instead, it makes more sense to regard central bankers as the main traffic control which regulates and enforces traffic volume, speed and road conditions, in normal times and during emergencies. Together with governments and establishment economists, central bankers carry much of the responsibility for the increased inequality, slow growth, high debts, and over-inflated asset prices, however much Professors Mian, Straub and Sufi try to persuade us to believe otherwise.
What Explains the Secular Decline in r*?
Before proceeding to the critique, let us first consider the argument by Mian, Straub and Sufi (2021). The paper considers two explanations of low interest rates:
(1) increased household savings, driven by the baby-boom generation’s accumulation of retirement savings; this is the demographic explanation (see Goodhart and Pradhan 2020).
(2) Increased household savings, driven by higher income (and wealth) inequality, given the fact that rich people save a larger share of their income than the middle class and the poor; this is the ‘inequality’ explanation.
Using data for the U.S. during 1952-2019, Mian, Straub and Sufi find that the impact of higher inequality overwhelms the influence on household savings from demographics. Their evidence shows that, across all birth cohorts, higher-income households have significantly higher saving rates than lower-income households — which is a stylized fact that has been known for ages, see e.g., Saez and Zucman (2016) and Taylor (2020).
Figure 1 reproduces the findings of Mian, Straub and Sufi (2021): the differences in saving rates between age groups (birth cohorts) in the right panel are much smaller than the differences in saving rates between the top 10%, next 40%, and bottom 50% of households within-birth cohorts in the left panel. Mechanical life-cycle effects do not matter much and what is more, the findings of Figure 1 also disprove the assumption of a constant saving rate out of lifetime income across all households that underlies most macro models.
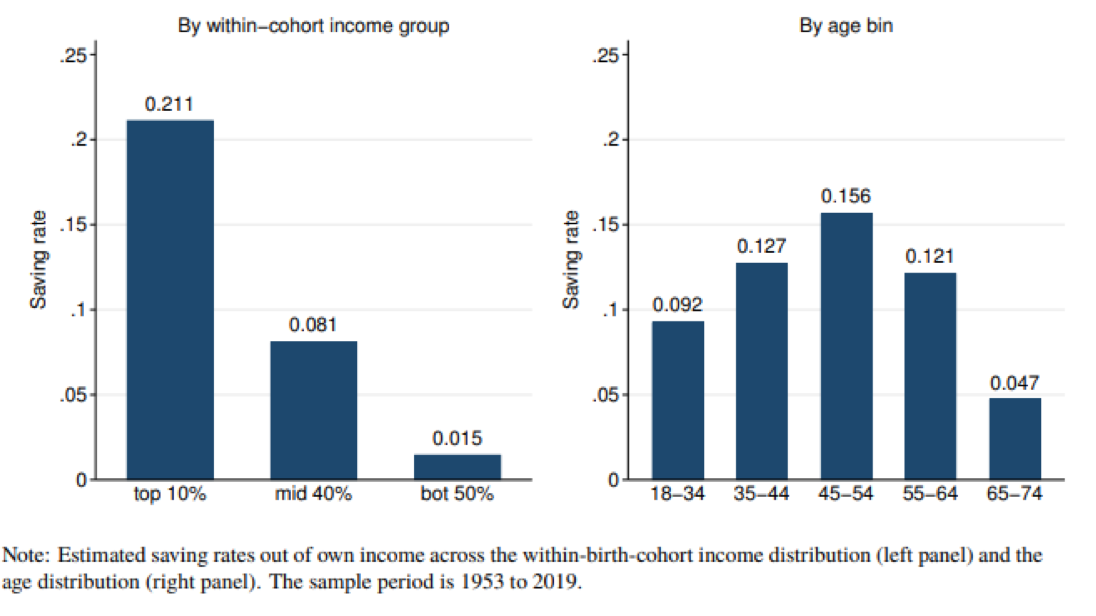
Figure 1 Saving rates across the within-cohort income and age distribution Source: Mian, Straub and Sufi (2021), Figure 3.
Clearly, inequality is not just an end-of-pipe distributional outcome, but a central determinant of macroeconomic dynamics. To see this, note that the income share of the higher-saving top 10% of households increased — from about 30% in the early 1970s to 43% in recent years — and the income shares of the lower-saving next 40% and bottom 50% declined. Given the differential saving rates (recorded in Figure 1), the increased inequality did indeed raise the overall private saving rate in the U.S. by more than 3 percentage points of national income every year. This represents more than one-third of average annual private savings in recent years, or more than $ 0.6 trillion of additional annual savings. “The rise in income inequality leads to a large rise in saving,” conclude Mian, Straub and Sufi (2021, p. 21), “and therefore is a likely culprit when assessing forces that push down r∗.”
Figure 2 summarizes the argument of Mian, Straub and Sufi (2021). The fact of greater income inequality is taken as a given, perhaps as a result of technological progress, globalization, etc. – all factors beyond the control of central banks. Given differential saving rates by income classes, higher income inequality led to a pile-up of household savings, and a secular decline in the natural rate of interest r* (the red arrow in Figure 2) given this relative abundance (more on this below). The idea is that central banks had to adapt to the configuration of historical forces and thus lowered interest rates; in turn, cheap credit fuelled asset-price inflation, and with the top 10% richest households benefitting most from the resulting wealth gains, inequality spiraled up further, leading to another round of increased savings, lower r*and wealth gains.
This, indeed, is the bottom line of the paper by Mian, Straub and Sufi (2021): central bankers, even those at the Fed, the world’s most powerful central bank, have far less power in managing the macroeconomy than is commonly believed, and the best they can do is to adapt to the natural forces of technological progress and global integration, rather than attempting to go against these inexorable currents. Accordingly, the task of the ‘science’ of monetary policymaking is limited: to follow and adapt to what is happening anyway — bending along in ways that maintain economic and financial stability. The way they frame their argument, the authors manage to kill two birds with one stone: on the one hand, they succeed in de-politicizing and ‘naturalizing’ monetary policymaking by invoking the troubled notion of the natural rate of interest r* — and on the other hand, they manage to ‘naturalize’ inequality by removing monetary policy as a key driver of growing income concentration and primarily attributing it to the ‘impersonal forces’ of technological progress and globalization, which arguably are mostly beyond policy control.
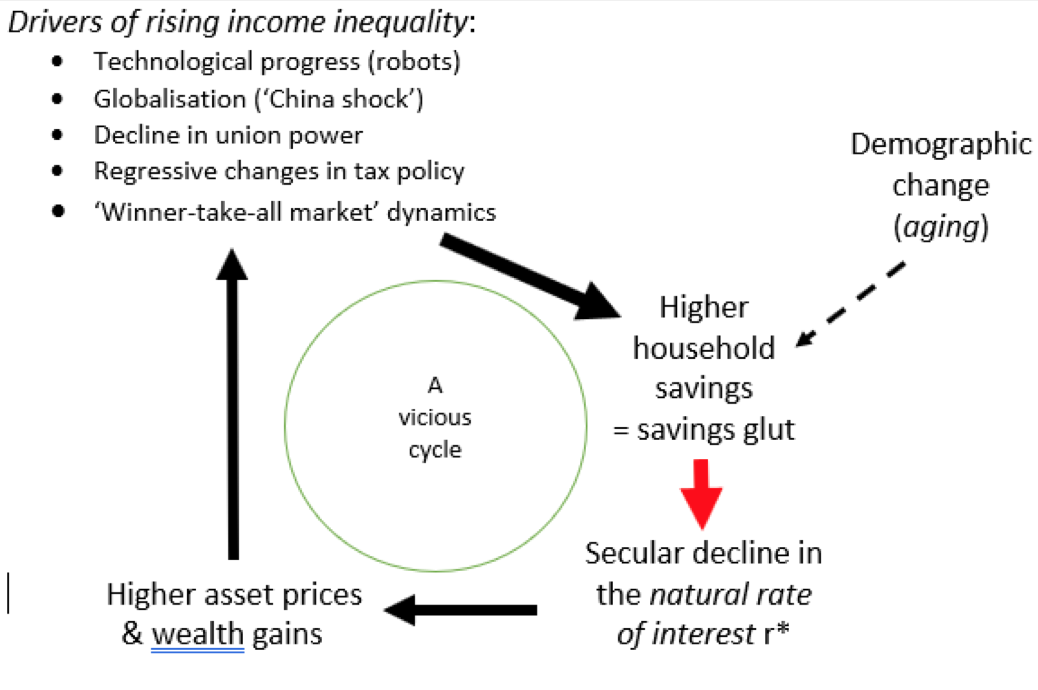
Figure 2 Mian, Straub and Sufi’s (2021) savings glut hypothesis
First problem: despite the rise in inequality, there is no savings glut
If Professors Mian, Straub and Sufi are right that high inequality is the cause of the low interest rates, then we should observe an increase in aggregate savings in the U.S. Surely, the natural rate of interest r* is determined not just by household savings, but by aggregate savings.
Aggregate savings, as we know from the national accounts, consist of savings by households, business, and government as well as foreign savings (which by accounting convention are equal to the difference between imports and exports). As is shown by Figure 3, the aggregate saving rate of the U.S. remained quite close to its long-term average of 25.8% (of national income) and does not exhibit a rising trend. There is no American savings glut, in other words – however much Professors Mian, Straub and Sufi would like to persuade us that there is an over-supply of savings.
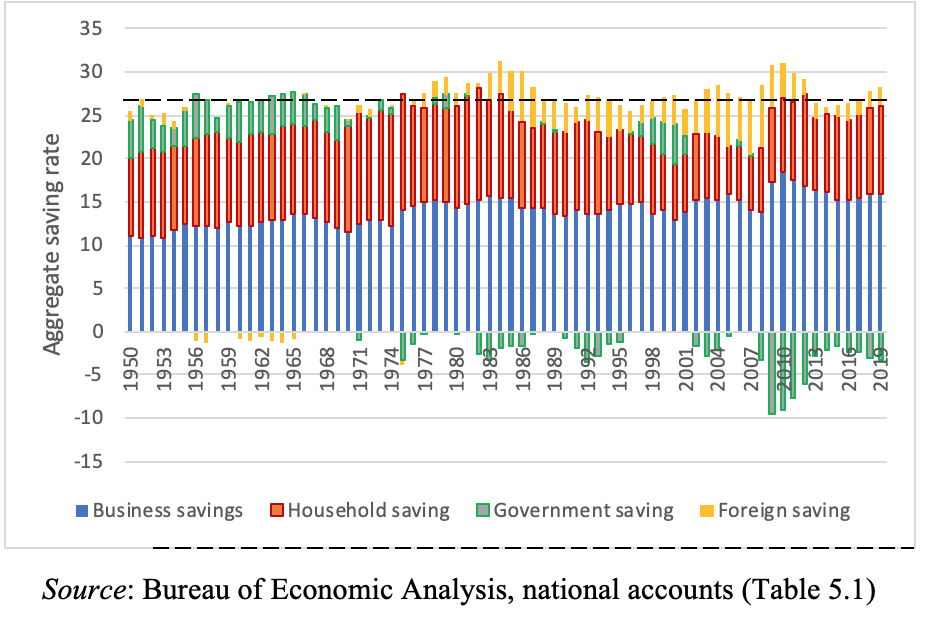
Figure 3 The aggregate saving rate and its composition: The U.S. 1950-2020 (% of national income)
However, we can see in Figure 3 that the composition of aggregate savings changed. The saving rate of households averaged 11.7% (of national income) during 1980-85 and 6.7% during 2003-08; with rising income inequality, the household saving rate increased to an average of 9.7% during 2015-2019. But, all along, the aggregate U.S. saving rate remained more or less the same, because the other sources of saving offset the changes in household saving. Specifically, as the household saving rate rose during the previous decade, the government saving rate and the foreign saving rate (the trade deficit) declined; government savings even turned negative (Figure 3).
This is not surprising, because the increase in income inequality led to higher household savings, lower demand, and slow growth, which in turn contributed to an increase in public deficits and a decline in the trade deficit (because of slower import growth).
Figure 4 shows the “natural rate of interest r*”, as constructed by Mian, Straub and Sufi (2021) themselves, and the national savings rate in the U.S. during 1961-2020. Their construction of r* exhibits a statistically significant downward trend, declining from an average of 5% during the 1960s to an average of 0.68% during 2011-2020. But as we saw already in Figure 3, the national savings rate of the U.S. shows no trend: it was 26.1% in the 1960s, 26.6% in the 1970s, 27.7% in the 1980s, 25.6% in the 1990s, 25.2% during 2001-2010, and 24% during 2011-2019. Even in 2019, the national savings rate was 25%.
Three conclusions follow:
1. Changes in the supply of savings (loanable funds) cannot possibly explain the secular decline in the natural rate of interest r*.
2. To the extent that higher income inequality increased household savings, this did not lead to an increase in (aggregate) national savings, because other sources of savings (notable, public savings and foreign savings) declined. This is not surprising, because the higher average household savings depressed demand and economic growth, lowering public and foreign savings as a result.
3. The secular decline in the natural interest rate r* cannot, therefore, in any way be attributed to rising income inequality.
The key proposition of Mian, Straub and Sufi (2021) holds no water.
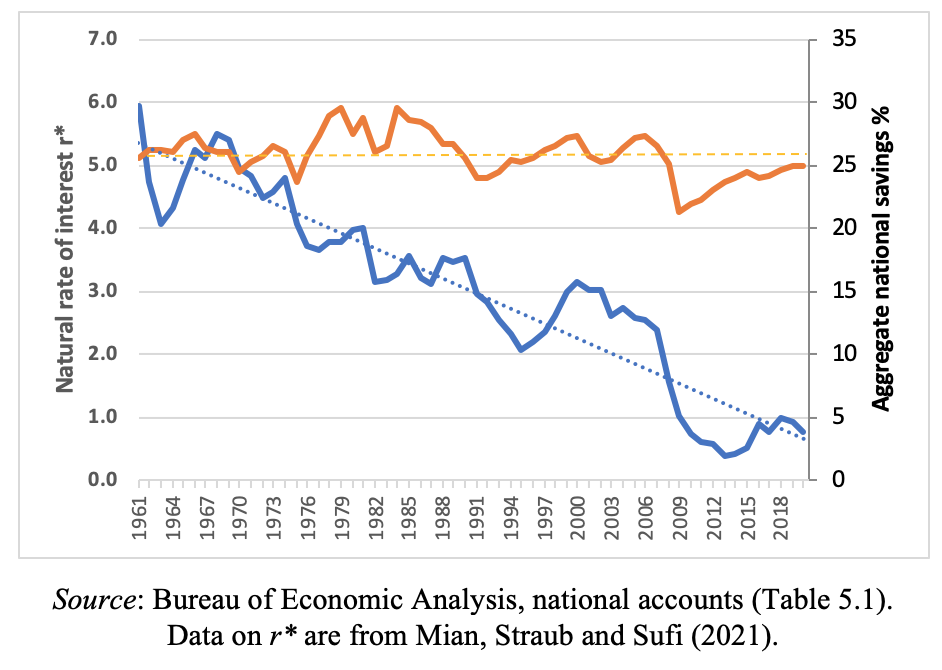
Figure 4 Aggregate national savings and the natural rate of interest: U.S. (1961-2019)
Second Problem: The Rate of Time Preference of Most U.S. Households Increased Rather Than Declined
Mian, Straub and Sufi (2021) calculate the natural rate of interest r* using the model of Laubach and Williams (2003). They determine r* as a function of potential output — the level of output supposedly consistent with stable inflation. I must note here that there is absolutely nothing ‘natural’ about r* — its value depends on the magnitude of the inflation target, set by the central bank, and also on the central bank’s understanding and measurement of ‘potential growth’. This unobservable concept is known to be slippery in the extreme (see Costantini 2015; Fontanari, Palumbo and Salvatori 2021). The argument is really that r* is just the interest rate which the central bank believes to be consistent with keeping inflation stable at its chosen inflation target.
Without much formal ado, Mian, Straub and Sufi next interpret the secular decline in r*, which is what they find (see Figure 4), within the context of the standard representative-agent Ramsey model. They do so in order to be able to give a ‘micro-founded’ explanation of the puzzle of rising household savings and a declining r*. In the Ramsey model, r* is a function of the ‘rate of time preference’ of the rational (optimizing) representative agent.[i] Hence, Mian, Straub and Sufi argue that the decline in r* (for the U.S.) could only have occurred due to a steady decline in the rate of time preference of the average U.S. household. A lower rate of time preference means that the preference of the representative agent to consume today has become less strong. As a result of this change in one of the deep behavioral parameters of average consumer behavior, the representative agent will increase her savings rate. It needs no elaboration that this ‘explanation’ involves a leap of logic because the Ramsey model has only one representative household and cannot tell us anything useful about the impact of higher inequality (between various income classes) and r*.
But things get worse. I do not see how the above reasoning why r*decreased helps explain the actual increase in savings of U.S. households. After all, the empirical evidence of Mian, Straub and Sufi shows that the increase in the average saving rate of U.S. households is caused by a significant change in income distribution in favor of the higher-saving top 10% of households, and not by a fundamental change in some deep parameter of household behavior, which then led to increases in the saving rates of the three income classes. In fact, Professors Mian, Straub and Sufi (2021, p. 21) write that “the saving rate of the top 10% group in the post-period is similar to the pre-period. [….] the saving rates of the bottom 90% fall considerably” (italics added).
This is shown in Table 1. The average annual saving rate of the bottom 50% of U.S. households declined by 9.4 percentage if one compares the periods (1963-82) and (1995-2019); their saving rate is negative (-6.8%) in the recent period. The average annual saving rate of the middle 40% of U.S. households declined by 3.8 percentage points between the two periods, whereas the saving rate of the richest 10% remained more or less unchanged.
Table 1
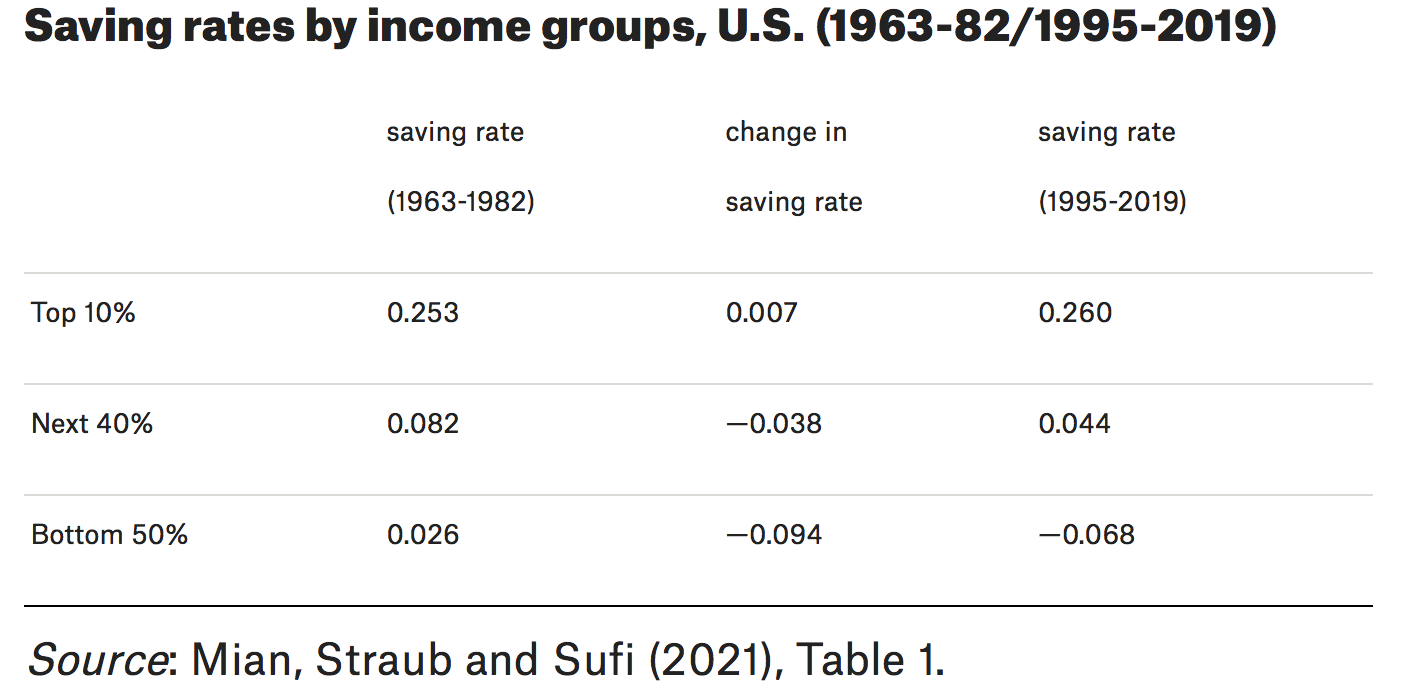
Hence, in terms of the concocted logic of the Ramsey model, this must mean that the rate of time preference has remained unchanged for the top 10% of U.S. households, while it must have strongly increased for the other 90% of U.S. households.[2] Oddly, Professors Mian, Straub and Sufi conclude that the rate of time preference of the representative household has declined. This shows that invoking the Ramsey model to make one’s argument look more ‘scientific’ is not without risk — because the representative household turns out to be not so representative after all.
Anyway, the fact that the average saving rate of U.S. households increased in recent times is not disputed. For Mian, Straub and Sufi, it follows that the natural interest rate r* must have fallen to allow the transformation of the higher savings into higher investment. This final step in their argument brings us, therefore, to the market for loanable funds — where savings constitute the supply of funds and the demand for loanable funds comes from business investment. The argument by Mian, Straub and Sufi boils down to a conventional ‘savings glut’ narrative, with the narrative twist here being that the glut is caused by higher income inequality.
Final Problem: The Loanable Funds Market Does Not Exist
In my view, the biggest problem with the argument of Professors Mian, Straub and Sufi (2021) concerns the claim that a glut of savings causes the natural interest rate r* to fall. The simple (but incorrect) idea is that an excess supply of savings (relative to investment demand) must lead to a decline in the ‘price’ of savings, which in this story is the interest rate. Savings constitute the supply of loanable funds, while investment represents the demand for loanable funds, and similar to the market for potatoes or wooden shoes, an excess supply depresses the market price. This ‘market for loanable funds’ is illustrated in Figure 5: the curve for the supply of loanable funds shifts to right (because savings increase, at a given rate of interest, because of rising inequality), and the new equilibrium interest rate r* is lower than before. If this sounds like J. B. Say, it’s because it is. Because all savings (in this story) are converted into investment, equilibrium interest rate r* ensures that the economy is operating at its potential; hence, r*is labeled the ‘natural rate of interest’.
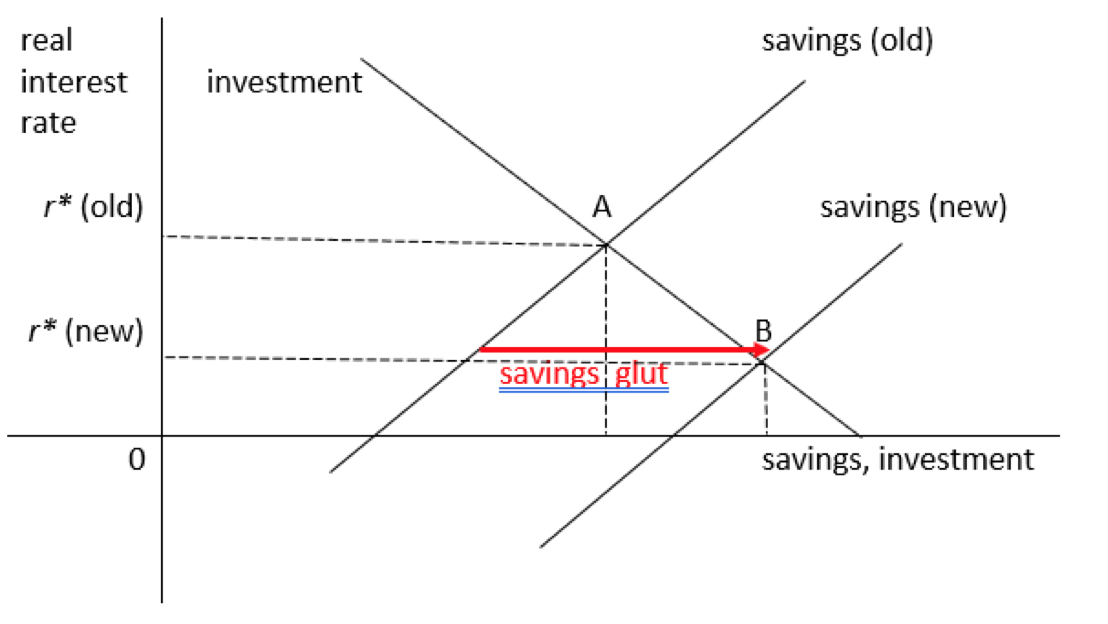
Figure 5 The fictional loanable funds market: savings glut
Through textbooks and papers published in the so-called top journals, the loanable funds model has been hard-wired into the belief system of most economists, even if it was shown to be a myth already more than eighty years ago by John Maynard Keynes (1936). The utter irrelevance of the loanable funds model for our monetary production economies is explained more recently by Lindner (2015), Taylor (2016), and Storm (2017). Suffice it to say that (business) investment is not financed by (already available) savings, but by (newly created) bank credit, and the volume of bank credit depends on banks’ ability and willingness to provide credit; crucially, banks are not just intermediaries pushing around existing money, but money-creating institutions which can make new money ex nihilo — a point both the Fed and private banks understand very well, as their behaviour during bailouts shows. Pointing out the loanable funds fallacy, Keynes wrote in “The Process of Capital Formation” (1939): “Increased investment will always be accompanied by increased saving, but it can never be preceded by it. Dishoarding and credit expansion provides not an alternative to increased saving, but a necessary preparation for it. It is the parent, not the twin, of increased saving.”
In sum, trying to make sense of their empirical findings on inequality and household savings for the ‘real world’, Professors Mian, Straub and Sufi end up telling us a completely fictitious story of a non-existing non-representative agent who for some unexplained reason lowers her rate of time preference and raises her savings, with the ultimate result that a non-existing natural rate of interest r* goes down in some fictitious loanable fund market. Some economists urge us to see economics as ‘storytelling’ (Shiller 2017), but surely the fact-and-fiction-blurring surrealism by Professors Mian, Straub and Sufi is taking this idea of a ‘narrative economics’ to an altogether different level.
An Alternative, Far More Plausible Explanation
Let me conclude by offering a more plausible narrative to explain why higher inequality did cause low interest rates and over-inflated asset prices. The alternative explanation is shown in schematic form in Figure 6.
The key driver of rising income inequality is the stagnation of real wage growth for the bottom 80% or so of U.S. households (Taylor and Ömer 2020). Real wage growth was suppressed below labour productivity growth, and this led to a secular decline in the share of wages (and a rise of profits) in national income. The main cause of the wage growth suppression has been the abandonment of full employment as the primary target of macro policy-making, in favour of inflation control, at the end of the 1970s. Fiscal policy was deprioritized in favor of monetary policy, conducted by independent central banks, single-mindedly focused on building credible reputations as inflation hawks, and counter-cyclical fiscal stabilization was made anathema by subjecting fiscal policy-making to rigid and deflationary rules, irrespective of the business cycle. For a period of time after the global financial crisis of 2008, austerity zealots, dreaming of expansionary fiscal consolidations, intensified the fiscal repression, bringing about one of the slowest and most costly economic recoveries from a crisis in history.
Labour markets were enthusiastically deregulated, with the explicit and generous approval of central banks and governments, to break the structural inflationary power of unions and to create a flexible reserve of surplus workers with no choice but to work in temporary low-wage jobs in what is now known as the ‘gig’ economy. Globalization and offshoring contributed to breaking the countervailing power of organized workers because they offered corporations (the threat of) an opt-out possibility that was not available to workers. Taken together, the change in macroeconomic policy regime produced a structurally low-inflation economy, based on ‘traumatised workers’ in precarious jobs, who could not plausibly fight for higher wages and more secure employment conditions, given their daily struggles and the systemic biases they are facing. The wellspring of cost-push inflation had been radically removed.
Stagnant wages and incomes for the 90% mean that income (and wealth) inequality rises and that aggregate household savings go up (as shown by Mian, Straub and Sufi). Higher household savings reduce consumption demand, which holds up fixed business investment for the domestic market. In effect, aggregate demand growth stagnates, and pressures for demand-pull inflation evaporate. With inflation (and expected inflation) being low in structural terms, central banks lower the interest rate, in accordance with the recommendations based on the monetary policy rules proposed by establishment economics.
The low interest rates, in turn, fuel asset-price bubbles, creating wealth gains for the rich, and over-indebtedness for the bottom 90% of households, which use cheap credit to finance essential expenses on education, medical care and housing. This reinforces wealth and income inequalities, and pushes up asset prices even more, but this does not lead to higher economic growth and better jobs, because the richest 10% use their savings and wealth gains not for investments in the real economy, but to speculate in financial markets. The past two decades have made it abundantly clear that the gains made by the top 10% in financial markets do not trickle down to the real economy.
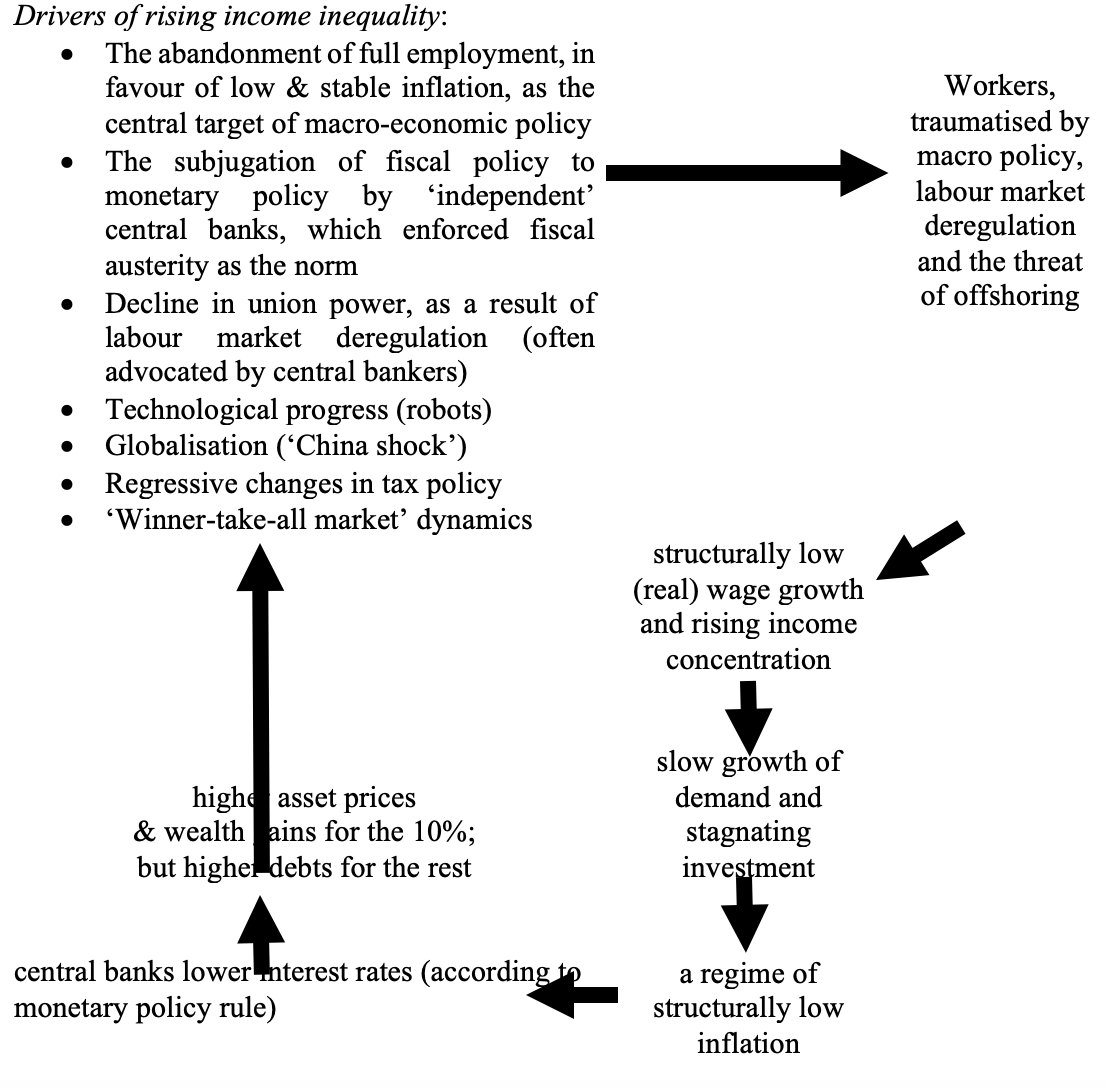
Figure 6 An alternative, more plausible explanation of high inequality and low interest rates
The low interest rate is, therefore, not a ‘natural’ rate at all, but a highly un-natural rate, which is imposed on a stagnating and highly unequal economy by central bankers who have no reason to raise rates (since structural inflation pressures have been eroded) but who cannot lower them further (because of the zero-lower bound). More than a decade ago, central bankers reached the end of the road when it comes to interest rate policy, and they were left with the option to revive the real economy by means of unconventional QE. In the present system, and given establishment thinking, this was probably the only — and therefore best — option left to central bankers, but while QE did succeed in preventing another crisis and keeping the economy on life-support, it failed to revive the real economy and enhanced the already considerable asset-price inflation. Monetary policy-makers find themselves in a catch-22, and they have themselves to blame for this.
So, what is the way out of the impasse, if there is one? The only way involves a rethinking of the dominant macroeconomic model, a reprioritization of full employment as the prime target of macro policy, and a return of active fiscal policy, supported (but not constrained) by monetary policy. Higher wages, progressive redistribution (not just of income, but also of wealth), and more public spending, financed by progressive taxes and generating balanced-budget multiplier effects, constitute essential ingredients in any sensible macroeconomic strategy.
Macroeconomists must give up the fatalism implied by using concepts such as the ‘natural’ rate of interest or the ‘natural’ unemployment rate. Central bankers cannot hide behind such metaphors and diminish themselves to being mere “drivers on a highway who must adapt their speed to road conditions.” There is nothing ‘natural’, inevitable, or preordained about economic concepts, as these are all social constructions. There is nothing natural about the current Catch-22, which was created with the active help of monetary policymakers and establishment economists, who try to shift responsibility on what they label ‘natural forces’. Instead of the fatalism of establishment economics, we must return to the work of economists who did not evade responsibility and used economic thinking to understand the world and to improve it.
See original post for references


A suggestion based on my opinion…that would reduce inequality immensely.
1). Raise the discount rate – right now, today – to 3%. Then pause, collect data, and access if it should go higher.
2). Terminate – right now – all QE, announce QE is forever gone as a policy tool, and demand Congress immediately take away the Fed’s legal authority to engage in QE/and or classify QE as government spending thus requiring Congressional authorization each and every act of QE. No more coddling of the financial industry with projections of what the Fed will do years into the future. Just Do It, and let the markets do what they are supposed to to – absorb the risk and learn to plan for risk accordingly. It’s a new world from this moment on.
3). Reverse QE to pre-pandemic levels (reduce the Fed’s balance sheet). Not gradually – as quickly as possible.
Asset prices would tank as well they should. “Capital” would then do what it is suppose to do – find real honest investments that produce profit based on what we and the market want to buy – instead of capital chasing financial assets contributing nothing to society because of what the Fed is buying and propping up with QE, and there by being a true burden on society via speculation instead of a force for real innovation and expansion. Capital would diminish drastically in dollar volume while become hundreds of times more efficient, effective, and beneficial to all.
To those who suggest this might better be done gradually? That was tried by Powell and failed a few years ago. As soon as Mr. Market threw a tapper tantrum, Powell & Co reversed course 180 degrees.
Just Do It.
When Yellen began raising rates a few years ago, it seemed we might get off the zero bound.
Her problem was poor media and expectations management.
If she had stopped one raise sooner and declared victory, she may well have succeeded in engineering the soft landing of the century.
@timbers: Heh. I like your suggestions. IMO, interest rates have been far too low for far too long. And Servaas Storm is correct. Income inequality has not caused low interest rates. Sure, the aggregate savings rate may cause the difference between the Fed Funds Rate and bank rates on savings accounts and mortgages to vary slightly, but the Fed Funds Rate is the rate around which all other rates are centered. And the Fed Funds Rate is policy, explicitly set by people at the Federal Reserve. It’s laughable to argue that today’s low interest rates are strictly a function of market forces.
And your comment about “capital chasing financial assets contributing nothing to society” is particularly astute. I wonder how many companies have invested their spare revenues in the stock market instead of investing them in the business. It has to be awfully tempting right now, as the Federal Reserve has essentially guaranteed (by continually shoving new QE dollars into financial markets) that financial investments will earn a better return than other investments.
In my opinion, the Federal Reserve should have starting raising the Funds Rate as soon as the job market turned the corner from the Financial Crisis recession. Sometime in the first quarter of 2010. But they didn’t. And here we are, more than a decade later, listening to the Federal Reserve talk about having a meeting to establish a plan to formally discuss laying out a timeline to possibly raise rates slightly in the distance future. And while they dilly-dally, income/wealth inequality growth remains in afterburner mode.
The jobs market did not turn the corner, not even close. I should know, first hand, as my unemployment stretched from June 2009 to November 2010. And once I started that analyst job, at a Plano, Texas bank; that job ended in March 2012. So 2 positions ended within 3 years. Horrible luck.
It was a very slowly recovering jobs market. Just confirm with the U6 under-employment index if you must.
I concur on keeping interest rates lower bound for too long. By 2013 to 2014 they could have started. Unfortunately, the Eurozone and other locales continued to stress the global interest rate markets. That’s my recall, in generally broad terms.
The natural rate of interest for a fiat currency is zero, and as you rightly point out interest rates are set by central banks as a policy lever.
Better to leave the policy rate at zero, eliminate QE, and return fiscal policy to its rightful place in the driver’s seat.
Never going to happen. At this point underwriting asset inflation is official US government policy. The only way it will happen is if wages start to reach the stratosphere, because wage suppression is also official government policy.
Globalization and offshore-ing(transfer pricing/tax disrupting) also reduce the amount throwable into social security each year…and folks with a bit too much money are living too long and being talked into holding onto their money for a rainy day by folks talking their book, depriving the next generation of capital in their own productive years.
Old folks with more money than they are going to spend are jamming up the historical capital cycles by doing their best Charlton Heston “cold dead hands” thingee…
In other words, we should spend our children’s inheritance on $60K autos and an extra house.
In UK, you need to give your children their inheritance early, because otherwise the gov will insist on using your assets to pay for nursing care that would be free if you had no assets.
The ‘free’ nursing care the Govt. will pay for is pretty basic, as are the facilities that go with it. If you’d rather have rather more caring care with a modicum of comfort to fade away in you need to hang on the every penny you have rather than watch your kids binge out on it.
‘Independent’ academic economists write a technical paper for the consumption of the rich and powerful that concludes that the system is working perfect order apart from those things that can’t be changed- what a shock!
Give those guys a raise.
Who needs a think tank when the academies will do that work?
The academies are crawling with think tanks these days as well…
Because the game is rigged to favor the wealthy to the greatest extent in US and World History?
Because the poors aren’t even allowed on the playing field and are instead consigned to cleaning the crapper at the stadium?
It’s a different world.
No, it’s Japan.
The BoJ realised rising asset prices were fuelling inequality, and decided to bring an end to the 1980s asset price bubble in Japan.
They did this in 1991.
Why didn’t the Japanese use QE after their financial crisis?
Japan saved the banks, but left the debt in place.
QE couldn’t get into the real economy due to a lack of borrowers.
The banks were ready to lend, but there were too few borrowers as they were struggling with the debt they had already taken on.
This is why the Japanese used fiscal, rather than monetary policy.
https://www.youtube.com/watch?v=8YTyJzmiHGk
We saved the banks, but left the debt in place.
QE couldn’t get into the real economy, but it could get into financial markets.
The gap between economic fundamentals and the US stock market widened until it reached 1929 levels.
This is why the Japanese didn’t do much QE until Kuroda, as they knew it couldn’t get into the real economy when people were more concerned with paying off existing debt than taking on new debt.
Richard Koo has no idea what Kuroda is doing and has put this down to him having no central banking experience.
Personally I think Kuroda does know what he’s doing.
He knows QE can’t get into the real economy due to a lack of borrowers, but is using it to inflate asset prices as this is what QE does best.
The FED signalled it was going to normalise rates.
The markets reacted badly.
If assets prices fall significantly, it will take out the banking system.
The banking system and the markets have become closely coupled.
This is what happened in 1929.
They FED had to back track and start reducing rates again.
There is no good way out when the banking system and the markets have become closely coupled.
The options:
1) Let asset prices fall, and watch this feed back into the banking system
2) Keep pumping up asset prices to stop the banking system collapsing. This does make things worse in the long run as the bubble just keeps getting bigger
Neoclassical economics is the economics of the “Roaring Twenties”, the Wall Street Crash and the Great Depression.
Global policymakers will sooner or later use the economic growth model of the “Roaring Twenties”, oblivious to where this is leading.
The build up to 1929 and 2008 look so similar because they are.
https://www.youtube.com/watch?v=vAStZJCKmbU&list=PLmtuEaMvhDZZQLxg24CAiFgZYldtoCR-R&index=6
At 18 mins.
What is the fundamental flaw in the free market theory of neoclassical economics?
The University of Chicago worked that out in the 1930s after last time.
Banks can inflate asset prices with the money they create from bank loans.
https://www.bankofengland.co.uk/-/media/boe/files/quarterly-bulletin/2014/money-creation-in-the-modern-economy.pdf
Henry Simons and Irving Fisher supported the Chicago Plan to take away the bankers ability to create money.
“Simons envisioned banks that would have a choice of two types of holdings: long-term bonds and cash. Simultaneously, they would hold increased reserves, up to 100%. Simons saw this as beneficial in that its ultimate consequences would be the prevention of “bank-financed inflation of securities and real estate” through the leveraged creation of secondary forms of money.”
https://www.newworldencyclopedia.org/entry/Henry_Calvert_Simons
The money creation of bank credit is used to fund the transfer of existing assets, which pushes up the price.
You think this is creating wealth, but it isn’t.
You are just creating a ponzi scheme of inflated assets prices.
The markets and the banking system become closely coupled, so that a collapse in asset prices will take down the banking system.
The money creation of bank credit makes the economy boom as you head towards a financial crisis and Great Depression.
At the end of the 1920s, the US was a ponzi scheme of inflated asset prices.
The use of neoclassical economics, and the belief in free markets, made them think that inflated asset prices represented real wealth.
1929 – Wakey, wakey time
Bankers get to create money out of nothing, through bank loans, and get to charge intereston it.
https://www.bankofengland.co.uk/-/media/boe/files/quarterly-bulletin/2014/money-creation-in-the-modern-economy.pdf
Bankers do need to ensure the money they lend out gets paid back to balance their books.
Banking requires prudent lending.
If someone can’t repay a loan, they need to repossess that asset and sell it to recoup that money.
If they use bank loans to inflate asset prices they get into a world of trouble when those asset prices collapse.
As asset prices collapsed in 1929, the banks became insolvent as their assets didn’t cover their liabilities.
They could no longer repossess and sell those assets to cover the outstanding loans and they do need to get the money they lend out back again to balance their books.
The banks become insolvent and collapsed, along with the US economy.
When banks have been lending to inflate asset prices the banking system is in a precarious state and can easily collapse.
What was the ponzi scheme of inflated asset prices that collapsed in Japan in 1991?
Japanese real estate.
They avoided a Great Depression by saving the banks.
They killed growth for the next 30 years by leaving the debt in place.
https://www.youtube.com/watch?v=8YTyJzmiHGk
What was the ponzi scheme of inflated asset prices that collapsed in 2008?
“It’s nearly $14 trillion pyramid of super leveraged toxic assets was built on the back of $1.4 trillion of US sub-prime loans, and dispersed throughout the world” All the Presidents Bankers, Nomi Prins.
We avoided a Great Depression by saving the banks.
We left Western economies struggling by leaving the debt in place, just like Japan.
It’s not as bad as Japan as we didn’t let asset prices crash in the West, but it is this problem has made our economies so sluggish since 2008.
We never did resolve the problems after 2008.
We stopped a complete collapse in asset prices as they experienced in Japan.
We left the banking system and the markets closely coupled.
The FED have been pumping in liquidity ever since.
As soon as the markets start to fall, the FED resorts to option 2.
There are no good options, it’s a catch 22.
the problem with dim wit free traders is that they cannot understand that 0% interest rates is a desperate attempt to fill a bucket up that has no bottom, to damn dumb and greedy to figure this out.
So there is no place to hide for a prudent investor, buy an overpriced asset and risk deflation or keep the cash in the bank and risk losing it from a banking collapse, this is so depressing.
I am less convinced by your banking collapse idea however.
The way things are going, every time asset prices start collapsing , the Fed will buy more.
The Fed already owns 30% of the MBS.
Eventually they could own 100% and they could do the same with other assets.
So instead of a banking collapse I see a much more government managed world in the future.
From the Communist Manifesto main objectives:
…
5. Centralisation of credit in the hands of the state, by means of a national bank with State capital and an exclusive monopoly.
….
10. A state bank, whose paper issues are legal tender, shall replace all private banks.
This measure will make it possible to regulate the credit system in the interest of the people as a whole, and will thus undermine the dominion of the big financial magnates. Further, by gradually substituting paper money for gold and silver coin, the universal means of exchange (that indispensable prerequisite of bourgeois trade and commerce) will be cheapened, and gold and silver will be set free for use in foreign trade. Finally, this measure is necessary in order to bind the interests of the conservative bourgeoisie to the Government. Karl Marx.
I have cut this down a bit to make it shorter, which does miss out some important detail.
We have seen this over and over again during globalisation.
We need to start at the beginning, 1929.
Margin lending had inflated the US stock market to ridiculous levels.
Richard Vague had noticed real estate lending balloon from 5 trillion to 10 trillion from 2001 – 2007 and went back to look at the data before 1929.
Real estate lending was actually the biggest problem lending category leading to 1929.
Real estate lending is particularly dangerous as it forms such a large part of bank lending.
If asset prices fall here, you will cause more damage to the banking system.
Real estate – the wealth is there and then it’s gone.
1990s – UK, US (S&L), Canada (Toronto), Scandinavia, Japan, Philippines, Thailand
2000s – Iceland, Dubai, US (2008), Vietnam
2010s – Ireland, Spain, Greece, India
Get ready to put Australia, Canada, Norway, Sweden and Hong Kong on the list.
It wasn’t real wealth, just a ponzi scheme of inflated asset prices.
It depends on how bad the real estate bust is, on how much damage it will do.
It depends on what the reaction is, as to the effects.
If you let asset prices collapse, as they did in Japan, then this will do more damage.
All these real estate busts had significant effects, some more than others.
India was the last to really damage their banking system.
https://www.wsj.com/articles/indias-ghost-towns-saddle-middle-class-with-debtand-broken-dreams-11579189678
Now they need to recapitalize their banks.
Their financial system is in a bad way, recovery isn’t going to be easy.
China is now in trouble with real estate, but most think they won’t have a bad financial crisis.
They have a state banking system, they have a great deal of control over, and can stop things spiralling out of control.
Financial stability isn’t an impossible dream.
Financial stability arrived in the Keynesian era and was locked into the regulations of the time.
https://www.brettonwoodsproject.org/wp-content/uploads/2009/10/banking-crises.png
“This Time is Different” by Reinhart and Rogoff has a graph showing the same thing (Figure 13.1 – The proportion of countries with banking crises, 1900-2008).
The neoliberals removed the regulations that created financial stability in the Keynesian era.
There is a secret to financial stability, which the Asian Tigers had, and we used to have in the UK.
Banks – What is the idea?
The idea is that banks lend into business and industry to increase the productive capacity of the economy.
Business and industry don’t have to wait until they have the money to expand. They can borrow the money and use it to expand today, and then pay that money back in the future.
The economy can then grow more rapidly than it would without banks.
Debt grows with GDP and there are no problems
The banks create money and use it to create real wealth
https://www.bankofengland.co.uk/-/media/boe/files/quarterly-bulletin/2014/money-creation-in-the-modern-economy.pdf
This is real wealth that doesn’t just evaporate.
What happened in 1979 in the UK?
https://www.housepricecrash.co.uk/forum/uploads/monthly_2018_02/Screen-Shot-2017-04-21-at-13_53_09.png.e32e8fee4ffd68b566ed5235dc1266c2.png
The UK eliminated corset controls on banking in 1979, the banks invaded the mortgage market and this is where the problem starts.
The transfer of existing assets, like real estate, doesn’t add to GDP, so debt rises faster than GDP.
Before 1979 – banks lending into the right places that result in GDP growth (business and industry, creating new products and services in the economy)
Debt grows with GDP, and you have financial stability.
After 1979 – banks lending into the wrong places that don’t result in GDP growth (real estate and financial speculation)
Debt rises faster than GDP, and you are vulnerable to financial crises.
The central banks of the Asian Tigers used credit/window guidance to control bank lending.
They directed it for productive purposes, and away from financial speculation.
Ideas of financial liberalisation took hold and the Asian Crisis would soon follow.
There is an informative paper by McLeay, Radia and Thomas about Money Creation in the Modern Economy from the BOE. They also have a YouTube video.
I may have seen the reference on NC but don’t recall.
In this gobbledy-gook systwm, wealth inequality is about who gets the lowest interest rates for various loan types handed to them.
Whatever rate is pulled out of butts to base things on doesn’t matter. What matters is what rate is being passed to whom and that is selective…not any natural market forces.
The terms of loans matter, not just interest rates.
Given that an amateur economist can be as dangerously wrong as an amateur quantum mechanic (and I’m both), I have three comments:
First, Yves says: “The key driver of rising income inequality is the stagnation of real wage growth for the bottom 80% or so of U.S. households (Taylor and Ömer 2020). Real wage growth was suppressed below labour productivity growth, and this led to a secular decline in the share of wages (and a rise of profits) in national income.” Also Figure 1: Saving rates across the within-cohort income and age distribution Source: Mian, Straub and Sufi (2021), shows high income people have a higher propensity to save and so do middle aged people.
The change in national income structure favoring the rich would seem to me to increase US savings because the rich have a higher savings rate, while demography change (the baby boom aging) would seem to favor a lower national savings rate. And US immigrants and minorities who are young seem to follow the savings rate of the origin country and in my experience are also the source of large international capital flows (Chinese and Koreans save and get transfers from outside the US; Hispanics appear to save little and to transfer money overseas and American Blacks save little in cash and have been hurt by Black neighborhoods not sharing in booming home prices). Finally, to muddy things further, among my own circle, the rich have saved so much and are now spending so little that their assets are increasing quite fast not because of savings but because of investment returns. So even within the US there are these factors which may not be accurately being captured by our national statistics and I seriously wonder how accurately they treat international, inter-family transfers
Second, are we capturing real foreign savings and transfers that affect the US and world interest rate or just some form of official level of transfer?
Figure 3 shows “The aggregate saving rate and its composition: The U.S. 1950-2020 (% of national income)”. For instance, how do we treat Chinese savings invested in the purchase of or financing of the new high-rise buildings in Austin, TX (a bit of financing I know a fair amount about)? The financing isn’t “Chinese money” because it is technically coming from US banks and US incorporated investment vehicles- which often borrow money domestically based on foreign assets. China and East Asia are somehow recycling on the order of 500-600 billion dollars of our trade deficit. How is that money being recycled? I thing it is largely being treated as savings by East Asian governments and people. Some is used to buy Treasuries and Fanny/Freddie (the fear of the latter’s security partly precipitated the 2008 crash- I knew people in the meetings). But much of it invested in US real estate and companies and should show up in the top, yellow bars in Figure 3. Yet those yellow bars are surprisingly small. Are our stats simply not capturing reality?
Third, Yves said “Savings constitute the supply of loanable funds, while investment represents the demand for loanable funds, and similar to the market for potatoes or wooden shoes, an excess supply depresses the market price.”
And “Taken together, the change in macroeconomic policy regime produced a structurally low-inflation economy, based on ‘traumatised workers’ in precarious jobs, who could not plausibly fight for higher wages and more secure employment conditions, given their daily struggles and the systemic biases they are facing. The wellspring of cost-push inflation had been radically removed.”
I definitely believe the latter; Yves in Alabama and I in TX and RI see it on a daily basis. But I’m not so sure that “investment represents the demand for loanable funds”. In the late 19th century we saw how huge changes in the supply of gold and silver altered bot only inflation but also both demand and price for assets, something which was not really obvious to most of the public. Are we seeing the same thing in the US economy right now? But instead of not very visible changes in gold and silver we have not very visible changes in foreign money flowing in. This might explain some of disagreement between Yves and the writers of the article. But, again, I’m an amateur at this sort of thing.
Please read more carefully. You are attributing Servaas Storm’s text to me.
Storm is explaining how the loanable funds theory attempts to explain the rise in inequality. But the loanable funds theory is bunk.
What am i missing in regards to hearing our current system described using the therm “free market”? If it was truly free, how could there be QE? Why have so many seemingly succumbed to this rhetorical device?
This is off point to the topic of this post. And this is far too big an issue to address properly in a comment. Please see Chapter 4 of ECONNED, “How ‘Free Markets’ Was Sold” for an answer.
maybe many have ignored that banks dont use our (collective savings) to fund their loans and make a profit? that hasnt been that way n a long time, today most of their income is from fees, with a side dish of investments, and a small slice of profit from loans.
its why we dont see savings get higher rates, and why many of gone on to other ways to have savings, because today you might get .01% of interest on your savings account(s), so why have them if even low inflation rates wipe out? and i do wonder how we are determine current rate by comparing to last year? which seems to be ignoring what happened last year, the close brush with a depression? how would today not be multiple times better? course we are also having supply problems, thanks to the pandemic, and 2008 bust
So appreciated economist Servaas Storm’s dismantling of another effort by establishment and Fed economists to absolve Federal Reserve policy makers from their responsibility for the tremendous rise in economic and wealth inequality in our country and continued financial repression. Appreciated his alternative policy recommendations even more. Begs the question of whether the loanable funds model will finally be put to rest and if so, when.
It’s similar to their equating the federal government as a sovereign money issuer to ordinary households in terms of their engineered spin for an economically damaging balanced federal budget, which Americans are watching play out in corporate media and Congress right now.
There’s a relatively small but politically powerful constituency that strongly prefers the current monetary and fiscal policy set from which they have benefited enormously and want to continue to do so. That doesn’t mean we cannot change these policies, but it does mean we will need to change the incentives to do so.