By Zsolt Darvas, Senior Fellow at Bruegel and Senior Research Fellow at the Corvinus University of Budapest, Marie Le Mouel, Affiliate Fellow at Bruegel, Simone Tagliapietra, Senior fellow at Bruegel and Adjunct professor of Energy, Climate and Environmental Policy at the Università Cattolica del Sacro Cuore and at The Johns Hopkins University – School of Advanced International Studies (SAIS) Europe, and Jeromin Zettelmeyer, Director of Bruegel. Originally published at Bruegel.
Expectations of euro-area growth and inflation have deteriorated steadily since Russia’s invasion of Ukraine. Figure 1 shows the euro area’s slide towards expected stagflation. The European Central Bank now projects 2023 inflation at 5.5%, up from 3.5% in its June 2022 projections. Forecasts from the Organisation for Economic Co-operation and Development and the International Monetary Fund put it even higher, at around 6%. The ECB and IMF (and Consensus Forecasts) also foresee only barely positive growth in 2023, while scenarios in which the Russian gas supply to the European Union is cut completely indicate a recession with a 1% GDP decline in 2023. Since most of this supply cut has now happened, 2023 developments can be expected to be closer to the recession scenario than to the institutions’ baseline forecasts.
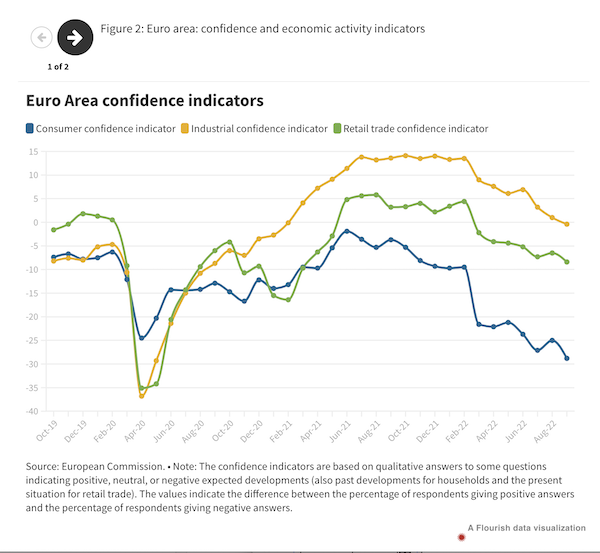
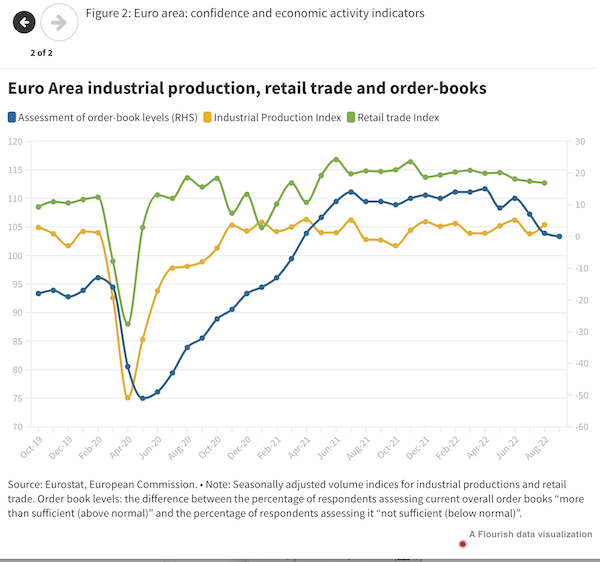
The sense that a recession is all but inevitable is driven by two factors. First, the energy price shock has been very large. Firms have faced a three-fold energy-price increase over the last year. As of August, industrial production had not started to decline, but the shock can be seen propagating through the economy in the form of lower orders, collapsing business and consumer confidence, and lower retail sales (Figure 2).
Second, monetary conditions remain accommodative, with nominal rates well below their estimated ‘neutral’ rates. But the ECB has started raising interest rates and appears set to continue, even in the face of weakening aggregate demand and falling real wages, until both actual inflation and short-term inflation expectations start falling. The full effect of the current monetary tightening will be felt in the next 12 to 18 months.
Given these expectations, can the EU only brace for recessionary outcomes, as might be caused by winter energy rationing. To the extent that there are any upside risks, can EU policymakers have any control over them? We argue they have one important tool at their disposal: the ability to influence energy prices by cooperatively increasing energy supply and reducing demand in a growth-friendly manner.
To get a sense of the macroeconomic impact if the EU energy crisis is managed successfully, we first defined some plausible scenarios for near-term energy price developments that could be influenced by policy. Second, we estimated how consumer price inflation in 2023 would react to these scenarios (see the Annex for technical explanations).
Energy Price Scenarios
The first step is exceptionally difficult. It is not possible to provide reliable energy price projections even in normal times, let alone in the current uncertain environment related to the war, looming recession and oil producers’ efforts to keep oil prices high. We thus resorted to a sensitivity analysis (Figure 3). Scenario 1 assumes a further rise in average domestic producer energy prices in the euro area to a level 10% higher than the peak they reached in August 2022, and about 20% higher than in September 2022. In scenario 2, prices also rise, but only back to the level seen in August 2022. In scenario 3 prices are assumed to decline slightly from current levels, back to the level of July 2022. Scenario 4 sees prices drop back to the average of February-July 2022, and in scenario 5, they decline to the level of February 2022, just before Russia’s invasion of Ukraine.
These scenarios reflect a combination of luck and policies.
Bad luck would mean a complete stop of EU imports of both Russian gas and oil by the end of the year, and/or higher than average winter temperatures (some estimates suggest that a one-degree lower average temperature increases winter gas consumption by 4%).
Bad policies would mean that EU countries fail to reduce their gas and electricity demand as pledged at EU level (10% gross electricity reduction and 15% gas reduction) and fail to make use of possibilities to increase supply. In the worst case, they would restrict gas and electricity flows among themselves in an attempt to safeguard domestic security of supply, resulting in market fragmentation. That would leave countries with energy supply constraints facing much higher energy prices than even scenario 1, and deeper economic contractions.
Good policies mean the opposite. The best case would be a grand energy bargain in which all EU countries work to reduce demand by incentivising both industrial and household gas users to reduce consumption and by minimising gas use in power generation, while increasing supply from new sources, keeping cross-border flows open, and engaging as a bloc with friendly suppliers including Norway and the United States.
Inflation Effect
When we estimated the empirical relationship between energy prices and consumer prices for 2000-2022 (see the Annex), we found that if energy producer prices increase by 1% over 12 months, household energy prices also go up by 0.4% and household non-energy prices by 0.04%, on average in the euro area (though there are significant differences between euro-area countries). By combining these two estimates (and also taking into account the likely increase in the weight of energy in the consumer-price inflation index as a result of higher energy prices), we estimated the total impact of a 1% increase in energy producer prices on total consumer prices at 0.08% over 12 months.
Assuming that the ECB’s forecast of 5.5% inflation in 2023 corresponds to our scenario 3, in which energy prices stay roughly unchanged from September, estimates can be made for 2023 inflation under each scenario. Scenario 1 would result in markedly higher consumer price inflation of 7.4% – very close to the 7.6% adverse inflation scenario in the OECD’s September 2022 Economic Outlook. In scenario 2, 2023 inflation would be 6.6%, while in scenarios 4 and 5 it would be 4.7% and 3.9% respectively. Compared to the baseline, the last two scenarios would allow an earlier return to the ECB’s 2% target, require less monetary tightening and hence enable a faster economic recovery.
Conclusion
The extent to which EU countries implement a strong and united policy response to the energy crisis will define the continent’s macroeconomic outlook for 2023. Should EU countries slip into energy nationalism, they will get higher energy prices and thus even higher inflation, higher interest rates and lower economic growth. In contrast, good policies in the form of an EU energy grand bargain would contain the direct impact of the energy crisis on households and firms and would stabilise inflation, reducing the need for further interest rate hikes and allowing an earlier recovery. Though avoiding recession is unlikely, making the right policy decisions will give Europe significant control over its short-term economic destiny.
The authors thank Grégory Claeys, Uri Dadush, Jean Pisani-Ferry and Nicolas Véron for useful comments and suggestions, and Catarina Martins and Luca Moffat for research assistance.
Annex: Modelling the Impacts of Alternative Energy Price Scenarios
The Wholesale Energy Price Variable
We selected the domestic energy price component of the producer price index (PPI), which is the price charged by energy producers to other companies in the domestic market. It includes all kinds of energy and translates global energy price changes, such as crude oil prices, refined petroleum prices, and the Dutch TTF gas price, to domestic producer prices. It might be impacted by government intervention to limit energy prices paid by companies.
There is a transmission from global energy prices to domestic energy PPI and then from domestic energy PPI to consumer prices. We modelled the second step only, and formulated scenarios for energy prices relative to the past values of energy PPI. In our view, the second step of transmission is highly relevant. For example, the energy-price pressure felt by shops or restaurants depends on the energy bill they have to pay, which better correlates with domestic energy PPI than with the global price for gas and crude oil, since shops and restaurants do not directly import crude oil or gas from abroad. Another advantage of using the domestic energy PPI is that it aggregates various energy components according to their use in domestic energy generation.
Producer prices are available monthly. At the time of writing, the latest available PPI data is for August 2022, while consumer prices are available for September 2022. We estimated the September 2022 energy PPI value separately for gas and electricity. For gas, we estimated a regression of the gas component of euro-area domestic energy PPI on the TTF gas price. For electricity, we estimated regressions of the German and Italian electricity components of domestic energy PPI based on their national electricity price indices (the source of these indices and the TTF price is Bloomberg). Both the TTF gas price and German and Italian national electricity price indices showed a decline in September compared to August. Our regressions suggest that the gas component of energy PPI might decline by 8% in September compared to June, while both the German and Italian electricity components of PPI might decline by 10%. Data suggests that the weight of electricity in euro-area energy PPI is around 69%, the weight of gas is around 27%, while the remaining 4% is for steam and air-conditioning supply. We assumed no change in steam and air conditioning supply prices, and thus our projections for producer gas and electricity prices imply an overall 9% decline in euro-area energy PPI. This estimate is subject to errors because we used regressions, and because we considered only German and Italian electricity prices as proxies for the euro area.
The Weight of Energy Prices in the Euro-area Harmonised Index of Consumer Prices
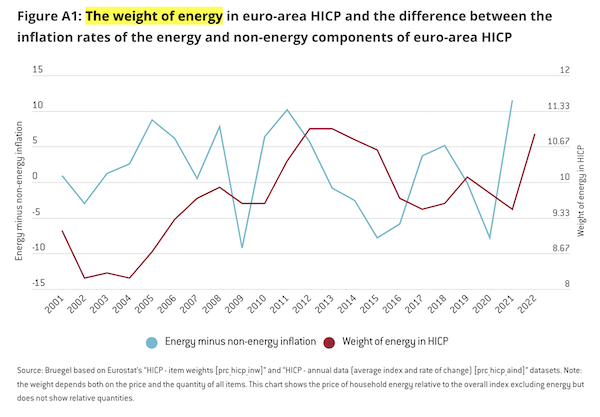
The weights of various items in HICP change from year to year, reflecting consumption spending in the preceding year. Total spending on energy depends on both the price of energy and the quantity of energy purchased. Figure A1 shows that the change in the weight of energy in HICP broadly follows the change in the relative price of energy compared to the overall index excluding energy in the previous year.
While data on the 2022 weight of energy used by Eurostat is available (since this was determined on the basis of 2021 consumption data), the data on the relative price of energy in the full year of 2022 will be available only in January 2023. The September 2022 data shows that the relative price of energy in HICP went up by 31 percentage points (measured as the 12-month moving average rate of change), while an extrapolation up to the end of 2022 suggests that the full-year relative energy price increase could be 34 percentage points. This price effect will increase the weight of energy in HICP. Most likely, households will consume less energy in 2022 than in the year before – this quantity effect (by itself) will reduce the weight of energy in HICP. Forecasts for 2022 quantities are not available.
We assumed the quantity of household non-energy consumption will increase by 5% in the euro area in 2022, while the quantity of energy consumption will decline by 6%, implying an overall 3.8% increase in total private consumption, which is the forecast of the October 2022 IMF World Economic Outlook. The expected inflation rate of household energy consumption is 39% in the full year 2022, while that of non-energy consumption is 5%. These assumptions imply that the weight of energy in HICP will increase from 10.9% in 2022 to 12.7% in 2023.
Model Estimates
We estimated two vector-autoregressive (VAR) models looking at the pass-through of energy PPI on HICP. The first model identifies the direct effect by looking at the energy component of HICP, and the second model identifies the indirect effect by looking at the non-energy component of HICP. In both models, we controlled for demand, because higher energy prices could reduce spending on non-energy goods and services and thereby reduce inflation. To proxy demand conditions, we used either the unemployment rate or retail sales volume.
As a baseline, we estimated the models on the log-level of prices, the log-level of retail sales volume, and the untransformed unemployment rate. Such a specification results in consistent estimates irrespective of whether there is a cointegration relationship among the variables. We also tried a specification in which we differenced the variables and found that our results were robust.
We estimated the generalised impulse response function developed by Pesaran and Shin (1998), which achieves uncorrelated residuals irrespective of the ordering of the variables, in contrast to the frequently used Cholesky decomposition. Shocks identified by the Pesaran and Shin (1998) methodology can be interpreted as shocks to the variables on the left-hand side of the VAR, but these shocks are not structurally identified in the sense of being derived from a particular theoretical framework. We studied the impacts of a shock on energy PPI. Since an initial energy PPI shock also impacts the future values of energy PPI, while in our scenarios for energy PPI we assumed that energy PPI stabilises at an unchanged value, we calculated the impact of an energy PPI shock on HICP relative to energy PPI over 12 months and used this magnitude to derive scenarios for HICP based on scenarios for energy PPI.
We found that if an energy producer price shock increases energy producer prices by 1% over 12 months, then household energy prices go up by 0.383% and household non-energy prices go up by 0.0385% on average in the euro area. By combining these two estimates, the total impact of a 1% increase of energy producer prices on total consumer prices would be 0.076% over 12 months in 2022 and 0.082% in 2023 – the higher value for 2023 reflects the higher weight of energy in HICP in 2023, as discussed above.
Beyond estimating the VARs for the euro area as a whole, we also estimated separate models for each of the 19 euro-area countries and then weighted the results to obtain an aggregate measure for the euro area. This weighted result and the direct estimate for the euro area were similar. We note, however, that results for the 19 countries indicated a large degree of heterogeneity.
As a baseline, we used the January 2000-August 2022 sample period for estimation. Notably, energy prices have increased much more since 2021 than in the past. The sample period since 2021 is too short to make reliable estimates. The impact of energy PPI on HICP can be non-linear and thus results for the outlying recent period might be different from the preceding longer period when energy prices did not fluctuate that much. Additionally, government interventions in household energy prices could dampen the impact. These caveats should be kept in mind when assessing our results.
Projections for 2023
We report results for five alternative scenarios for energy PPI, which are specified relative to past values of the energy PPI: (1) a 10% increase compared to the peak value in August 2022, (2) unchanged prices at the August 2022 level, (3) a decline to the July 2022 level, (4) a decline to the average level of February-July 2022, and (5) a decline to the February 2022 level. Even if the domestic energy PPI is an imprecise proxy for global energy price movements, our scenarios relative to past values of the energy PPI can well illustrate possible future scenarios.
Once our scenarios for energy PPI were established, we converted these scenarios to total HICP. To this end, we assumed our scenario 3 is consistent with the ECB’s baseline forecast made in September 2022. The ECB reports quarterly inflation rate projections under its baseline scenario: we assumed that a forecast quarterly inflation rate applies to all three months of the particular quarter. By using these monthly forecast inflation rates, we calculated the level of the monthly HICP index (measured as 2015=100), starting from its September 2022 actual value up to December 2023. We then calculated the annual inflation rate as the average of the forecast monthly price level in 2023 divided by the average monthly price level in 2022.
For scenarios 1, 2, 4 and 5, we adjusted the 12-month HICP inflation forecasts for October 2022-December 2023 with the product of a constant and the difference between the 12-month energy PPI inflation of the scenario studied and scenario 3. The constant is 0.076 for 2022 and 0.082 for 2023. Using these adjusted monthly inflation forecasts, we calculated the forecast price level for October 2022-December 2023. Finally, we calculated the average annual inflation for these four scenarios the same way as we calculated it for scenario 3.


This is a nice job of defining and evaluating some of the economic scenarios, and many key variables.
There are a few key variables that didn’t get mentioned. Where are the effects of:
a. closing off access to Asian markets for EU goods (via addn’l eye-poking of China). It’s not just supply of goods that’s being curtailed, it’s the supply of markets for those goods. Bookings are falling off quickly; not just domestically but also from foreign customers
b. insufficient alternatives for Russian gas. Are there viable alternatives (cost and volume)? I didn’t see any supply analysis that would support the assumption that supply will stabilize or even increase.
c. Social support costs. If, as Yves posits, the EU heads into Depression territory, then a lot of money’s going to get spent maintaining the public’s well-being. Where’s that going to come from in an environment of rate-hiking, QT, falling tax revenues, weakening currency, high debt levels?
d. EU has to find new products to sell. It will not have cheap energy again. (please rebut). That means massive investment in new products and the production gear necessary to field them. Major investment. Where does that come from in this financial environment?
e. Production equipment vacates. If the energy problem isn’t solved definitively in a year or two, energy-intensive operations will have to move to cheap-energy locations. Not the E.U. Where does that figure into the analysis? What effect on building new product lines will the exodus of key companies have?
This isn’t just a momentary economic energy-speedbump. This is a product-line and markets fork in the road…and not just for Germany and Italy, but for the E.U. in general.
If you’re in agreement that this is a timely moment for a referendum on E.U. products and markets, what products and markets would you advise the E.U. to pursue?
Germany already has “passivehaus” standards for building, and buildings are responsible for 40% of CO2 emissions (says Rocky Mountain Institute), so I’d say they could show the way for better buildings.
Then there’s agriculture: Michael Pollan says the U.S. burns 10 calories of petroleum to produce one calorie of food. Set right, this could sequester carbon (in the soil) and show the rest of the world how to do actual solar ag….
On the other hand, U.S. insistence on sabotage and violence as its preferred instrument of foreign policy (see this Tweet thread, for one example) would undermine any potential constructive outcome.
I honestly don’t think it’s possible to overestimate the hatred of the U.S. oligarchy for the social safety nets and comforts (six week vacations!) the Europeans enjoy. We must have labor discipline!
Adam:
Great suggestions. To build on your ideas, I assert that EU may be the first Western segment to face hard resource limits on food, materials and energy while still expecting a high std of living. That may precipitate the transition to materials re-use that the West has been avoiding to date. Same with major refit of buildings, per your suggestion.
Also there’s the potential of wind/solar. EU has all the mechanical and chem engineers it needs to make renewables truly viable, but they must address the intermittency problem.
Here in the U.S. there’s a company called Cummins. They manufacture (mostly) diesel engines for the transportation, agriculture, marine, and oil-field industries.
They’re a huge, vital, resourceful and well-managed component of the U.S. fossil-fuel-based industrial tool-set. If ever there was a quintessential U.S. industrial bellwether, this is it.
Here’s Cummins’ “our future as a company” online brochure.
That brochure describes how Cummins will take a leading role in the hydrogen economy. Note that many of their “future economy” products are available now; they’re not hand-waving vapor-ware. You can order them now.
See page 11 of the brochure.
Remember all that crazy stuff I was talking about – renewables to fuel to electricity? Co-locate industrial processes next to heat-producing elec-fuel-elec conversion systems? All that crazy stuff?
See page 11, folks. There it is, black-and-white, real-time.
If Cummins can do it, so can Siemens, or VW, or Scania, or Fiat.
So, those are some product ideas, now let’s talk markets.
Most of Africa, South America, and Southeast Asia has no oil or gas. They do have plenty of wind and sun, though. Boy do they need the products mentioned above. Materials cycling, input-efficient ag systems, renewable energy, energy- and materials-efficient steel, cement, insulation, plastics, petro-chem, glass production systems.
Each of those key production processes can be heated, fueled, or feedstock-provided by the toolset presented right there on … Page 11.
Who else can add to Adam’s list of new products and markets for the EU?
Here’s another question.
Can you think of a good reason why the U.S. isn’t providing these types of capabilities to … Africa, South America, SE Asia…etc?
What if we provided something useful, instead of bombing and robbing these countries?
Think how good we could be.
Integration of energy policies sounds nice but impractical, at least in some of the grids or sub-grids. Instead of integration there is a high risk of tougher competition for a scarce resource with governments trying to protect their industrial champions possibly against other countries interests.
As Tony Blinken has said, the blowing up of the gas pipeline represents ” a remarkable opportunity.” Yes, an opportunity for US fossil fuel producers to have Europe dependent on US suppliers at exorbitant prices. That should help. Or maybe we should allow Liz Truss to enact all her “pro growth” policies. What makes the author of this paper think that the leaders of Europe can make any intelligent decisions. They seem to be only good at following US imposed policy.
How is any economy going to have positive outcomes while ignoring the acceleration of negative consequences due to global warming? Or the possibility of expansion of war to the rest of Europe? Surely, these authors will find the silver lining in all of this.
It is so weird to simply throw in 10% and 15% reductions without discussing who (households? heavy industry? Poland?) is doing the reducing. That’s the biggest problem!
Where does the analysis cover the human behaviour factor? All I see is a lot of theory and statistical analysis, and a few mentions of good and bad policies. What about the irrational behaviour of EU politicians, time and time again going against better-informed advice and cooler headed thinking?
Even just a year ago, nobody in their right mind would have imagined that the EU could be so stupid as to inflict upon itself such a devastating economic blow with its many sanctions against Russia that have backfired so spectacularly. Russia’s economy is recovering and growing (even The Economist admits this), while the EU’s is doing the opposite.
When we look back in another year, what unimaginable stupidities will we see that we can’t imagine today?