By Lambert Strether of Corrente.
“‘The absence of a thing,’ the Baron said, ‘this can be as deadly as the presence.'” –Baron Harkonnen, Dune
Once again, I’m perambulating the biosphere, but this time looking for something that’s missing: Water, missing because of drought, or what we call drought. There is plenty of drought in the world just now (“35% of land area is affected by droughts, which is the greatest loss among losses of all natural disasters”). The United States isn’t as at risk as, say, Moldova, not nearly, but we have our problems. Here is a *.gif for the last six weeks from Drought Monitor. It ought to be animating; if it is not, go to the originating site at the link below:
(A *.gif covering six weeks is the largest file I can upload to the site; however, Drought Monitor has animations covering the whole year, and many past years. Here is another source.)
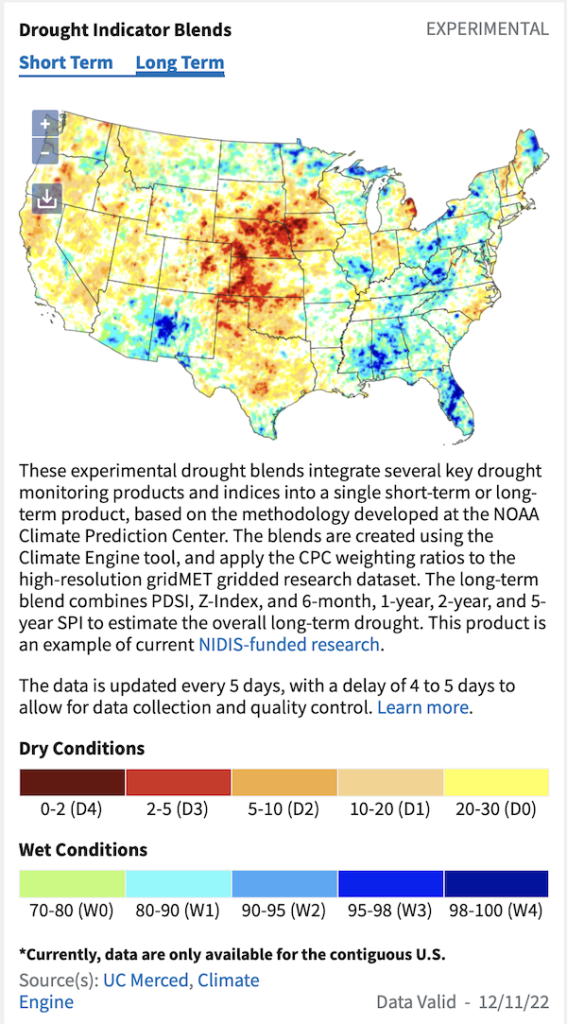
In prose, from Drought.gov, our current conditions:
As of December 13, 2022, 44.51% of the U.S. and Puerto Rico and 53.20% of the lower 48 states are in drought, according to the U.S. Drought Monitor.
44.51% is a lot, although not necessarily by historical standards. From the Union of Concerned Scientists:
In 2020, scientists reconstructed soil moisture data for the last 1,200 years. This was accomplished by creating a correlation between tree-rings and soil moisture, which is a standard measure of drought.
Tree rings record the growth of trees year after year and for a Western States climate in the U.S., the wider the tree-ring, the more water (soil moisture) the tree had available that year. By correlating this information with recorded climate data that has been measured over the past 120 years, it is possible to link the width of tree-rings to drought conditions. They have then applied that tree-ring width to moisture relationship to data from much older trees. The result is an incredibly precise record of soil moisture over 1,200 years.
Two years ago, when the study was published, it revealed that this dry period was the second-worst in the past 1,200 years, exceeded only by a megadrought (a dry period lasting for decades) in the late 1500s. After two more dry years (2020, 2021), the current period of dryness in the Western United States broke that record, and the last 22 years have now been the driest in at least the last 1,200 years.
(Tree rings also suggest that drought encouraged Attilla the Hun to attack the Roman Empire in the 4th and 5th centuries CE.) Of course, some models suggest that there’s reason for optimism. From Drought.gov:
In this post, I want to present what I hope is enough background information so that you, readers, can interpret the news on drought and use your critical thinking skills. I will discuss the definitions, plural, of drought, the classification systems, plural, of drought. I will briefly ask why drought occurs. I wll close by looking at river systems, and drought in the Southwest.
What Is Drought?
There are over 150 definitions of drought, which “reflect differences in regions, needs, and disciplinary approaches.” Here is the definition used by the National Weather service (from Kid’s Corner (!)):
What is meant by the term drought?
A drought is defined as “a period of abnormally dry weather sufficiently prolonged for the lack of water to cause serious hydrologic imbalance in the affected area.” -Glossary of Meteorology (1959).
But:
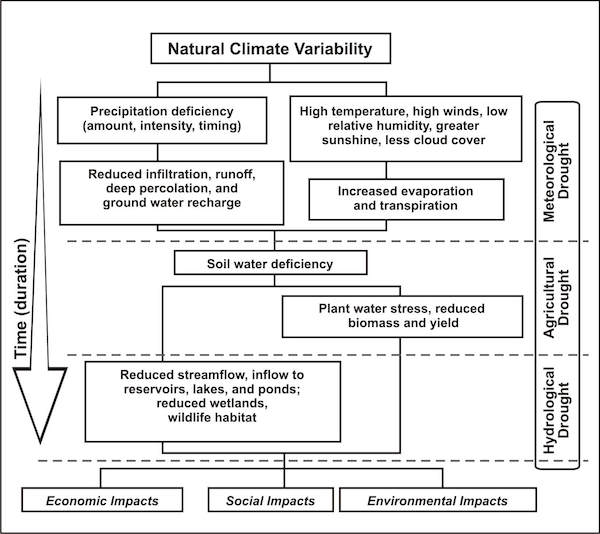
There are actually four different ways that drought can be defined.
Meteorological-a measure of departure of precipitation from normal. Due to climatic differences, what might be considered a drought in one location of the country may not be a drought in another location.
Agricultural-refers to a situation where the amount of moisture in the soil no longer meets the needs of a particular crop.
Hydrological-occurs when surface and subsurface water supplies are below normal.
Socioeconomic-refers to the situation that occurs when physical water shortages begin to affect people.
Here is a handy chart from the National Drought Mitigation Center that relates three of the four (at right) with socioeconomic drought at the bottom:
Nevertheless, the charts and the definitions aren’t so easy to match up with what’s on the ground — or under it. From the United States Geological Service:
Defining drought may seem easy. If an area receives less rain or snow than expected over the course of a year, it can be classified as being in drought. The severity of drought increases over time depending on how long an area remains arid. However, there’s more to the story than solely if there isn’t enough rain or snow.
Droughts don’t just affect water stored in wetlands, lakes, and rivers, but also water below ground stored in aquifers and in the soil. When this groundwater gets used up, the dry ground can act like a sponge, sucking surface water straight in. The surface water-groundwater relationship gets even more complicated with snowpack. If snow melts too early in the year, water can move through the environment too quickly, causing the ground to dry up and become “thirsty” too soon. So even if there is “enough” water, the timing of the water may dictate whether an area is in a drought.
So, readers, when you see the word “drought” in a headline, there may be more angles than you — or the reporter — are aware of. (Below, I will look at drought from the hydrological and socioeconomic perspectives.)
How Are Droughts Classified?
Recall that the National Weather Service defined drought as “a period of abnormally dry weather.” But “abnormal” compared to what? How measured? Over what time period? To answer questions like these, we have classification systems for drought. From the National Center for Atmospheric Research (NCAR):
To quantify drought and monitor its development, many drought indices have been developed and applied. Among them, the Palmer Drought Severity Index (PDSI) is the most prominent index of meteorological drought used in the United States for drought monitoring and research, and its variants have been used to quantify long-term changes in aridity over land in the 20th and 21st century. The PDSI has also been widely used in tree-ring based reconstructions of past droughts in North America and other regions.
Drought.gov explains how to read the Palmer index:
The [Palmer Drought Severity Index (PDSI)] is a standardized index based on a simplified soil water balance and estimates relative soil moisture conditions. The magnitude of PDSI indicates the severity of the departure from normal conditions. A PDSI value >4 represents very wet conditions, while a PDSI <-4 represents an extreme drought.
NCAR explains how the PSDI is constructed:
It incorporates antecedent and current moisture supply (precipitation, P) and demand (potential evapotranspiration, PE) into a hydrological accounting system, which includes a 2-layer bucket-type model for soil moisture calculations.
The eponymous Palmer is Wayne C. Palmer, who wrote “Meteorological Drought,” Research Paper No. 45, U.S. Department of Commerce (1965). From that paper, Palmer’s key analogy:
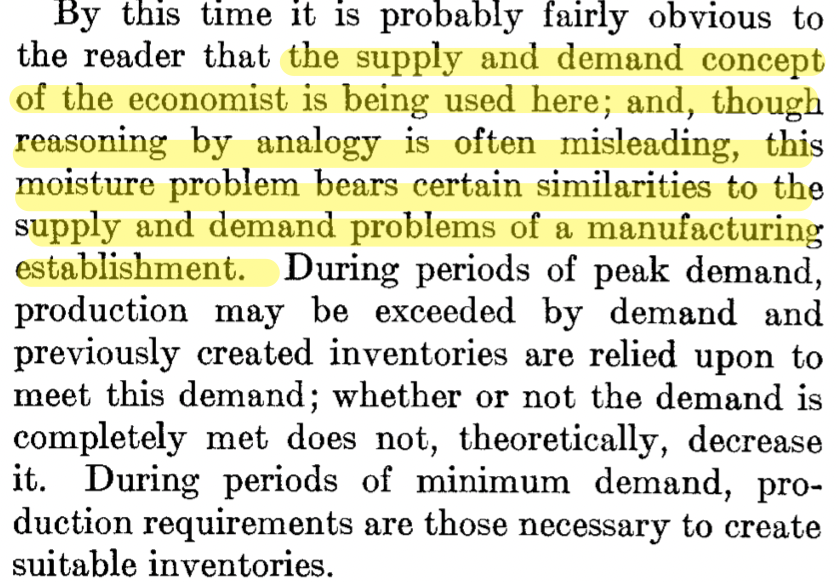
Supply and demand, eh? I have to admit I’m a little nonplussed to see Economics 101 at the conceptual heart of a critical drought index. (More than a little nonplussed. Supply and demand curves exist, at least on the economist’s blackboard, to determine the equilibrium (“balance,” above) or “marketing clearing price at which demand equals supply.” But I believe that pricing so-called ecosystem services — like soil moisture — is nothing more than throwing darts at a board, even if the darts, the board, and the pub are all owned by very important people. Reasoning backward, I must also believe that Palmer’s got hold of the wrong analogy.
So, readers, when you see a map or a chart representing drought, ask yourself which index the represenation is based on, and if it’s Palmer — it most likely is[1] — then recall the analogy it’s based on.
Why Drought?
From Vox, the conventional wisdom. “Why the US is suffering a widespread drought“:
California’s longest drought on record stretched nearly an entire decade from December 2011 to March 2019, and the “megadrought” that’s taken hold in southwestern North America for 22 years marks the driest the region has been in at least 1,200 years.
Climate change has made the perennially dry region even more arid. Hotter temperatures simply dry out soil and vegetation faster. But there are other factors at play — like La Niña. The phenomenon generally shows up every two to seven years as part of a recurring climate pattern called the El Niño-Southern Oscillation (ENSO). Only when La Niña appeared in 2020, it, like everything else about that year, wasn’t ordinary.
Expected to persist into a third winter, the world is facing a rare “triple-dip” La Niña. This marks only the third such “triple-dip” event since the 1950s, according to [Brad Pugh, a meteorologist at NOAA].
One difficulty here — and I’m not a global warming denialist by any stretch of the imagination — is that droughts are hard to predict. From the Federation of American Scientists, “Drought in the United States: Causes and Current Understanding“:
Predicting the intensity and duration of severe drought over a specific region is not currently possible more than a few months in advance because of the many factors that influence drought.
A second difficulty is the state of the discourse (which I hope you can now see, from the discussion of drought definitions and classification, has more subtleties than most opinion-havers can cope with). For example, here is the Guardian, from a series on Climate change:
The 2022 study, published in the journal Nature Climate Change, attributed 42% of the last two decades’ hot and dry conditions to global heating.
The 42% factoid was picked up by Politico:
Authors of a recent study in the journal Nature Climate Change found that 42 percent of the drought is attributable to human-caused climate change, confirming experts’ worst-case prediction for the current level of global warming.
I looked at the Nature study. That’s not what it says. From the Abstract:
A previous reconstruction back to 800 CE indicated that the 2000–2018 soil moisture deficit in southwestern North America was exceeded during one megadrought in the late-1500s. Here, we show that after exceptional drought severity in 2021, ~19% of which is attributable to anthropogenic climate trends, 2000–2021 was the driest 22-yr period since at least 800. This drought will very likely persist through 2022, matching the duration of the late-1500s megadrought.
Even this humanities major knows that 19 ≠ 42. So where does the 42% figure come from? My best guess is from further down in the article:
Using the 29 CMIP6 models with adequate data, the multimodel mean ACC trends account for 42% of the [Southwest North America (SWNA)] soil moisture anomaly in 2000–2021 and 19% in 2021.
As you know from the perhaps-to-extended discussion above, soil moisture is not the only form that water takes.
So, readers, while again I don’t deny the existence or severity of anthropogenic climate trends, you’ve got to careful not to accept what journanimalists write uncritically. As with Covid, so with drought (and climate generally): Check sources.
Now let’s finally turn to conditions on the ground and in the soil.
Hydrological Drought in American Rivers
In this section, I’ll just run through rivers. We have a lot of drought! I’ll start with the Hudson, because the Hudson?!
Hudson River. From Patch, “Drought Across The Hudson Valley Is ‘Severe’ West Of The River,” in August:
The drought affecting the Hudson Valley sweeps from southern New Jersey to northern Maine. The New York Department of Environmental Conservation has placed all but Westchester County under a drought watch.
Mississippi River. Here’s a photo of the Mississippi River this summer:
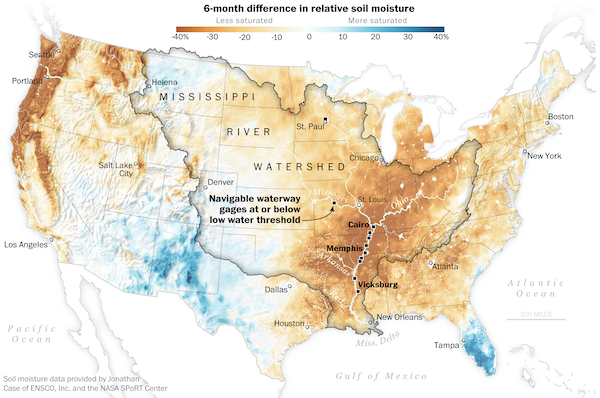
That’s dry. From The Conversation:
The Mississippi River’s watershed drains an area that covers 1.2 million square miles (3.2 million square kilometers) – more than 40% of the continental U.S. This produces a huge flow, especially on the lower Mississippi as more tributaries empty into it.
When water levels are normal, more than 500,000 cubic feet (14,000 cubic meters) flow past Memphis every second. That’s enough to fill the Rose Bowl stadium in Pasadena, California, in less than a minute.
Stream flow in the lower Mississippi can be slow to respond to changes in precipitation, since water must travel long distances to reach the region. During the recent flash drought, however, water levels in the river declined sharply from August into October, reaching a historic low on Oct. 20, 2022, at Memphis. The river fell by 20 feet over 11 weeks.
The 2022 flash drought occurred within a long-term trend in which annual minimum water levels on the lower Mississippi River have declined over the past century. In other words, yearly lows are getting lower.
(PBS describes the effects in terms of socioeconomic drought; for example, to barges.) 20 feet? That’s a lot.
Colorado River. Here is a map from The Economist showing how the Colorado flows through the drought-stricken Southwest:
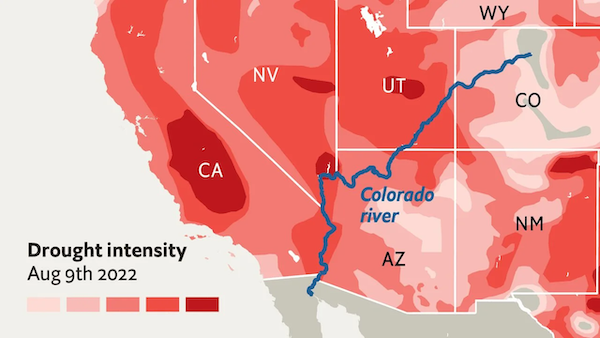
From the Los Angeles Times:
The Colorado River’s largest reservoirs stand nearly three-quarters empty, and federal officials now say there is a real danger the reservoirs could drop so low that water would no longer flow past Hoover Dam in two years.
That dire scenario — which would cut off water supplies to California, Arizona and Mexico — has taken center stage at the annual Colorado River conference in Las Vegas this week, where officials from seven states, water agencies, tribes and the federal government are negotiating over how to decrease usage on a scale never seen before.
Outlining their latest projections for Lake Powell and Lake Mead, the nation’s two largest reservoirs, federal water managers said there is a risk Lake Mead could reach “dead pool” levels in 2025. If that were to happen, water would no longer flow downstream from Hoover Dam.
“We are in a crisis. Both lakes could be two years away from either dead pool or so close to dead pool that the flow out of those dams is going to be a horribly small number. And it just keeps getting worse,” said Tom Buschatzke, director of the Arizona Department of Water Resources.
He said there is a real danger that if the coming year is extremely dry, “it might be too late to save the lakes.”
Socioeconomic Drought in the Southwest
Nature defines “the Southwest”, and documents the economic importance of the region:
The start of the 21st century CE has witnessed intense drought conditions in the American Southwest (SW). This region—comprising the states of California, Nevada, Arizona, Utah, New Mexico, and Colorado—has a human population of over 60 million, including indigenous peoples and their historical tribal lands (as of 2019)1. Economically, the region is responsible for $4.2 trillion annually in the gross regional product (as of 2018)2, the fourth largest in the world if the region were a separate country; it also includes the largest port complex in North America (Los Angeles-Long Beach, California) and globally important agriculture, information technology, arts, entertainment, media, aerospace, biotechnology, medicine, and associated research industries…. The ongoing bidecadal (two or closely approximating two decades in duration) drought has led to historically unprecedented stress on critical water resources in this semi-arid to arid region. In the spring of 2022, North America’s two largest reservoirs—Powell in Arizona and Utah and Mead in Nevada and Arizona—were at their lowest levels since initial filling, leading to cessation or reduction of water and electric power deliveries with far-reaching impacts on urban, agricultural, and tribal areas and economies, along with ecosystem and landscape aridification and increased incidence of extreme fires in the region
Here is a map from the American Geophysical Union that shows how Southern California depends on the Colorado River:
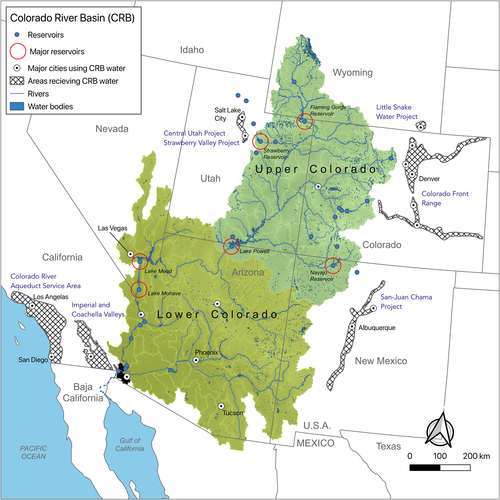
And here is a map from Geology.com that shows Southern California doesn’t have much else going for it, in terms of rivers in the immediate area:
(Because who hasn’t seen Chinatown?) Hence, from the Associated Press, “Nation’s largest water supplier declares drought emergency“:
The nation’s largest water supplier has declared a drought emergency for all of Southern California, clearing the way for potential mandatory water restrictions early next year that could impact 19 million people.
The Metropolitan Water District of Southern California provides water to 26 different agencies that supply major population centers like Los Angeles and San Diego counties.
It doesn’t rain much in Southern California, so the district imports about half of its water from the Colorado River and the northern Sierra Nevada via the State Water Project — a complex system of dams, canals and reservoirs that provides drinking water for much of the state.
It’s been so dry the past three years that those water deliveries have hit record lows. Earlier this year, the district declared a drought emergency for the agencies that mostly depend on the State Water Project, which covers about 7 million people.
On Tuesday, the board voted to extended that declaration to cover all Southern California water agencies. They called on agencies to immediately reduce how much water they import. By April, the board will decide whether to make those cuts mandatory if the drought continues.
State officials recently announced that water agencies like Metropolitan will only get 5% of their requested supplies for the start of 2023 due to lower reservoir levels. Some agencies may get a little bit more if its necessary for drinking, sanitation or other health and safety concerns.
Oh, and:
Up to 75% of all water used in Southern California is for irrigating yards and gardens. Water agencies dependent upon imported water from the state have had restrictions for much of the year, including limiting outdoor watering to just one day per week.
Have I mentioned that lawns are evil? And that xeriscaping is good[2]? (I think I must have; and I’m sure readers will have their own thoughts and techniques to add.) Lord knows I don’t believe that “If only the consumers did the right thing, the _____ crisis would be solved.” That said, 75%? Really? There’s a lot of scope for individual action, there. And collective action, too.
Conclusion
One more thought, and I’m sorry it has to come from the World Economic Forum (WEF):
A 2013 study published in the journal ScienceDirect found that 92 percent of humanity’s freshwater use can be attributed to the agriculture industry, and nearly one-third of humanity’s freshwater use is used for animal products, such as meat, dairy, and eggs. Animal products are some of the most water-intensive foods, according to research by the Water Footprint Network.
Of course, the WEF wants us to eat bugs. No thanks. That said, there’s incredible scope to reform food preparation to use less water, and to treat meat, dairy, and eggs as condiments, instead of mains. More scope for individual action. And more collective action, too.
NOTES
[1] For example, the page for NOAA’s maps has this URL: “/historical-palmers/maps/phd/202112-202211.”
[2] So go long xeriscaping. Short lawns.


Vegan Men Fart Seven Times More Than Non-Vegans, Study Finds
https://www.menshealth.com/uk/nutrition/a37590491/vegan-men-fart-seven-times-more-than-non-vegans-study-finds/
“At the end of the study, they found that subjects eating “a low fat, fibre-enriched Mediterranean-style diet” not only produced more stool – and softer stool – but also farted up to seven times more a day. What’s more, each fart contained about 50 per cent more gas.” (vs high fat western-type diet)
A tax on vegan farts…..?
If those farts are mostly methane, then . . . yes . . . ?
or mandate beano now for all vegans!
https://www.beanogas.com/
Carbon capture! This could be a solution for Germany, particularly in this season of snow and red cabbage.
“At the end of the study, they found that subjects eating “a low fat, fibre-enriched Mediterranean-style diet” not only produced more stool – and softer stool – but also farted up to seven times more a day”
Does that mean that more Covid virusis shed through that food intake regimen if one has Covid? And does the emitted gas contain aerosoled virus that can transmit to other exposed to the gas?.
Yes, there is going to be a severe reckoning over water availability for agriculture, manufacturing, and personal use (at our homes). Since the California Central Valley produces major amounts of fresh food for US cities, this is going to be felt by mucho grande hombres.
As and aside, early December produced big rainstorms (more than an inch ;) and people in my town were absolutely giddy with glee. It’s now been ten days past and Xmas Day will be dry and 72F. The weather gods like to tease.
People living outside the most and/or deepest drought-prone zones should learn to live without any food coming from those zones. The non-drought areas can produce enough health-maintainance survival food to keep everyone in the non-drought zones alive and surviving. But they may have to resign themselves to none of the fun foods from California and Arizona ever again. In Michigan that might mean spinach during a 1-month spinach season. And kale kale kale for the other eleven months of the year.
People living inside the most and/or deepest drought-prone zones will have to devote their entire agricultural economy to growing the less-water-needed edible crops which the people inside those zones can survive on over the long haul. No more almonds and grapes. Lots of mesquite beans and immature cactus pads ( nopalitos).
Didn’t Friedrich Engels once say something about “freedom” and the “recognition of necessity”?
I don’t see why seasonal good is such a bad thing.
It used to be all we knew. When it becomes all we know again, we’ll get used to it in time.
As a Michigan farmer and gardener your spinach statement is hyperbole. Spinach is a light sensitive crop so when we get our long light periods in the summer it bolts. This means the plant goes to seed production rather than leaf production. Obviously with spinach we want the leaves so the season ends when the June long light period takes over. We always have at least 2 months of spinach in the spring season, and in a mild spring, longer.
The short light period returns in the fall and you have a second go at spinach, September, October, November, and in a mild winter like the last two, December. We have beautiful rows of spinach in our garden that we just put row covers over in the last few days as it is predicted to drop into the teens.
Under row covers, or on a larger scale in a unheated greenhouse you can have spinach all winter in Michigan.
You just picked on the wrong crop. If you want to make a case for tomatoes, peppers, lima beans, and other heat loving plants having a short season in Michigan it would be more accurate, but they have a 3 to 4 month producing season, not 1 month. And you picked on the wrong state. Michigan produces much more than kale. Michigan is acknowledged as one of the most agriculturally diverse in the country, producing apples, cherries, asparagus, radishes, parsnips, turnips, beets, carrots, onions, potatoes, celery, leafy lettuces, zucchini, yellow squash, peppers, cucumbers, sweet corn, cabbage, hard squash, green beans, hot peppers, celery root, bok choy, napa cabbage, eggplant and more.
Indeed, Michigan is America’s second-most agriculturally diverse state, ranking near the top in production of asparagus (first place), cucumbers (second), winter squash (second), pumpkins (third), summer squash (third) and sweet corn (fourth). It also ranks high in production of onions, carrots, celery, bell peppers and tomatoes.
Thanks for this. What this means is that the cessation and disappearance of food coming in from California and Arizona will not be as much of a problem as I might have thought.
And Michigan is more central from a distribution point of view!
We produce food in an incredibly wasteful manner. Growing crops for profit while not paying their share in water consumption, leading to almonds and pistachios and alfalfa crops that are quite simply as wasteful than if all of us in socal had pools with cracks in them. Also, too many foreign companies are using our groundwater to grow water thirsty crops and sending the product back to their homeland. Saudi Arabia growing alfalfa to feed their cows back home is a great example.
A reconning is coming but it’s not the outside watering in LA that’s the problem. We’ve massively reduced our water consumption since 1990. The same cannot be said for the pistachio growers – though they are able to take the profits and donate to think tanks in DC to push sanctions on Iran, who produce the best pistachios in the world. And don’t get me started on places like Arizona, where angry farmers get in fist fights to protect Dubai companies sucking all the water out of their ground to grow crops.
The studies of drought are historical, ie reports of dependent variables, such as rainfall and water levels. It would seem just as important to look at upstream variables such as sea surface temperatures, ice caps, and jet streams. Studies of the various layers of website, Earth dot Nullschool dot Net are very instructive almost immediately on a global scale.
I admit this is a hobby in my retirement and must point out that following it gives me some immediate view at the formation of the Rossby waves created every summer across the planet, as well as the coral bleaching taking place across the oceans, and the wildfires forming across the planet.
Rather than read about this or that in the news, a daily look at various aspects of the atmosphere allows one to watch the droughts in their formation and perhaps get an inkling of what is happening as it is occurring, and realize how we are all interconnected.
Well, maybe my next perambulation will be into the air…. Or perhaps for the Rossby Waves, into the ocean. Or maybe extremely large oscillations regardless of medium or time scale, from volcanic eruption shock waves to to tectonic planes….
I’ve been watching how sea surface temperature anomalies may be affecting jet streams. Since the latter direct precipitation, there seems to be a link between warm ocean water, jet stream alterations, and rainfall.
Additionally, any “hotspot” can create a meteorological high pressure cell so powerful, that it force jet streams from their normal path, as evidenced by the annual stratospheric high pressure parked over the SW US every summer.
Other such persistent “Highs” exist in other locations on the planet.
A great article. Bookmarked to classify the type of draught when I read about one. Thank you.
If water doesn’t flow downstream from the Hoover Dam it will not flow into Lake Havasu and through the four Parker Dam generators which power the five pumping stations for the Colorado River Aqueduct supplying much of SoCal’s water. With agricultural and ranching exports contributing less than $50B to SoCal’s $1.6T GDP, I anticipate water allocations will be adjusted accordingly.
I guess that water is just like real estate, location, location, location.
Around here in the North American Deep South we are having yet another wetter than ‘average’ year. Right now, our immediate environs are seven inches of precipitation above average. Local records go back to before 1900. The tornado front that just passed over us dropped two inches plus of precipitation in one day. Our street was flooded. The local storm drainage system, designed and built in the 1930s, is not up to the “new normal” in rainfall.
There is local agriculture, but, and it is a big but, most of it is concentrated in export cash crops like soybeans, and, this being the South, cotton. Just north of us is a sixty or seventy acre blueberry plantation. All of it’s crop is contracted for “export” to processing plants.
There are local working food crop farms, but they are aimed almost exclusively at the high income populations. One local grocery mini-chain that sells mostly to the upper income market sells the ‘fruits’ of the labours of these local farmers. The items are priced accordingly. For example, local yellow squash and zucchini are presently offered at $2.49 USD per pound weight. A small bunch of green onions, six stalks, is $1.49 USD a “bunch.” Local sweet potatoes might be the exception, selling for $.99 USD the pound weight.
So, the upshot is that Da South has ample acreage to expand food crop production. It is just being used for ‘other’ purposes.
The recent December rains in California have been very nice even though it was a month early. The first heavy rains normally means the start of the three month long rainy season. And hopefully, by the end of February, maybe March, I can post comments begging for the rains to stop. It’s no fun seeing the rooftop of cars on a Main Street or to start having houses sliding down hills. People can be so fickle. :-) But it is not normal anymore is it?
Has any non-Californian noticed that most of the state’s water comes from Northern California with most of the population living in Southern California? The fairly nonchalant, and honestly, corrupt, and suicidally stupid way the state’s political and economic elites have been handling the decades growing water crisis has several causes. First, being short-sighted nincompoops, then the embedded, connected, and wealthy water barons, and finally the majority of the voters live in the south, which means that they don’t listen to the north.
It is true that the crisis has only been forty to sixty years incoming like some Malthusian Doom, which has given people plenty of time to ignore it. Sixty years is an entire adult lifetime after all. It is going to be a long time. Why worry?
Unless you are a lifelong native, who has been seeing this doom oncoming his entire life, I guess. Idiots.
(I am not blaming Joe and Jane Voters, much. Surviving life can be really hard and distracting. Rent, food, children. All those little things. I am blaming the politicians for not doing their jobs.)
I just keep remembering of the arrogance of the developers and the political establishment during the 70s drought for just the reasons I mentioned. It is just that right before the rains that broke the drought, there were serious rumblings that the canals sending water south were going to be broken themselves. Probably by explosives. It is impossible to protect all the canals, dams, and pumps that collect and send the water. It just is.
However, I think it was more about the anger towards the disdain, maybe better say the lack of concern by the water districts, politicians, and agribusiness felt about stealing all the water; we all need water, but deciding to just take because you can, openly being uncaring? If it gets real bad with the corruption and incompetence continuing, I can see even the South having real violence over poor management of water and food.
> It is impossible to protect all the canals, dams, and pumps that collect and send the water. It just is
Like power lines and substations….
The interesting part happens when all those legislators have to sit down and work against hard limits which no amount of hand-waving or write-offs will be able to make go away. Either the water is there or it is not. Priorities will have to be set against agriculture, mining and voters, err, people. Who gets the remaining water and how much? What if the amount of water still decreases year by year. Can’t solve this program by sending in troops. Unless of course a water war has broken out between some States. It has happened before.
> Either the water is there or it is not
See the epigraph.
Also shows another reason why Palmer’s supply and demand analogy is wildly off-base (or, more charitably, that he’s a child of his time). More demand more water will re-allocate water; it will not cause more water to be produced (and even “solutions” like desalination, even granted they scale to the size of a watershed, just postpone the day of reckoning).
Palmer probably never even heard of demand curves. He was writing from the perspective of collectors and users of traditional economic or vital statistics – production, current grain stocks, oil inventories, population levels not of economics in the sense you are thinking.
Current inventories = previous inventories + production + imports – consumption – waste
Stocks and flows.
It has been fascinating being in the very belly of the beast for the past decade of drought, to watch the slow motion die-off of those living things not watered by the hand of man, while every last one of the 666 million nut & fruit trees down below on the fruited plain all look fit as a fiddle.
Moisture of the soil is the boogieman you can’t really discern-although thanks to NASA monitoring it seems to be the culprit in forest health going south, as we’ve never lost so much moisture in the soil as has happened in the past decade.
p.s.
Notice the giraffe shaped part of the drought in Cali, Nv & Ore on the Drought Monitor map?
Lambert, I’m about to publish a book on this very topic. May I send you information on it?