Yves here. Despite some technically-accurate effort to depict the rounding-error-level decline in CPI to 6.4% in January from 6.5% in December as easing (for instance, the Wall Street Journal’s U.S. Inflation Eases, but Pace of Moderation Slows), other venues were in the Wolf Richter camp of not buying it. From Bloomberg:
Fed Officials Float Even Higher Rates After Brisk Inflation Data
The Inflation Boogeyman Now Hides in Services
By Wolf Richter, editor of Wolf Street. Originally published at Wolf Street
The Consumer Price Index (CPI-U) for all items jumped by 0.5% for the month, the biggest month-to-month increase since June, pushed up by relentless inflation in services, according to the CPI data released today by the Bureau of Labor Statistics.
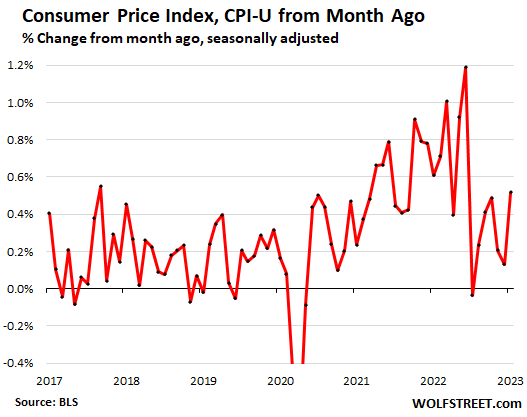
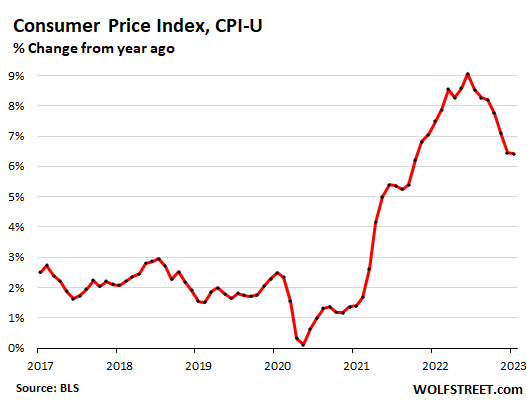
Year-over-year, the Consumer Price Index jumped by 6.4%, driven by a four-decade high in the services CPI. In December, the CPI had jumped by 6.5%. But the difference was mostly in rounding. Unrounded: January CPI = 6.410%, December CPI = 6.454%. Unrounded, the differences are too small to be meaningful:
Major categories of the CPI, month-over-month and year-over-year:
- Services: +0.6%; +7.6%
- Durable goods: -0.1%; -1.3%
- Food at home: +0.4%; +11.3%
- Food away from home: +0.6%; +8.2%
- Energy: +2.0%; +8.7%
- Core CPI (without food and energy): +0.4%; +5.6%
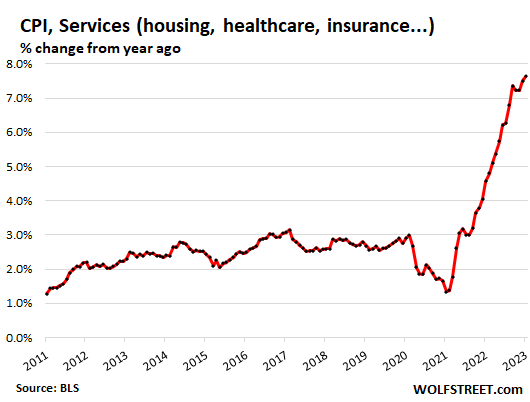
Services Inflation Jumps to New Four-Decade High
The Fed’s eyes are on services. Powell has been talking about it for months. I have been screaming about inflation moving into services since at least the February 2022 CPI, before the Fed even started hiking rates. Nearly two-thirds of consumer spending goes into services: Rent, other housing factors, insurance of all kinds, healthcare, education, repairs, travel and hotel bookings, subscriptions, streaming, telecommunication services, haircuts, pet services, etc. In services is where inflation gets sticky.
The CPI for services inflation rose by 0.6% in January from December – on top of the upwardly revised December jump. It has been over 0.6% in seven of the past 10 months, which shows just how sticky services inflation is, once it breaks loose.
On an annual basis, services inflation jumped by 7.6%, the worst year-over-year increase since 1982 and the fifth month in a row above 7%. In services is where inflation is now raging, where it is entrenched.
Services by Category
The health insurance downward adjustment. The BLS undertakes annual adjustments in how it estimates the costs of health insurance and then spreads those adjustments over the following 12 months. The first mega-adjustment hit in October. January was the fourth month of 12 (more details here). Without that adjustment, services CPI would have been even worse for the past four months.
Due to this downward adjustment, the CPI for health insurance plunged by 3.6% in January from December. These four months of mega-adjustments reduced the year-over-year rate of the CPI for health insurance from the pre-adjustment +28% in September to +1.2% in January.
But the Fed’s favorite inflation measure, the PCE price index, tracks health insurance inflation differently, and there is no such adjustments.
Here are the month-to-month changes of the health insurance CPI after the adjustments:
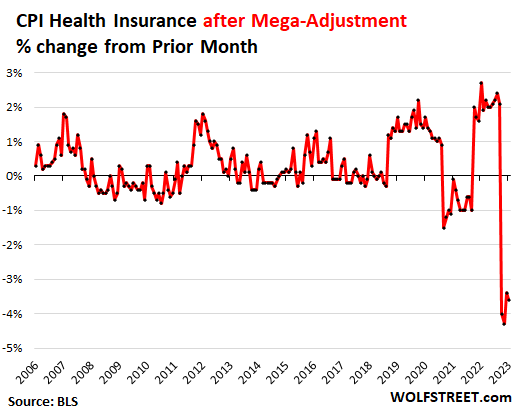
Health insurance is part of medical care services, and so that adjustment knocked down the CPI for medical care services to -0.7% month-to-month. Both are included in the table.
| Services | MoM | YoY |
| Overall services | 0.6% | 7.6% |
| Car and truck rental | 3.0% | 1.8% |
| Postage & delivery services | 1.5% | 6.8% |
| Hotels, motels, etc. | 1.5% | 8.5% |
| Motor vehicle insurance | 1.4% | 14.7% |
| Motor vehicle maintenance & repair | 1.3% | 14.2% |
| Pet services, including veterinary | 1.0% | 9.4% |
| Water, sewer, trash collection services | 0.9% | 5.0% |
| Rent of primary residence | 0.7% | 8.6% |
| Owner’s equivalent of rent | 0.7% | 7.8% |
| Video and audio services, cable | 0.6% | 3.9% |
| Other personal services (dry-cleaning, haircuts, legal services…) | 0.5% | 5.3% |
| Recreation services, admission to movies, concerts, sports events | 0.3% | 5.7% |
| Telephone services | 0.2% | 2.0% |
| Tenants’ & Household insurance | 0.1% | 0.9% |
| Medical care services | -0.7% | 3.0% |
| Airline fares | -2.1% | 25.6% |
| Includes: Health insurance | -3.6% | 1.2% |
The CPI for Housing as a Service
The CPI for “rent of shelter,” which in January accounted for 34.4% of total CPI, tracks housing costs as a service, not as an investment, and is based on rent factors, primarily:
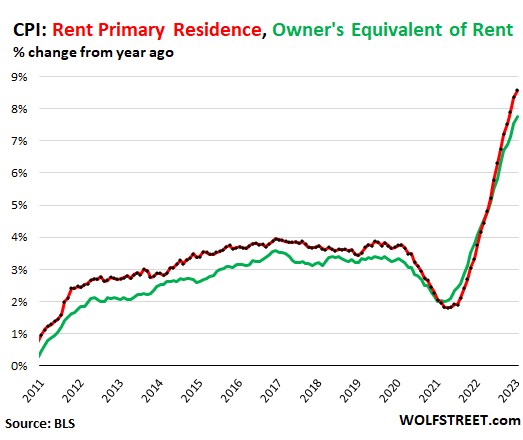
“Rent of primary residence” (accounted for 7.5% of total CPI) spiked by 0.7% for the month and by 8.6% year-over-year, the highest since 1982. It tracks how actual rents paid by tenants changed at a large group of rental houses and apartments, including in rent-controlled units (red in the chart below).
This contrasts with other rent indices that track “asking rents,” the advertised rents of still vacant units on the rental market. When asking rents are too high to fill the units, landlords may lower the asking rent. There was a boom in asking rents during the pandemic. But rentals don’t turn over that much, and proportionately not many people actually ended up paying those asking rents.
“Owner’s equivalent rent of residences” (accounted for 25.4% of total CPI) jumped by 0.7% for the month and by 7.8% year-over-year, the worst in the data. It tracks the costs of homeownership as a service, based on what a large panel of homeowners report their home would rent for (green line).
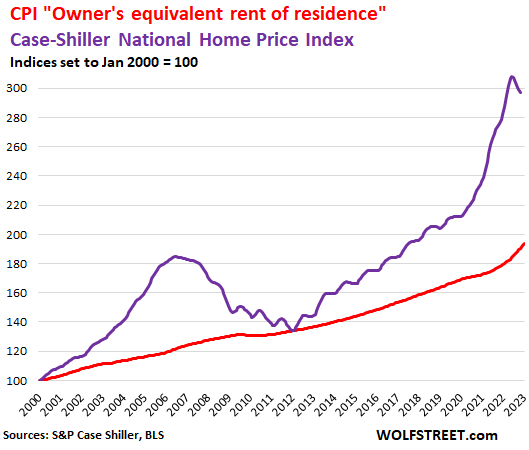
Home prices, based on the Case-Shiller Home Price Index, peaked with the “June” report and then started to decline [I track this by city in The Most Splendid Housing Bubbles in America]. The most recent data point is the three-month moving average of September, October, and November (purple line in the chart below).
The red line represents “owner’s equivalent rent of residence.” Both lines are index values, not percent-changes of index values:
Food Inflation
The CPI for “Food away from home”– restaurants, vending machines, cafeterias, sandwich shops, etc. – jumped by 0.6% for the month and by 8.2% year-over-year, the sixth month in a row of 8.0% or more.
The CPI for “food at home” – food bought at stores and markets – re-accelerated to an increase of 0.4% in January from December. On an annual basis, the CPI for food at home rose by 11.3%, the 11th month in a row with double-digit year-over-year increases.
As some prices started to retreat, other prices rose. The CPI for eggs spiked due to issues triggered by the avian flu:
| Food at home by category | MoM | YoY |
| Overall Food at home | 0.4% | 11.3% |
| Cereals and cereal products | 1.3% | 15.9% |
| Beef and veal | 1.1% | -1.2% |
| Pork | 0.0% | 1.5% |
| Poultry | -0.1% | 11.2% |
| Fish and seafood | -0.1% | 4.0% |
| Eggs | 8.5% | 70.1% |
| Dairy and related products | 0.0% | 14.0% |
| Fresh fruits | 0.8% | 3.0% |
| Fresh vegetables | -2.3% | 7.4% |
| Juices and nonalcoholic drinks | -0.1% | 13.3% |
| Coffee | 0.9% | 12.8% |
| Fats and oils | 0.0% | 20.9% |
| Baby food & formula | -0.5% | 10.0% |
| Alcoholic beverages at home | 0.4% | 5.3% |
Energy Prices
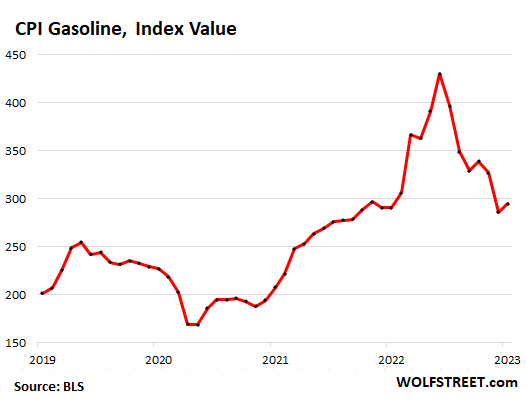
Gasoline prices rose by 2.4% in January from, December, after having plunged since June 2022. The explosion, so to speak, of gasoline prices in the first half of 2022 has now been unwound.
Year-over-year the CPI for gasoline is up by 1.5%. It’s possible that the CPI for gasoline may have bottomed out in December. This chart shows the CPI for gasoline of all types:
And note the surge in natural gas piped to the home. Electricity continues to rise sharply:
| Energy | MoM | YoY |
| Overall Energy CPI | 2.0% | 8.7% |
| Gasoline | 2.4% | 1.5% |
| Utility natural gas to home | 6.7% | 26.7% |
| Electricity service | 0.5% | 11.9% |
| Heating oil, propane, kerosene, firewood | -3.9% | 18.0% |
Durable Goods Prices: Drop Appears to Stall
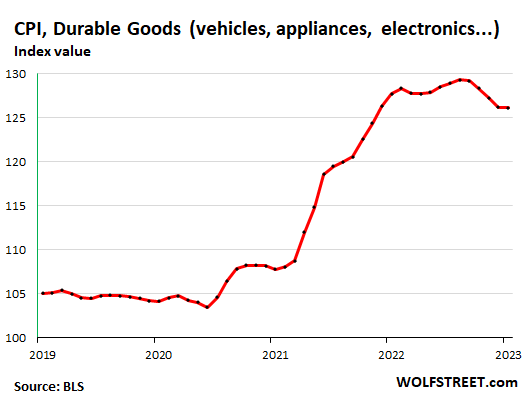
The CPI for durable goods fell for the fifth month in a row, by 0.1% from December, a much slower decline than in the prior months, slowing the process of working off the ridiculous spike that started in late 2020.
On an annual basis, the durable goods CPI fell by 1.3%.
Here is the CPI for durable goods, expressed as index value, not as percent-change of the index value. It shows the ridiculous spike starting in late 2020 through mid-2022, and the price drops since then.
The long-term trend of the durable goods CPI since the mid-1990s, when “hedonic quality adjustments” were incorporated, was downward – meaning deflationary. And this is how it should be naturally because manufacturing and transportation efficiencies, driven by competition, should cause prices of the same product to come down.
However, those are not the same products. For example, even the basic model of the Ford F-150 pickup now has a 10-speed automatic transmission, up from a four-speed automatic in the mid-1990s. Motor vehicles have gotten a lot better over the years and aren’t the same products anymore. The cellphones of the mid-1990s have turned into smartphones. They’re not the same products anymore. And so the cost of those improvements are removed from the index via “hedonic quality adjustments.” The spike in prices that started in 2020 outran by a wide margin the hedonic quality adjustments.
| Durable goods by category | MoM | YoY |
| Durable goods overall | -0.1% | -1.3% |
| Information technology (computers, smartphones, etc.) | 0.0% | -11.7% |
| Used vehicles | -1.9% | -11.6% |
| Sporting goods (bicycles, equipment, etc.) | 0.5% | 1.5% |
| New vehicles | 0.2% | 5.8% |
| Household furnishings (furniture, appliances, floor coverings, tools) | 0.5% | 6.4% |
“Core CPI.”
The core CPI, which excludes the volatile food and energy products, rose 0.4% in January from December, just a hair (unrounded) above the increase in December. This also shows just how sticky inflation has become, despite the drop in durable goods prices:
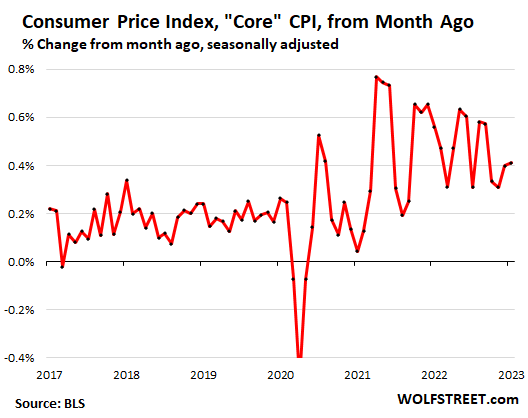
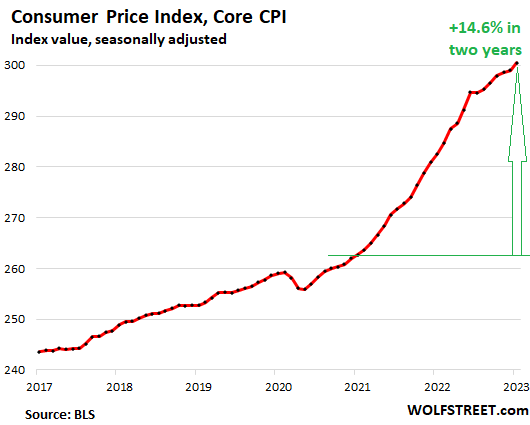
Year-over-year, core CPI jumped 5.6%, compared to 5.7% in December. This chart shows the index of Core CPI, rather than the year-over-year percent change, for a dose of where this is going: Over the past 24 months, the Core CPI has soared by 14.6%:


Didn’t you say the leap in egg prices had nothing to do with the bird flu and was just naked price gouging?
No, it wasn’t naked. It was collusion by algorithm price gouging.
Many of the services mentioned are crapified by Pirate Equity and they are big users of the great algorithmic price gouge. Expect moar of that as “dynamic” pricing and withholding supply come together in the great gouge ahead.
Below is a current graph of egg futures:
https://tradingeconomics.com/commodity/eggs-us
If eggs don’t drop like a rock in the next months, then yes your theory may hold up.
Merely anecdotal to my location in the southeastern US, regional grocery chain the price of their basic brand of eggs hit a ceiling of maybe $3.7 to $4.0 as of middle December 2022 – January 2023. On a more recent purchase last weekend, the price has declined to just under $3.
That said, the refrigerated case was practically 2/3 empty.
I didnt raise rent on tenents through the pandemic. Now im way under market and have pricing power, starting increases now, shelter inflation will run hot hot hot until interest rates are above inflation.
Dont even ask about the treasury bills and bond im selling too. Whos dumb enough to hold usa paper now? No one will want it when we spend like drunken sailers on a useless war.
Where else do you put money to keep the principal safe and still make some return? It’s common for countries to set their interest rates below inflation; China does it too. But it’s still better than nothing.
70 percent is ridiculous. When does it go back to 2 years ago pricing? Never
I guess that this is what neoliberalism looks like.
“Food at home: +0.4%; +11.3%”
An appropriate comment everyone should make loudly at the check-out counter:
“Two hundred dollars?!” (or whatever amount is)
“Glad to do my part. President Biden said we would have to sacrifice for Ukraine for as long as it takes!”
I’ve said things like “Thanks, Biden!” here in oh-so-Blue Tucson. It hasn’t gone over well.
Now I’m thinking of the scene from the quite fictional but still entertaining film, the Patriot. Benjamin Martin (aka Gibson) walks into a distant and decidedly colonial bar and shouts “God Bless King George”….hilarity follows (of a sort with knives and such).
Then again, the Rob Reiner(s) of this world are all “thank goodness” for Joey. Vomit.
For those of us on the consumer side of the economy this is very interesting. No doubt there are websites with similar data. I just don’t know what they are..
Looks like the increases in my car insurance probably track back to higher cost for car parts and therefore nothing personal.
My auto went up inexplicably by over $100 just as this was gaining steam a year ago, so I switched. No surprise increase at the end of the year, we’ll see in 4 more months.
I contacted my State Farm office with that very question in late October 2022. The explanation was increases in replacement value, and no amount of hand wringing was really going to change the reality. Fortunately the semi annual billing is the biggest recurring expense on my paid off vehicle.
From my bill it looks like the biggest increase is in liability and therefore probably about repair costs although SC does have one of the higher accident rates–likely due to lack of traffic enforcement if you ask me. Everybody around here rolls through or even charges through stop signs.
I’m fascinated with the way that inflation is measured. I have access to actual costs in my job and I’m seeing 20-50% inflation on average (in what we charge). These inflation figures that are published reek of BS. Also we need to use 2019 (pre-covid) as a baseline.
And measure unemployment the same way it was until Bill Clinton changed it.
In 1994, under the Clinton Administration, the Bureau Of Labor Statistics (BLS) changed the methods in which it calculated the levels
of unemployment in the U.S., dropping almost 600,000 people off the unemployment roster by not counting those that are considered to be ‘Not In Labor Force,’ or NILFs.
Prior to 1994, persons were not asked whether they had searched for work recently. If they gave one of the five “discouraged worker” reasons for not looking for work in the past 4 weeks, they were assumed to have “given up” the search for work, although they weren’t asked when they had last looked. As a result of the greater specificity introduced in 1994, the number of discouraged workers was cut approximately in half from about 1.1 million in 1993 to 500,000 in 1994.
Whoa! How well concealed are St. William’s crimes against the average working bloke. Thank you for the post, Bettty.
https://www.yahoo.com/finance/news/food-prices-are-high-and-going-higher-strategist-says-214241618.html
“Part of the problem beyond the cost of raw materials is the packaging materials; 80% is made in mainland China, ” Strategic Resource Group Managing Director Burt Flickinger said in a recent Yahoo Finance Live segment. “And that applies to salt and snacks, cookies and crackers, all the way to sports beverages. So prices [are] high and going higher.”
After the hedonic quality adjustments and stripping out food and other incidentals like gasoline, it makes sense that my SSDI increases are always lower than the actual increases in my expenses.
But I guess that is the point. Austerity by the back door. Yes?
I feel crazy figuring out that to afford a one bedroom apartment in California and pay for all my necessary expenses like food, utilities, and gas, plus maybe some luxuries like a pair of cats or books requires $60,000 gross per year, or ~18.00 per hour while the effective minimum wage is ~$18.00. Maybe, I could get a room and reduce expenses to only needing $50,000 gross. Maybe.
Since the official statistics are suspect, how can we know what is actually happening in the economy or how the government’s measures actually affect it aside from the broadest view. I mean the unemployment numbers are not quite a joke and yet the arguments about what to do use the official numbers. I feel like we on the good ship America, leaning to the side, with the crew telling the passengers not to worry as there is no water in the cabins, and the lights are on, meaning that the engine room can’t be completely flooded.