Yves here. We wrote regularly around the time of Obama Grand Bargain attempt at how the CBO played the role of unrepentant neoliberal enforcer. We were not alone in disapproving of the dubious budgetary methods the CBO and its outsized role in setting policy.
The post below from Angry Bear describes, contrary to CBO and CMS forecasts, healthcare costs in aggregate (as in as a percent of GDP) are not rising. This is contrary to earlier, insistent predictions that health care costs would continue to rise and will continue to increase in GDP terms.
Not that the current 17.8% of GDP is a good number, mind you. The fact that that figure is so out of line with that of other advanced economies illustrates how much price gouging and other patient abuses are going on (don’t get me started on overtesting…..)
Bill Haskell cites an article that expresses mystification as to why the CBO and CMS forecasts continue to insist on significant aggregage health care cost increases. The CBO had been using a bogus methodology to estimate health care cost increases, one that violated its own stipulated methodologies. High projected health care cost increases would serve to justify more beating of the poors and middle class, via Medicare and Medicaid cuts.
Immediately below we quote from a 2012 post. Perhaps readers on this beat can point us to more recent CBO analyses so we can ascertain where and how the CBO is playing medical cost forecast games now. Bill Haskell at Angry Bear points to a CBO letter: any help in finding other key documents would be very much appreciated.
From Fed Budgetary Experts Demolish CBO Health Cost Model, the Linchpin of Budget Hysteria:
A remarkably important and persuasive paper that calls into question the need for “reforming” Medicare has not gotten the attention it warrants. “An Examination of Health-Spending Growth In The United States: Past Trends And Future Prospects” (hat tip nathan) by Glenn Follette and Louise Sheiner looks at the model used by the Congressional Budgetary Office to estimate long term health care cost increases. Bear in mind that this model is THE driver of virtually all forecasts of future budget deficits.
This paper, although written in typically anodyne economese, is devastating in the range and nature of its criticisms. And the reason this assessment should be taken seriously, independent of the importance of the issues it raises, is that the authors are uniquely qualified to make this critique. Follette is chief of the Fed’s fiscal analysis section. Sheiner, a fellow member of that group, has worked for both the Treasury and the Council of Economic Advisers previously. In other words, the sort of analysis they have made here is the core of what they do on a daily basis.
The argument made by the opponents of the plans to cut Social Security and Medicare generally take this form: concerns about Social Security are greatly exaggerated. They are based on long-term forecasts, which are notoriously inaccurate in outlying years. The most commonly cited, by the Trustees of the Social Security system, projects the exahustion of the famous trust fund in 2033. As several analysts have observed, if Social Security really has a problem, we’ll know it in plenty of time; there’s no need to do anything immediately.
By contrast, conventional wisdom is that Medicare does have a long term cost predicament, but the problem is not demographic, but that of the steep rise of health care costs in general.
The fundamental beef of Follette and Sheiner with the CBO model is that it naively assumes past growth in health care spending as the basis for its long-term projections. The result is that it shows that trees will grow to the sky. One of the things anyone who has built forecasting models will tell you is you come up with assumptions that look reasonable and then sanity check the output (for instance, does your model say in year 10 that your revenues will be 3x what you can produce given your forecast level in plant and investment? If so, you need to make some revisions). The Fed economists point out numerous ways that the model output flies in the face of what amounts to common sense in the world of long term budget forecasting. From the opening of the paper (emphasis ours):
Long-run projections of the U.S. federal budget have played a prominent role in discussions about fiscal policy and the design of major transfer programs for several decades. The projections typically show large fiscal imbalances owing to ramping up of retirement and health care costs relative to GDP. Health care costs are the key factor in these projections for two reasons. First, in current projections they are the prime source of growth of spending as a share of GDP. Second, they are the most uncertain part of the forecast. For example, the Congressional Budget Office’s most recent long run outlook shows spending on Medicare and Medicaid, the governments health programs for the old and poor, respectively, rising from 4.1 per cent of GDP in 2007 to 19.1 per cent of GDP in 2082.1 By contrast, Social Security benefits (the government’s main old-age pension program) increase only 2 percentage points, from 4.3 per cent of GDP in 2007 to 6.4 per cent in 2082. Another analysis by CBO suggests that an 80 per cent confidence band around the Social Security projection would be from 51⁄2 to 91⁄2 per cent of GDP.2 CBO did not present similar calculations for health spending; instead, they projected health spending under three different assumptions about the rate of growth of age-adjusted health care spending in excess of per capita income. Their projections show health spending ranging from 7 to nearly 40 per cent of GDP by 2082.
By comparison, defense spending as a percent of GDP peaked at 42% of GDP in World War II. A model that presents as a possible outcome that the US will devote nearly 40% of GDP to health care spending a long-term, sustained outcome, is ludicrous on its face.
There are even more forecasting crimes in that model, including violating the CBO’s own methodologies, but the extract above gives a drift of the gist.
The fact that individual readers may be experiencing painful healthcare costs is sadly an existing condition, and our fragmented insurance and delivery system means too many people are exposed to random or unfair bad outcomes. Misrepresenting overall costs to squeeze patients further is just another rentier enrichment scheme.
Now in fairness, as many readers know, we have the probable coming burden of higher health care costs in the form of Covid-related morbidities, as in more people getting sicker at younger ages than the prototypical increase as one gets to be in their 60s. But this may not play out as in a simple manner. For instance, Covid seems to be harming fertility. So an expected outcome there is fewer pregnancies and births versus more spending on fertility treatments. How will those two forces net out spending-wise? So even though the overall Covid impact is pretty sure to be negative, it’s a complicated picture…and of course, given our dreadful public health establishment, we lack good data. And that will allow the CBO to again exaggerate the trajectory to support deeper-than-warranted cuts.
By Bill Haskell. Originally published at Angry Bear
I am attempting to present a simple way to portray the costs of healthcare in the US. Using pie charts, a bar chart, and a graph gets the measures of cost across and at the same time presents different discussion points. Merrill Goozner presents the same data as did Peterson and draws a different conclusion. Healthcare costs do not appear to be outstripping economic growth. The issue still remains that we can manage our healthcare costs in a more efficient way. The other issue presented here? CMS and CBO reporting has to be accurate as it drives what the government does.
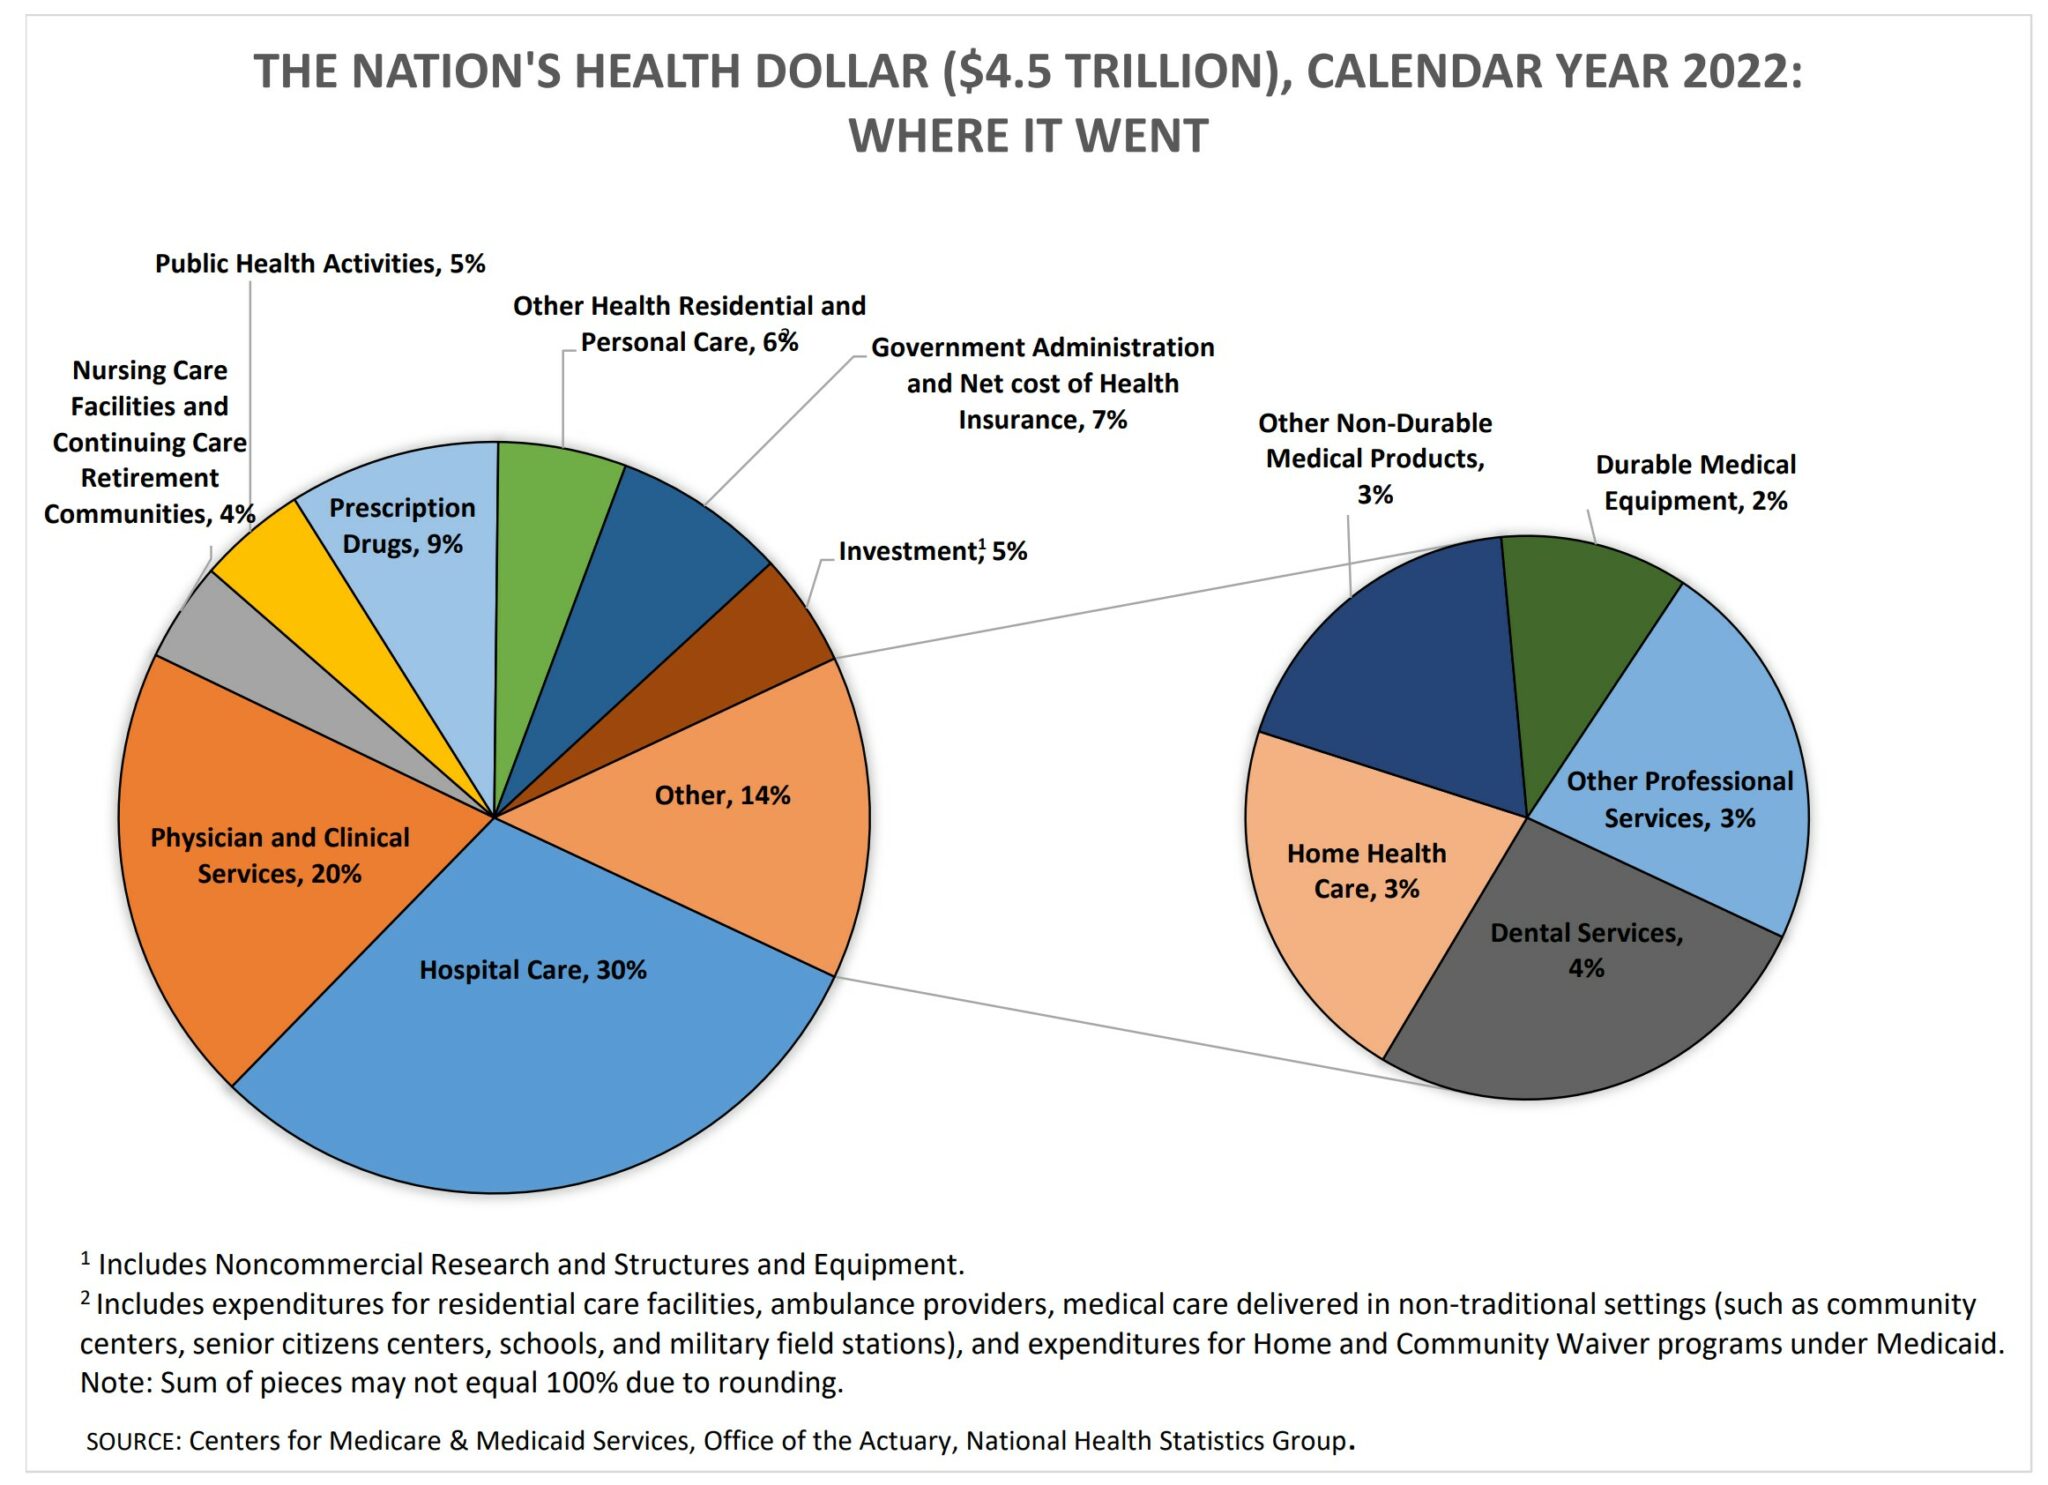
The Nation’s Health Dollar ($4.3 Trillion), Calendar Year 2022: Where It Came from and Where it Went, (cms.gov)
Where Did We Spend the Money for Healthcare?
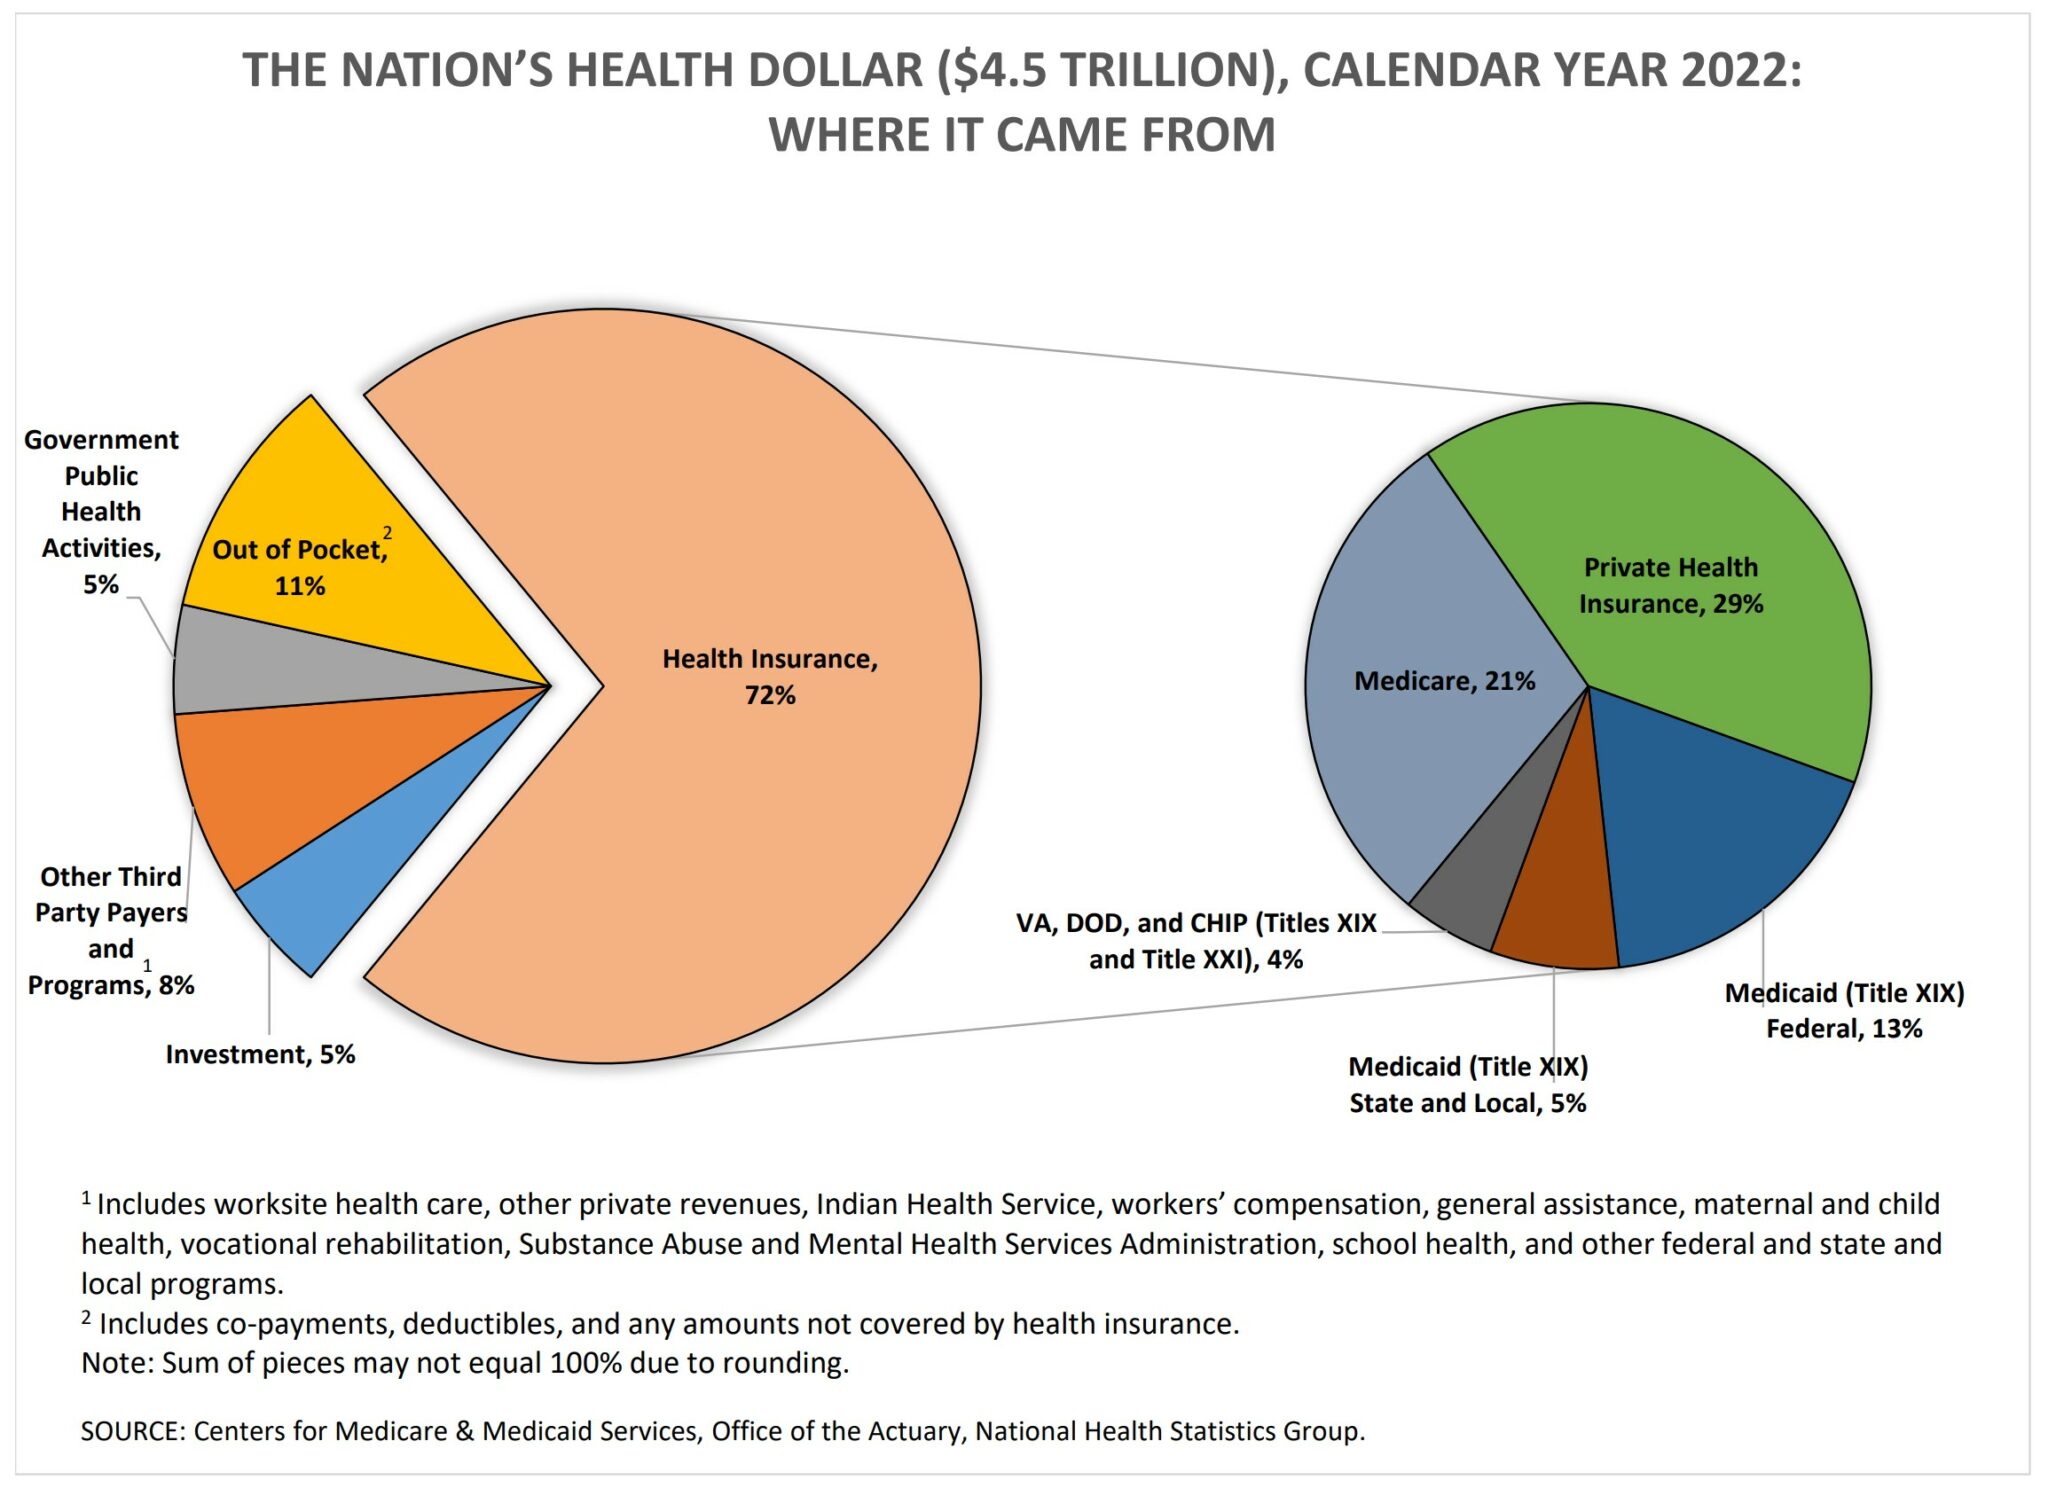
From Where Did the Funding for Healthcare Come?
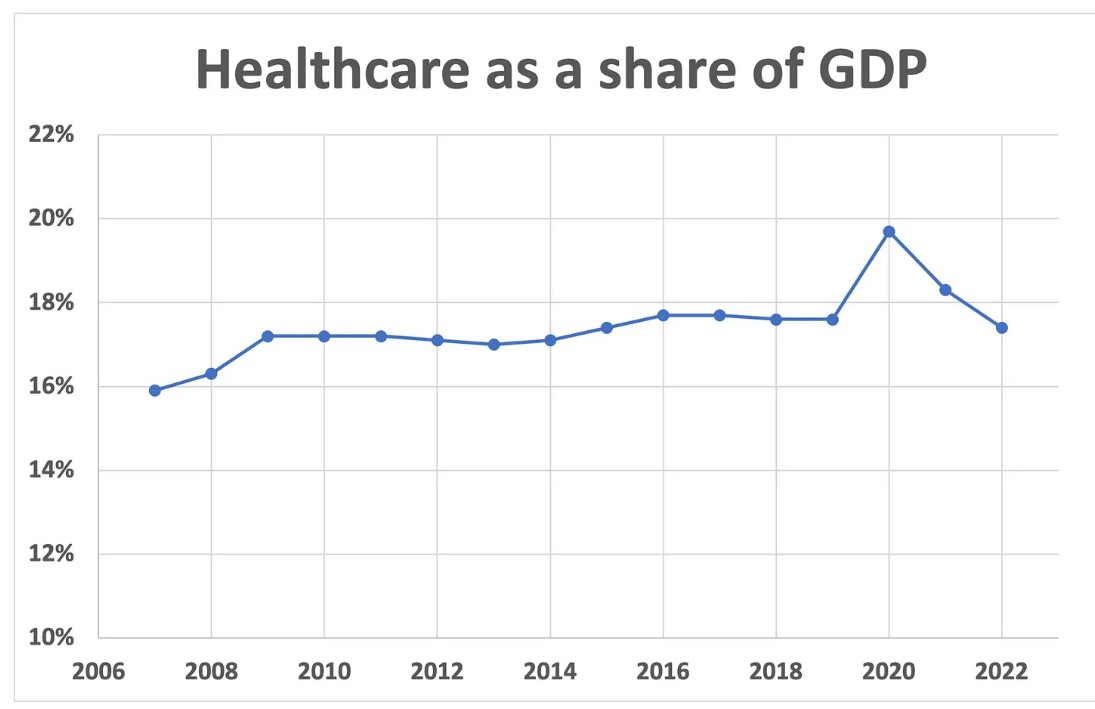
A Tale of Two Healthcare Spending Charts and Why
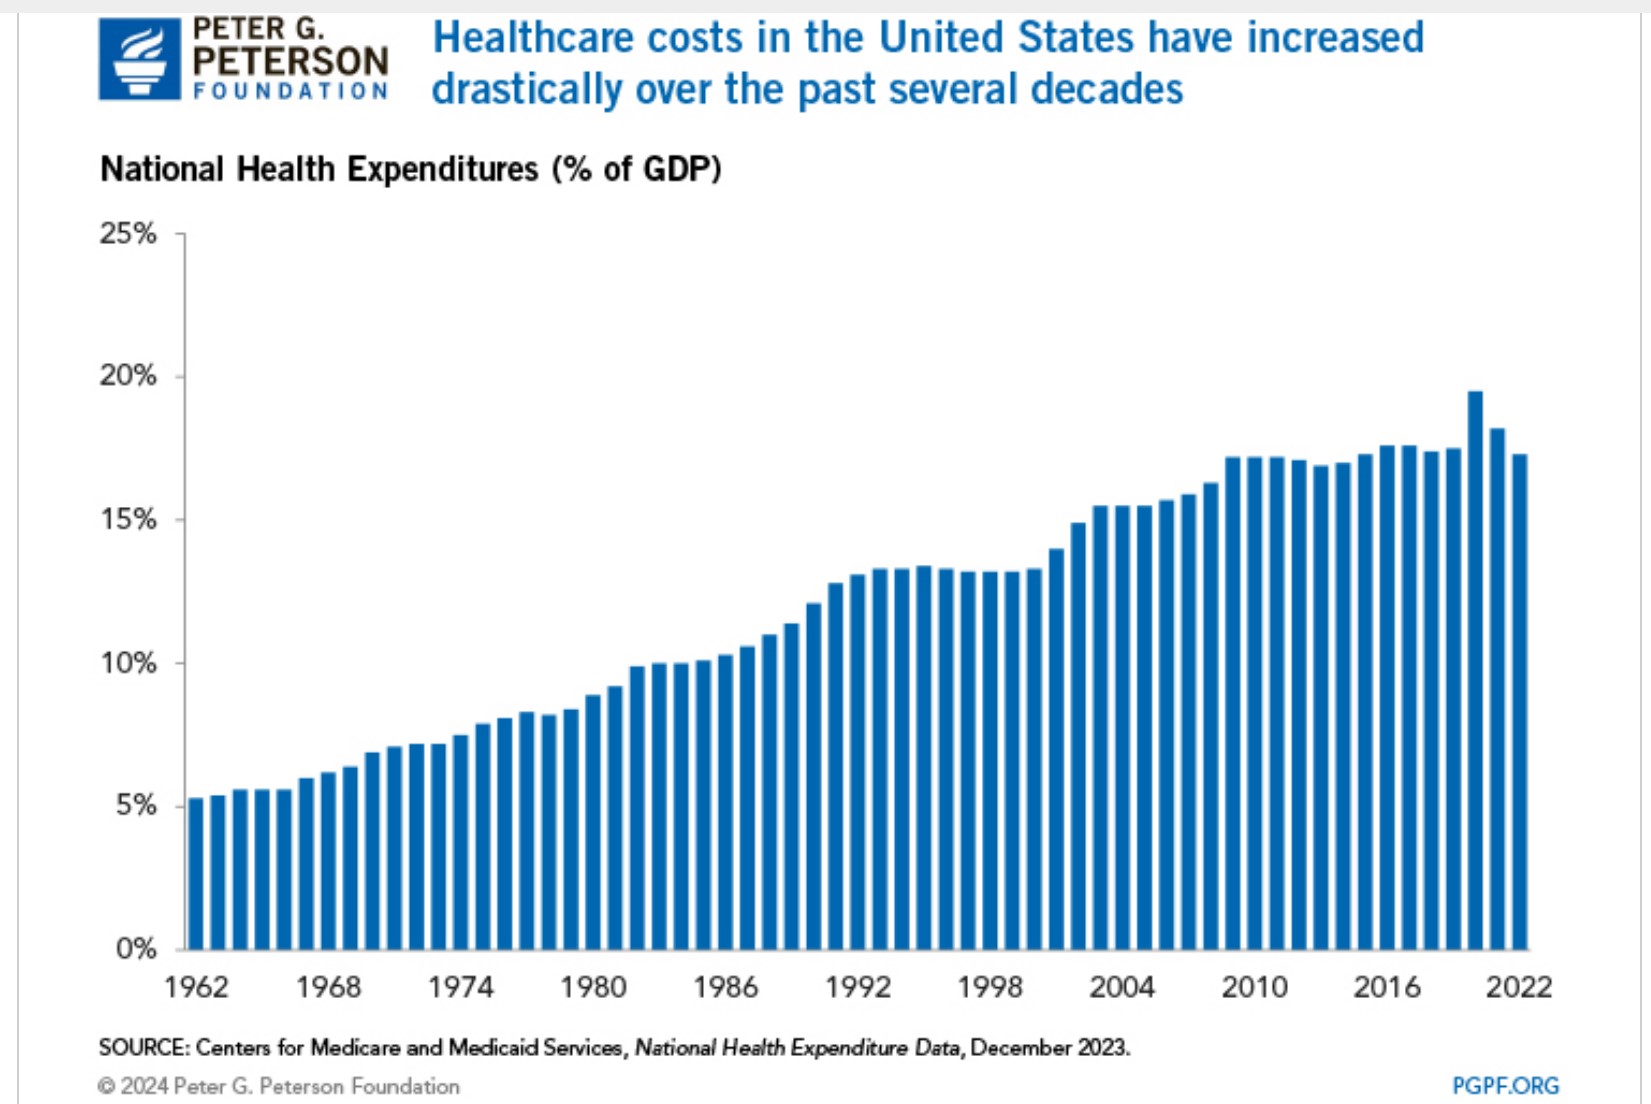
Why Are Americans Paying More for Healthcare? pgpf.org.
Generally, healthcare spending can be thought of as a function of price (dollars charged for healthcare services) and utilization (the amount of services used). There are several underlying factors that can increase price and utilization, thereby boosting spending on healthcare. The most notable of those factors are an aging population and healthcare prices.
An Aging Population
The share of the U.S. population age 65 and over has increased over the past several years, rising from 14 percent in 2012 to 17 percent in 2022. Furthermore, that number is projected to continue climbing – reaching 21 percent by 2032. Since people age 65 and over, on average, spend more on healthcare than any other age group, growth in the number of older Americans is expected to increase total healthcare costs over time.
Why do the health economists keep getting it wrong? GoozNews, Merrill Goozner. June 2023
Merrill: For more than a decade, CMS and CBO consistently overestimated the growth in health care spending, which undermines efforts to spend more on health-related social needs.
Earlier today, economists at the Centers for Medicare and Medicaid Services released their annual projection for health care spending over the next decade. After noting that spending fell to 17.4% of gross domestic product in 2022, which is about where it’s been for most of the past decade except during the Covid years, they predicted spending by Medicare, Medicaid, private insurance and other public and private entities would once again resume its upward trajectory this year and reach nearly 20% of GDP by 2031.
Hmmm. Where have I heard that before? I keep a file containing past CMS projections so it was fairly easy for me to check. The earliest article in my file dates from February 2008, when health care made up 16% of the overall economy. That year, CMS predicted spending would reach 20% of GDP by 2017.
Let’s go to the videotape. Seven years after President Obama and the Democratic Congress passed the the 2010 Affordable Care Act, which included numerous provisions aimed at reining in health care spending, it had only reached 17.7% of GDP.
The CMS prognosticators during the first year of the Trump administration didn’t do much better. In 2017, they predicted healthcare would reach nearly 20% of the economy by 2025. Now they’re saying it won’t reach that level until 2031.
To be fair, healthcare spending did spike to nearly 20% of GDP in 2020. But that was only because the pandemic dramatically slowed overall economic activity while the government poured cash into hospitals and physician offices to keep them running. It took only two years for it to fall back into the 17-18% of GDP range as the economy recovered and the stimulus was withdrawn.
One could conduct a similar exercise with healthcare spending projections from the Congressional Budget Office. Fortunately, I don’t have to do the calculations because Sen. Sheldon Whitehouse (D-RI), chairman of the Senate Budget Committee, asked CBO director Phillip Swagel that very question.
Swagel replied in a letter earlier this year that CBO overestimated mandatory spending for health care in the 2010–2020 period by 9%. He wrote: “Most of the overestimate for the Medicaid and Medicaid programs stemmed from an overestimate of spending per beneficiary, not an overestimate of the number of beneficiaries.”
AB: There are repercussions for overestimating spending for health care.
This systematic overestimation of future health care costs by government economists has far-reaching consequences. When CMS gets it wrong, organizational planners around the country are given a faulty notion of how much money will be flowing through the system, which could lead to a misallocation of resources.
When CBO gets it wrong, Congresspersons get a faulty notion of what resources are available to spend on other programs. It also feeds the GOP’s hysteria around balancing the budget, which undermines political support for other social programs, including those that would actually improve the health of the nation.
AB: If you get a chance, read the CBO letter which gives a good review of healthcare spending and their miscalculations.


Re health economists keep getting it wrong. Correct but the reasons given have NOTHING to do with the actual awful stuff those health economists have got govts to do. 1998-2009 was a fun time for me as a junior health economist in academia. I knew enough to “keep your mouth shut and your ears open”.
Alan Williams – look him up in the BMJ & other big articles detailing the development of the Quality-Adjusted-Life-Year (QALY) routinely boasted that he had terminal conditions that would give him his “three score years and ten” and likely no more so we should STFU about expanding life expectancy. He got to 77.
Certain very vocal members of the “Manchester school” had memorable stand up rows with him at the 6 monthly UK (and in that time “euro centric”) conferences. The Mancs people argued that whilst we may be OK to justify “only funding new treatments that cost less than GBP30,000 per QALY gained, basic economics dictated that we should evaluate and DEFUND anything that didn’t make the cut in the new 21st cebtury. Williams never accepted this. He went on and on about the QALY to his death, never giving an inch of ground. The Mancs bigwigs ultimately got sidelined and barring a few small victories – I think one of the referees of my most cited and influential paper which “made me” was oked by one of them, though I have no concrete evidence – lost the battle.
Ultimately what is so sad is that the field *thought* they were “getting away from valuing life in monetary terms unlike the dreaded cost-benefit-analysis people” but in reality they were still locked in a paradigm that refused to acknowledge tradeoffs, real resources (unlike MMT) but also allowed the field of “trash medicine” (stuff that should have been evaluated and stricken from practice) to grow.
Is it possible that the healthcare costs indeed still increase faster than the general inflation etc., but the share of GDP contained in those costs is stable because (a) there is some limit how big this share can be (b) Americans get less health care.
The health outcomes are not improving anymore… Life expectation goes down…
In the meantime, Australians are not worse in terms of health and spend about half of GDP share. Which allows them to spend public money for other things, like the submarine program that may gobble 40% of annual GDP, although spread over a decade or two…
BTW, I had three anecdotes about absurd costs of generic medications, and in the last year, two went down while I have no info about the third (epinephrin to protect people at risk from anaphylactic shock).
So we have cases of some absurd prices dropping down to a relatively reasonable level.