Yves here. As far as I can tell, this sort of analysis, on the economic impact of war on its neighbors, is seldom if ever done. Even if the conclusions are not surprising, it’s still useful to see them substantiated.
By Jonathan Federle; André Meier, Economist in the European Department International Monetary Fund; Gernot Müller, Professor of Economics University of Tübingen; Willi Mutschler, Assistant Professor for International Macroeconomics University of Tübingen; and Moritz Schularick, President Kiel Institute For The World Economy; Professor of economics Sciences Po Paris; Director & Professor of Economics University Of Bonn. Originally published at VoxEU
The economic costs of armed conflict – in terms of lost income and reduced physical capital – are borne overwhelmingly by the countries in whose territory the fighting takes place. Yet, wars also impose costs on other countries, particularly those geographically closest to the war site. This column suggests that adverse supply‐side spillovers, a pervasive feature of war, tend to last longer than other supply shocks. In recent years, central banks have responded to these shocks – including the war in Ukraine – by tightening monetary policy, a strategy the authors broadly support.
The global political and economic landscape is undergoing profound changes. Geopolitical tensions are rising and rivalries between nations are breaking into the open (Ayiar et al. 2023). The process is fuelled by a volatile blend of rising nationalism (Colantone and Stanig 2017) and shifts in power dynamics (e.g. Baldwin 2024) — the two most common reasons that nations go to war, as we show in a new comprehensive study of wars and their economic fallout since 1870 (Federle et al. 2024a). 1
Wars cause death and destruction, disrupt trade, and wreak havoc on public finances. For countries that experience war on their own soil, this typically amounts to an outright economic disaster. However, wars and the associated rise in military spending can also have expansionary effects and help pull economies out of depressions. The productive potential of an economy is a powerful factor deciding the outcome of wars. War is therefore important for economics, and better understanding the economics of war is a priority for economists.
To date, there is only limited evidence on the macroeconomic impact of interstate wars and basically none on their macroeconomic international spillovers (for the former, see Chupilkin and Kóczán 2022). Against this background, we estimate the direct economic fallout of wars for large war sites, defined by casualties in excess of 10,000 people on their own soil, as well as the spillover effects for other economies using a new data set that covers all major wars since 1870. We find that the economic toll of war is not confined to war sites or the other direct parties to the war, and we offer a structural interpretation of the evidence through the lens of an international business cycle model.
The Economic Impact on the War Site
Figure 1 shows how real GDP and inflation adjust to the outbreak of war, indicated by year zero on the horizontal axis. The solid purple line shows the estimate for the war site, while the shaded area indicates statistical uncertainty (90% confidence bounds). GDP, shown in the left panel, is reduced on average by more than 30% relative to trend some five years after the war’s start. The right panel shows the response of inflation. The war site experiences a large and persistent increase in inflation. The effect peaks at about 15 percentage points in the first year following the start of the war, but remains high afterwards. In a nutshell, war represents a large and persistent adverse supply shock, with economic activity contracting amid strong inflationary pressure.
Figure 1 The economic repercussions in war sites and other countries
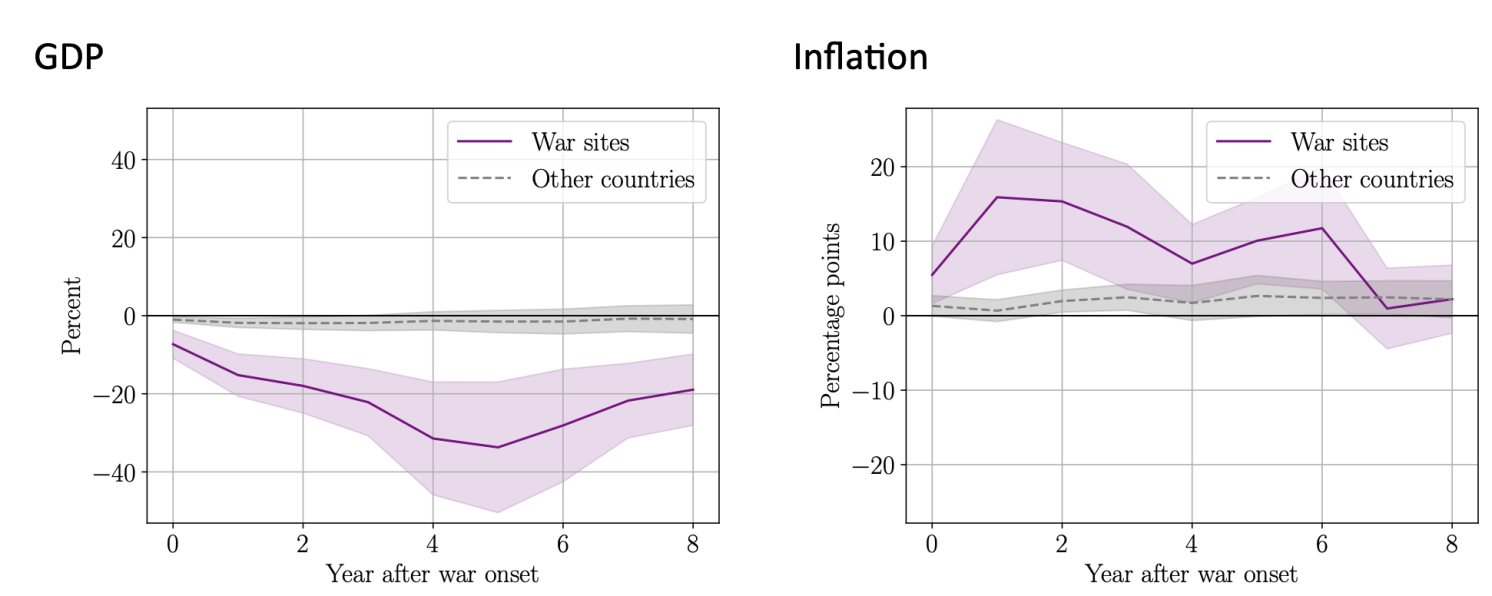
Notes: Figure shows how GDP and Inflation adjust in response to the start of war, in the war site (solid purple line), and in other countries (grey dashed line). Left panel shows percentage deviation of GDP from trend; right panel shows deviation of inflation from pre-war rate in percentage points. Horizontal axis measures time in years since the start of war. Shaded areas denote 90% confidence bounds.
To put these results into perspective, we stress that our estimates reflect the average effect of large wars. In our sample, the average large war site incurs almost 350,000 casualties and experiences hostilities which last for about three and a half years. As such, the average war site – in terms of casualties – is smaller than the current war in Ukraine: estimates from August 2023 already put the number of troop deaths and injuries near 500,000 (Cooper et al. 2023). Since an end to the violence is not yet in sight, we can reasonably expect this number to grow. In total, our sample comprises 38 war sites and 1,798 instances in which a country was potentially exposed to a large war taking place on foreign soil.
Spillovers to Other Countries
Figure 1 also shows the average spillovers in terms of GDP and inflation to other countries, depicted by the grey dashed lines in both panels. These are the countries in our sample that are not war sites, though they may or may not be a party to the war. The average spillovers on other countries are very mild. However, it turns out that these estimates mask considerable heterogeneity across countries. Figure 2 shows the responses for a specification which allows the effects on other countries to differ depending on their geographic distance from the war site. The red solid line represents estimates for a ‘nearby’ country – that is, a direct neighbour to the war site. The blue dashed line represents a country that is ‘distant’ – as far away as possible from the war site.
Figure 2 The economic repercussions in nearby and distant countries
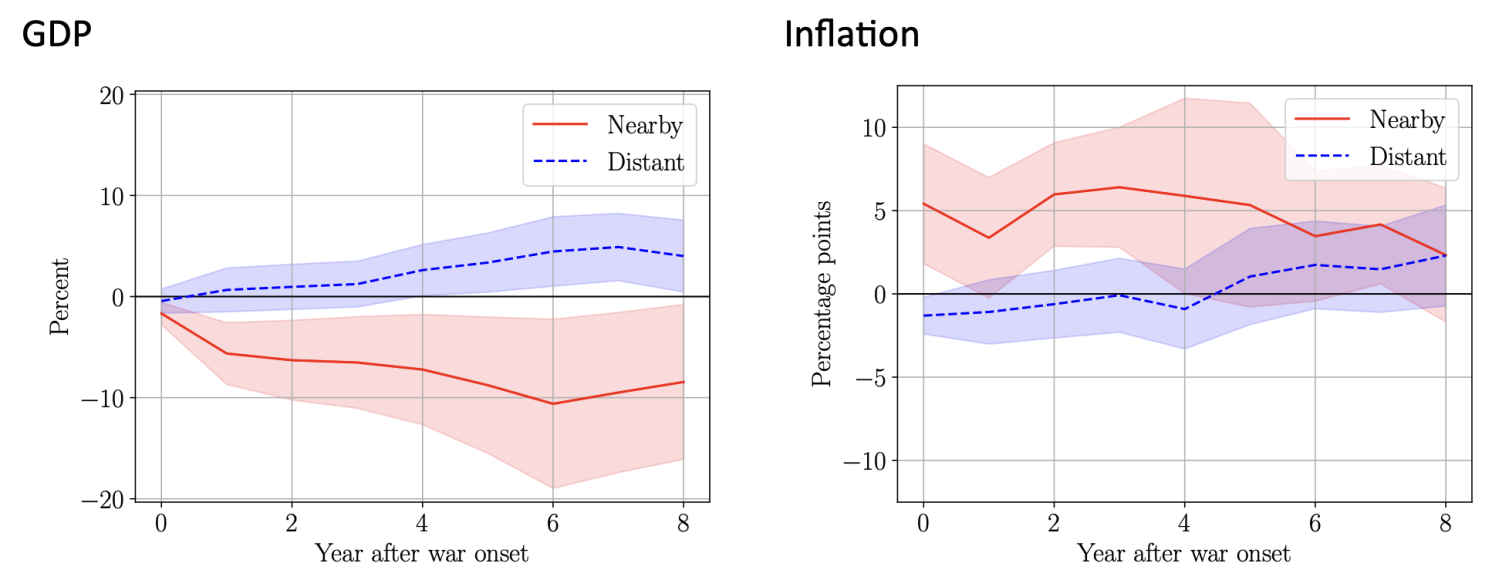
Notes: Figure shows how GDP and Inflation adjust in response to the start of war, in nearby (solid red line) and distant (blue dashed line) countries. Left panel shows percentage deviation of GDP from trend; right panel shows deviation of inflation from pre-war rate in percentage points. Horizontal axis measures time in years since the start of war. Shaded areas denote 90% confidence bounds.
The difference across these groups is stark, and it bears noting that spillovers for actual countries will fall somewhere in the range spanned by these two limiting cases. In the nearby country, real GDP declines on impact and remains persistently weaker. Five years after the start of war, GDP has declined by almost 10% compared to the pre‐war trend. At the same time, inflation rises considerably. This suggests that the supply shock in the war site also generates strong supply‐side spillovers to the neighbouring economy. In contrast, countries located at the other end of the world experience stable inflation and even positive output spillovers.
Importantly, the effects on other countries hold independently of whether a country is a party to the war – spillovers are somewhat stronger for belligerents than for third countries, but the overall pattern is strikingly similar. Accordingly, we can exclude the possibility that the economic fallout of war on other countries is driven by actual participation in the war.
Spillovers Operate Via Trade Linkages and Military Spending
As we show in our paper, it is possible to explain the macroeconomic impact of war within a state‐of‐ the‐art model of the world economy. For this purpose, we assume that the war affects the war site in two ways, consistent with evidence provided in the paper. First, a sizable fraction of its capital stock is destroyed. Second, productivity declines persistently. The decline in productivity is consistent with the notion that a shift to a war economy entails significant efficiency losses. Both the destruction of the capital stock and the decline in productivity formalise the idea that war, in economic terms, represents an adverse supply shock: economic activity contracts and inflation increases, just as we observe in the data. These effects spill over especially to countries which maintain strong trade linkages with the war‐site economy.
In our model simulations, we also explicitly account for the sizable increase of military expenditures that we document during war times. In the war site, military expenditures increase by up to ten percentage points of GDP during an average war. But there is a significant increase in other countries, too, whether nearby or distant. This partly explains why GDP increases in distant countries in some instances: the boost to economic activity due to higher spending dominates adverse spillovers from the war site, which are weak in distant countries.
Central Banks Cannot ‘Look Through’ a War Shock
Our findings establish adverse supply‐side spillovers as a pervasive feature of wars, and one that tends to last for a more extended period than other supply shocks. Among other things, this also points to the resulting challenge for monetary policymakers. A lasting adverse supply shock may generate an inflationary impact that the central bank cannot simply ‘look through’. Hence, our analysis broadly supports the reaction of central banks in recent years, which have tightened monetary policy in response to a series of adverse supply shocks, including – notably for Europe – the ongoing war in Ukraine.
___________
- This column is partially based on a recent policy brief (Federle et al. 2024b), which provides an extensive summary of the original research paper (Federle et al. 2024a).
See original post for references


This paper explains, in part, why for the US, war is good for business — it’s usually far away.
As for the bit about central banks, meh. Fiscal policy is far and away the more powerful and flexible instrument for dealing with war shocks than monetary policy which is frankly a sideshow by comparison.
I would agree that war is similar to a sugar rush where money gets spent producing material, At the same time, building bombs is not like building factories that lead to greater production in the future. Then there is the debt and interest payments during the post war period.
In particular while USA was a industrial powerhouse domestically, as it didn’t experience supply shocks and could make a mint replacing the supply shortfall of others.
I imagine the authors/researchers would have loved to look at the data associated with sales, income, and budgets of nation/ states and contractors supplying armaments.
If the US is any example, that information is verrry difficult to track along- ask the Pentagon!
Beyond a , “war is BIG business”, the minutae and details are lost.
Those promising and pining for a domestic (un)civil war would, I imagine, be unmoved by this article.
It would have been interesting if they had looked at the economic repercussions to the sides scaled by casualties (and GDP). Russian inflation (6-7%) versus high Ukrainian inflation (12.7%) is consistent with lopsided casualty rates. Of course wrt economic warfare and inflation, it is Russia (and China and the global majority) versus the west, about parity.
“Second, productivity declines persistently. The decline in productivity is consistent with the notion that a shift to a war economy entails significant efficiency losses.”
More like a large portion of the output gets turned into smoke and ash as it encounters the enemy, rather than GDP boosting exchanges.
The irony though is that was is also a heck of a R&D booster, as all kinds of back burner stuff suddenly get blank checks. Radio, flight, antibiotics, all rapidly developed during the two world wars for instance.
“The irony though is that war is also a heck of a R&D booster, as all kinds of back burner stuff suddenly get blank checks. Radio, flight, antibiotics, all rapidly developed during the two world wars for instance.”
Interestingly and importantly, this has been largely incorrect. The fastest decade of US productivity growth in the last century was not the 1940s or 1950s but the 1930s. Productivity growth in the 1930s, provided for the rapid GDP growth of the war years in particular and the 1940s as a whole.
Also, currently the US is experiencing especially slow productivity growth. Manufacturing productivity has actually declined since 2012 or over the last 12 years.
Manufacturing productivity stopped growing in and has declined since 2011:
https://fred.stlouisfed.org/graph/?g=m2mB
January 30, 2018
Manufacturing Productivity, * 1988-2023
* Output per hour of all persons
(Indexed to 1988)
https://fred.stlouisfed.org/graph/?g=OfwK
January 30, 2018
Manufacturing Productivity, * 1992-2023
* Output per hour of all persons
(Indexed to 1992)
https://scholarcommons.scu.edu/cgi/viewcontent.cgi?article=1117&context=econ
November, 2003
The Most Technologically Progressive Decade of the Century
By Alexander J. Field
Abstract
There is now an emerging consensus that over the course of U.S. economic history, multifactor productivity grew fastest over a broad plateau between 1905 and 1966, and within that period, in the two decades following 1929. This paper argues that the bulk of the achieved productivity levels in 1948 had already been attained before full scale war mobilization in 1942. It was not principally the war that laid the foundation for postwar prosperity. It was technological progress across a broad frontier of the American economy during the 1930s.
Introduction
Because of the Depression’s place in both the popular and academic imagination, and the repeated and justifiable emphasis on output that was not produced, income that was not earned, and expenditure that did not take place, it will seem startling to propose the following hypothesis: the years 1929–1941 were, in the aggregate, the most technologically progressive of any comparable period in U.S. economic history. The hypothesis entails two primary claims: that during this period businesses and government contractors implemented or adopted on a more widespread basis a wide range of new technologies and practices, resulting in the highest rate of measured peacetime peak-to-peak multifactor productivity growth in the century, and secondly, that the Depression years produced advances that replenished and expanded the larder of unexploited or only partially exploited techniques, thus providing the basis for much of the labor and multifactor productivity improvement of the 1950’s and 1960’s.
The hypothesis does not imply that all of the effects of the advances registered in the decade were immediately felt in the productivity data, nor, on the other hand, does it dismiss the significance of larder-stocking during the 1920’s and earlier, upon which measured advance built. Rather, it draws our attention to the probability that progress in invention and innovation in the 1930’s was significant, in ways not well appreciated, both in facilitating the remarkable U.S. economic performance before and during World War II, and in establishing foundations for the prosperity of the 1950’s and 1960’s…