Yves here. Inflation continues to be a hot topic, both due to its impact on household and business budgets, but also due to the resulting perception that the officialdom, here the Biden Administration, is doing a poor job of economic stewardship. There is bizarrely little commentary on the fact that the Administration has been running a very stimulative policy, as in large deficits, even as the Fed is trying to apply the choke chain. Not only is the resulting inflation problematic in and of itself, but the peculiar approach has even more marked distributive effects, in terms of who winds up being winners and losers.
By Wolf Richter, editor of Wolf Street. Originally published at Wolf Street
So inflation behaved very badly again in March. January was terrible, but it was kind of written off as maybe one of those January blips. February was bad, and so the January-blip story began to fall apart. And the Consumer Price Index for March, released by the Bureau of Labor Statistics today, was just as bad as in February.
It was driven by ugly inflation in “core services” which dominate consumer spending – even as prices of durable goods continued to decline, and as food prices remained relatively stable at very high levels. That energy prices started rising again, after their vertiginous plunge, didn’t help either.
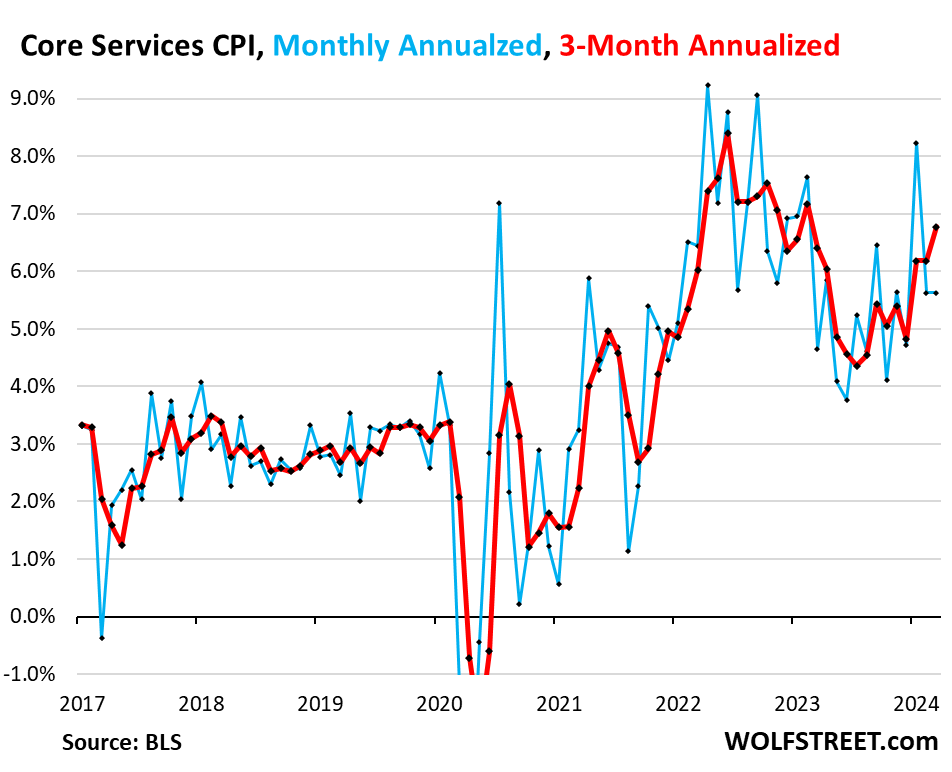
“Core services” CPI jumped by 5.6% annualized in March from February. On a three-month basis, core service CPI jumped by 6.8% annualized, the worst since February 2023. We here have been disconcerted since late last year about inflation in core services. After cooling a lot into mid-2023, it has been reheating. And we started suspecting that the cooling had been one of the head-fakes that inflation is infamous for.
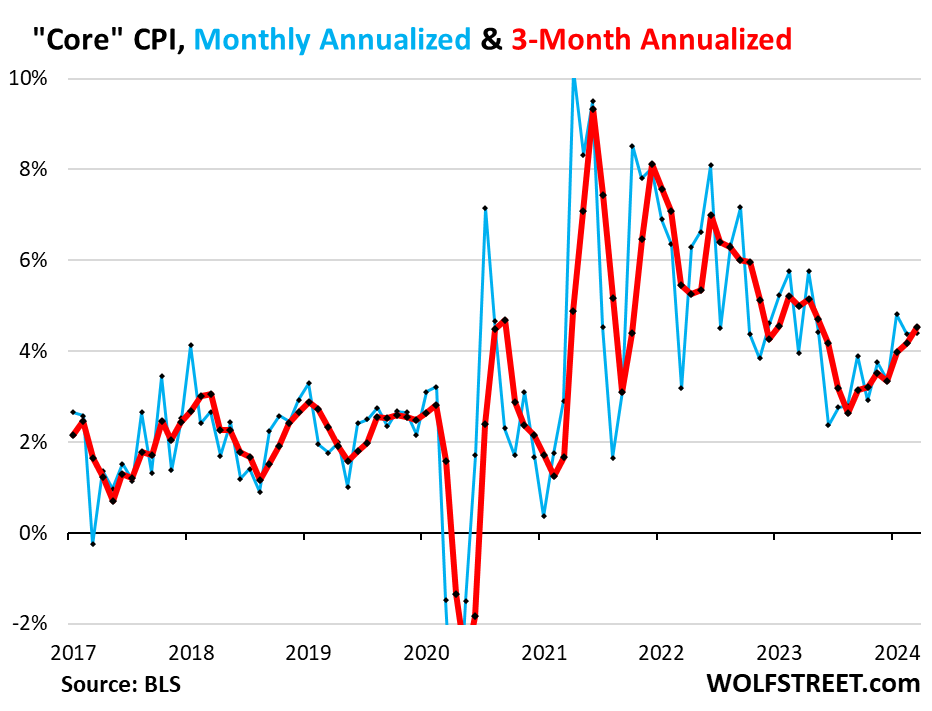
Core CPI, which excludes food and energy, rose by 4.4% annualized in March from February, same increase as in February.
The three-month core CPI rose by 4.5%, the worst increase since May 2023. The drop in prices of durable goods (dominated by motor vehicles) still softened the impact of hot services inflation, but not enough. Inflation in services is just behaving really badly.
The Fed has been in desperate search of “confidence” that inflation would continue to cool after the Amazing Cooling through mid-2023. But that search has gotten tangled up in a nasty turnaround. The cooling process had ended in August. It was hard to see in the fall of 2023. But over the past five months, it has become clear: Inflation, thought to have been vanquished, has raised its ugly head again.
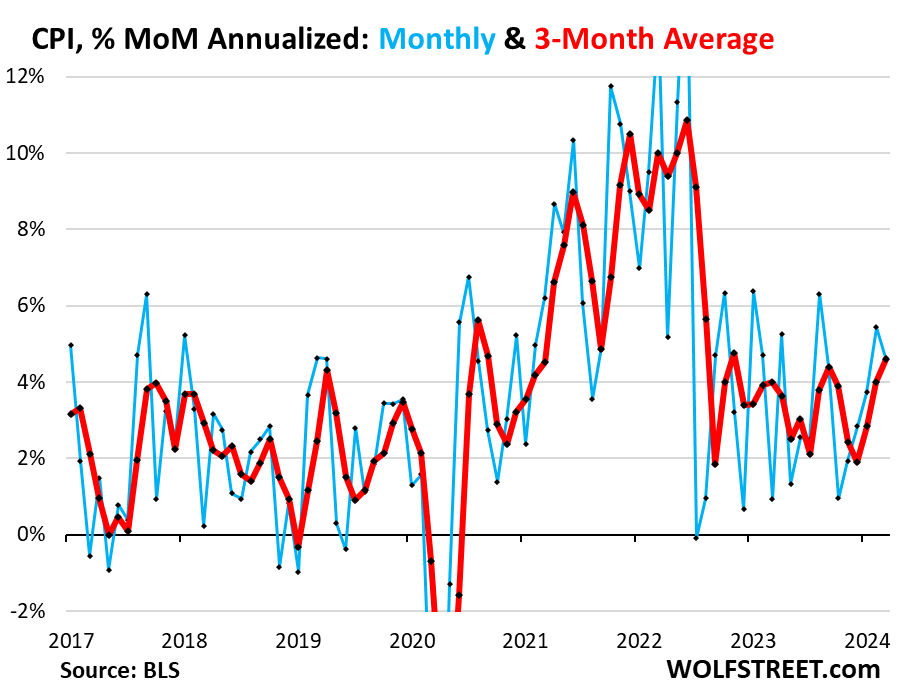
The overall CPI rose by 4.6% annualized in March from February (blue in the chart). The three-month reading, which irons out some of the month-to-month squiggles, also rose by 4.6% annualized, the worst increase since November 2022, and the third month of acceleration in a row (red).
Inflation in Services.
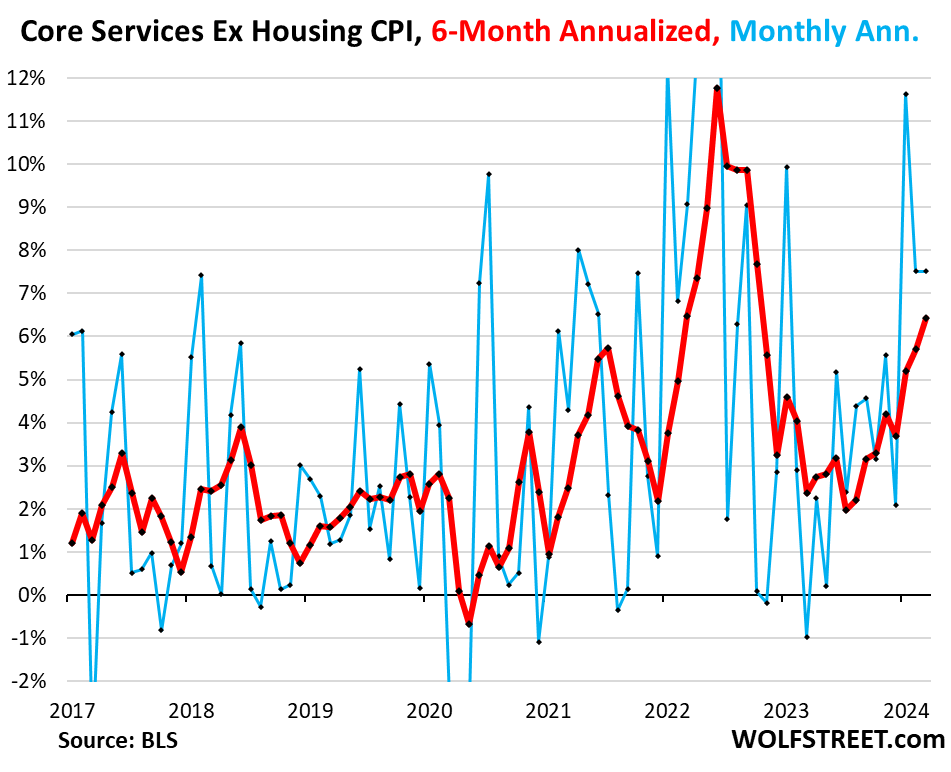
“Supercore CPI” is red hot. The “supercore services CPI — “core services” without housing — jumped by 7.5% annualized in March from February, same red-hot increase as in the prior month, on top of the 11.6% spike in January. So it’s not just housing that drives services inflation.
The six-month reading – six months to iron out the very volatile month-to-month readings – jumped by 6.4%, the highest since October 2022. This is really ugly. And we’ll get to some of the drivers in a moment:
The housing components of services CPI.
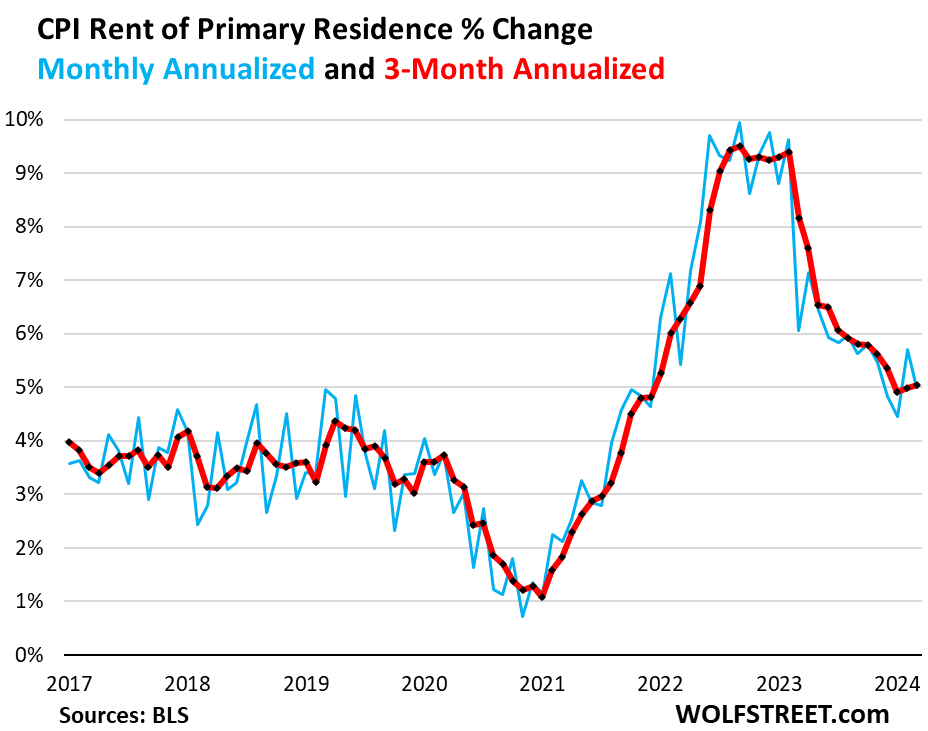
Rent of Primary Residence CPI jumped by 5.0% annualized in March from February after the 5.7% jump in February, and the 4.4% jump in January (blue).
The three-month reading edged up to 5.04%, from 4.99% in the prior month, and from 4.91% in January (red). This was the second month in a row that the three-month reading didn’t drop, something we haven’t seen since peak-rent-inflation in February 2022.
The Rent CPI accounts for 7.6% of overall CPI. It is based on rents that tenants actually paid, not on asking rents of advertised units for rent. The survey follows the same large group of rental houses and apartments over time and tracks the rents that the current tenants actually paid in these units.
The Owners’ Equivalent of Rent CPI jumped by 5.4% annualized in March from February, roughly the same as in the prior month, after the 6.9% spike in January.
The three-month OER CPI jumped by 5.9% annualized in March from February, the third month in a row near 6%, and above the 5.5% range that had prevailed in the second half of last year. The long-awaited further cooling remains long-awaited.
The OER index accounts for 26.7% of overall CPI. It is designed to estimate inflation of “shelter” as a service for homeowners and is based on what a large group of homeowners estimates their home would rent for.
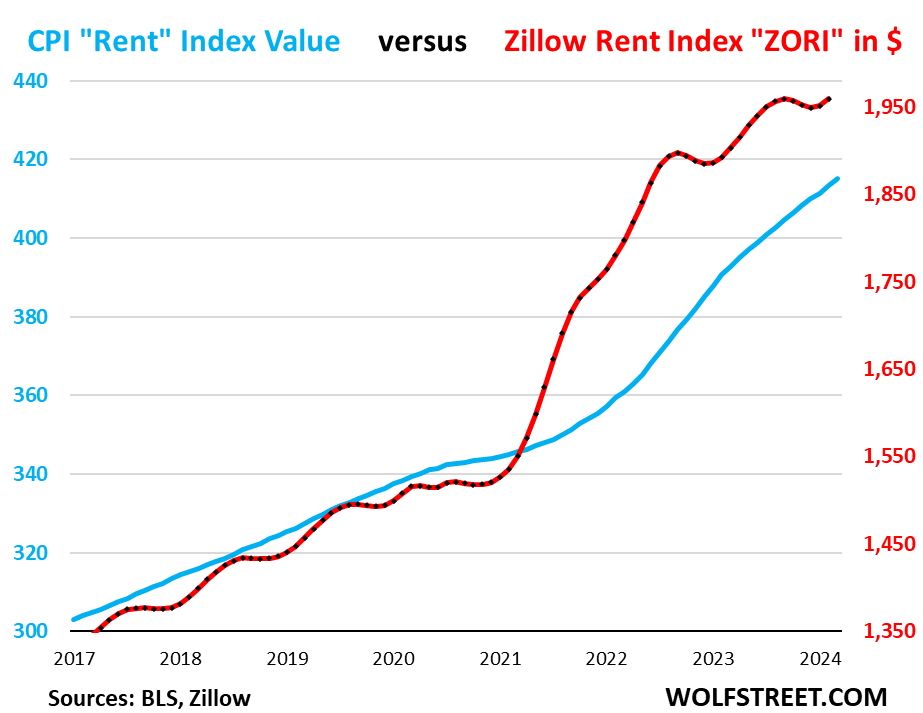
“Asking rents…” The Zillow Observed Rent Index (ZORI) and other private-sector rent indices track “asking rents,” which are advertised rents of vacant units on the market. Because rentals don’t turn over that much, the ZORI’s spike in 2021 through mid-2022 never fully translated into the CPI indices because not many people actually ended up paying those asking rents.
The chart shows the CPI Rent of Primary Residence (blue, left scale) as index value, not percentage change; and the ZORI in dollars (red, right scale). Zillow has not released the ZORI for March yet. The left and right axes are set so that they both increase each by 50% from January 2017, with the ZORI up by 48% and the CPI Rent up by 37% over the period.
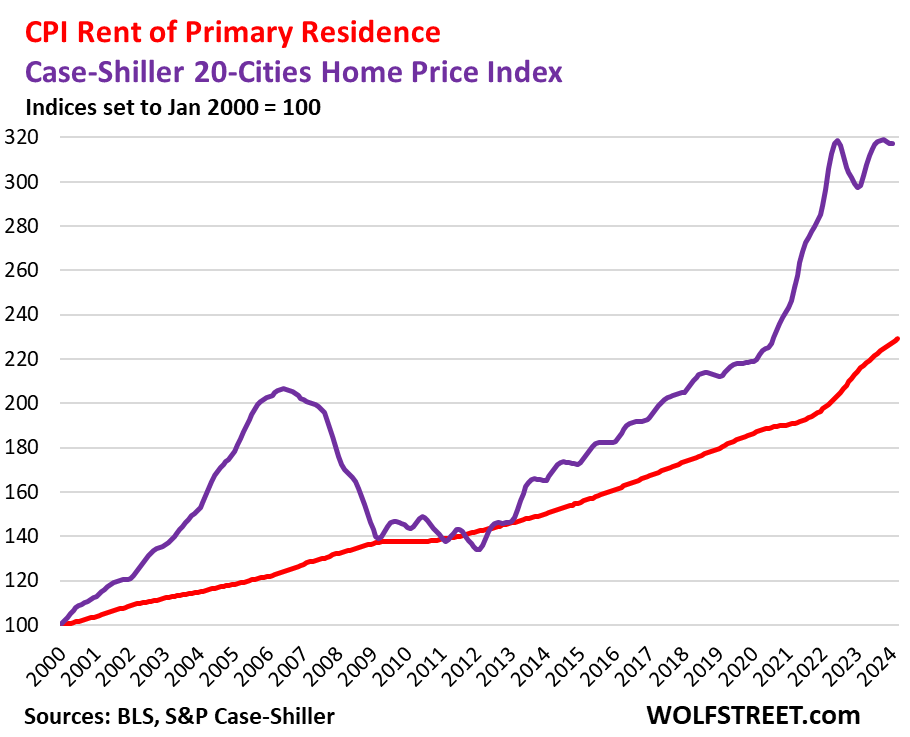
Rent inflation vs. home-price inflation: The red line in the chart below represents the CPI for Rent of Primary Residence (tracking actual rents) as index value, not percentage change. The purple line represents the Case-Shiller 20-Cities Home Price Index (see our “Most Splendid Housing Bubbles in America”). Both indexes are set to 100 for January 2000:

| Major Core Services ex. Energy Services | Weight in CPI | MoM | YoY |
| Major core services | 59% | 0.5% | 5.4% |
| Owner’s equivalent of rent | 26.7% | 0.4% | 5.9% |
| Rent of primary residence | 7.6% | 0.4% | 5.7% |
| Medical care services & insurance | 6.5% | 0.6% | 2.1% |
| Education and communication services | 5.0% | 0.2% | 1.4% |
| Motor vehicle insurance | 2.9% | 2.6% | 22.2% |
| Admission, movies, concerts, sports events, club memberships | 1.9% | -0.8% | 4.4% |
| Other personal services (dry-cleaning, haircuts, legal services…) | 1.5% | 0.8% | 5.4% |
| Motor vehicle maintenance & repair | 1.2% | 1.7% | 8.2% |
| Water, sewer, trash collection services | 1.1% | 0.3% | 5.3% |
| Video and audio services, cable, streaming | 0.9% | 1.0% | 4.4% |
| Lodging away from home, incl Hotels, motels | 1.4% | 0.1% | -1.9% |
| Pet services, including veterinary | 0.4% | 1.9% | 7.3% |
| Public transportation (airline fares, etc.) | 1.1% | -1.0% | -5.6% |
| Tenants’ & Household insurance | 0.4% | 0.5% | 4.6% |
| Car and truck rental | 0.1% | -0.8% | -8.8% |
| Postage & delivery services | 0.1% | 0.4% | 3.5% |
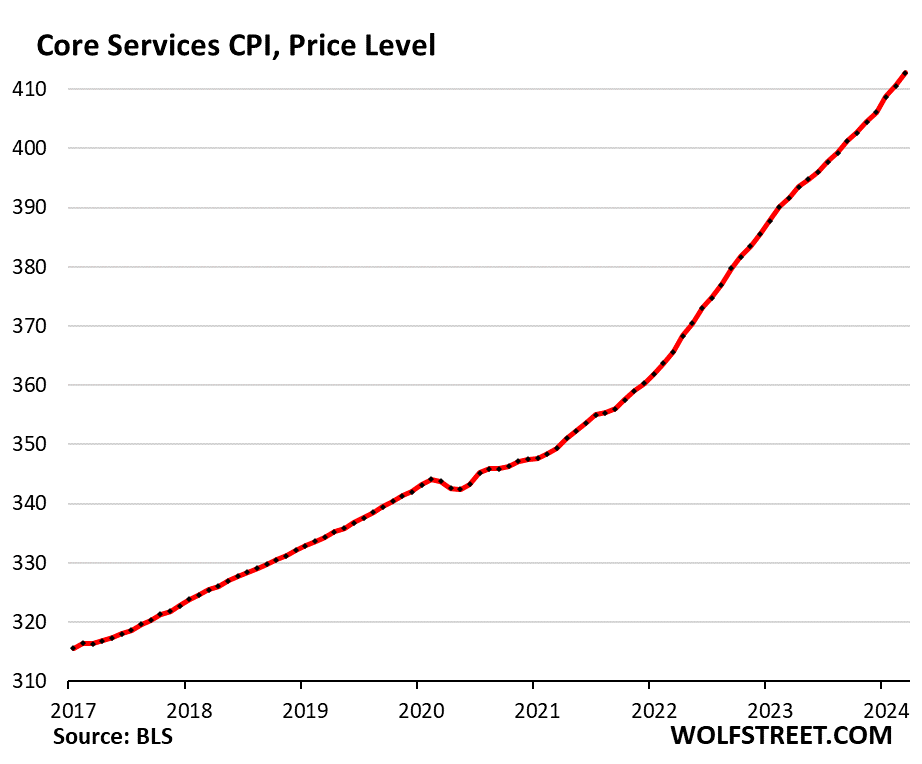
Core services price level. Since March 2020, the core services CPI has increased by 19.4%. This chart shows the core services CPI as index value, not as percentage-change of that index value. Note how the curve of price levels has become steeper in recent months.
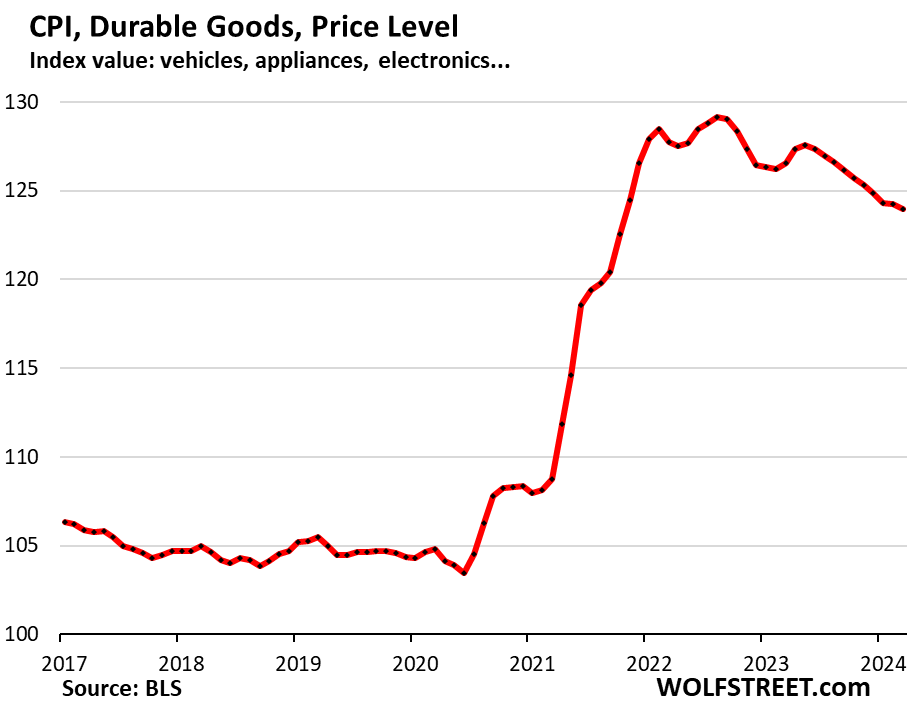
Durable goods CPI.
The durable goods CPI dipped 2.7% annualized in March from February and by 2.1% year-over-year.
New and used vehicles dominate this index, which also includes information technology products (computers, smartphones, home network equipment, etc.), appliances, furniture, fixtures, etc. And all categories experienced price declines, as durable goods prices are slowly coming down from their pandemic spike that had ended in August 2022.
From March 2020 to the peak in August 2022, durable goods prices spiked by 23.4%. Since then, they have dropped by 4.0%, having given up about 21% of the pandemic spike.
| Major durable goods categories | MoM | YoY |
| Durable goods overall | -0.2% | -2.1% |
| New vehicles | -0.2% | -0.1% |
| Used vehicles | -1.1% | -2.2% |
| Information technology (computers, smartphones, etc.) | -1.2% | -6.6% |
| Sporting goods (bicycles, equipment, etc.) | -1.0% | -2.2% |
| Household furnishings (furniture, appliances, floor coverings, tools) | -0.1% | -2.7% |
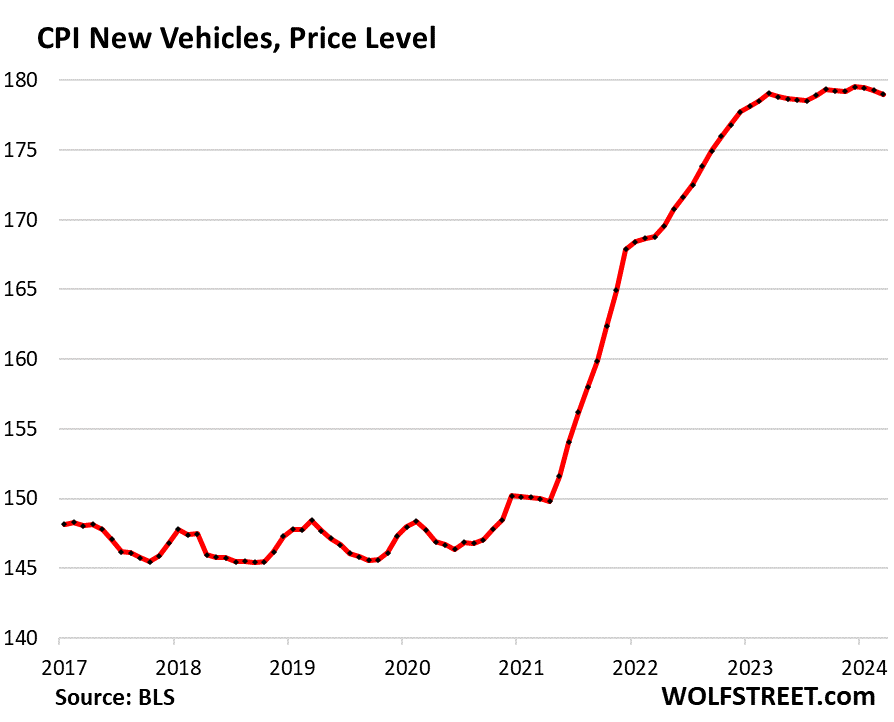
New vehicles CPI edged down for the third month in a row, after the 20% price spike in 2021 and 2022. But since March 2023, the index is essentially unchanged. New vehicle prices, unlike used vehicle prices, have turned out to be very sticky.
In the years before the pandemic, the new vehicle CPI was also meandering along a flat line, though vehicles were getting more expensive. This is the effect of “hedonic quality adjustments” applied to the CPIs for new and used vehicles and other products (detailed explanation of hedonic quality adjustments in the CPI).
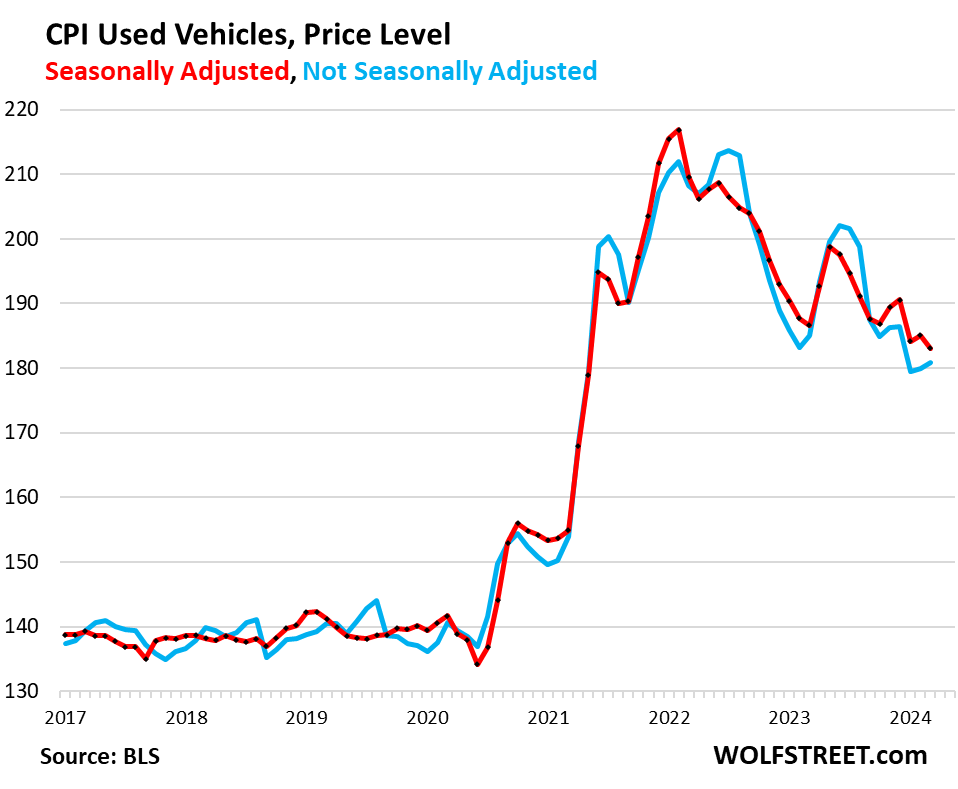
Used vehicle CPI fell by 1.1% seasonally adjusted in March from February (red); not seasonally adjusted, it rose by 0.5% (blue). March is tax refund season when people use their tax refunds for down-payments, and business perks up, and profits are easier, and prices nearly always rise in March from February. But this March, they rose less than normal.
Used vehicle CPI had spiked by 53% from February 2020 through January 2022. From that peak, it has dropped by 15.1% (seasonally adjusted), having given up 43% of its pandemic spike.
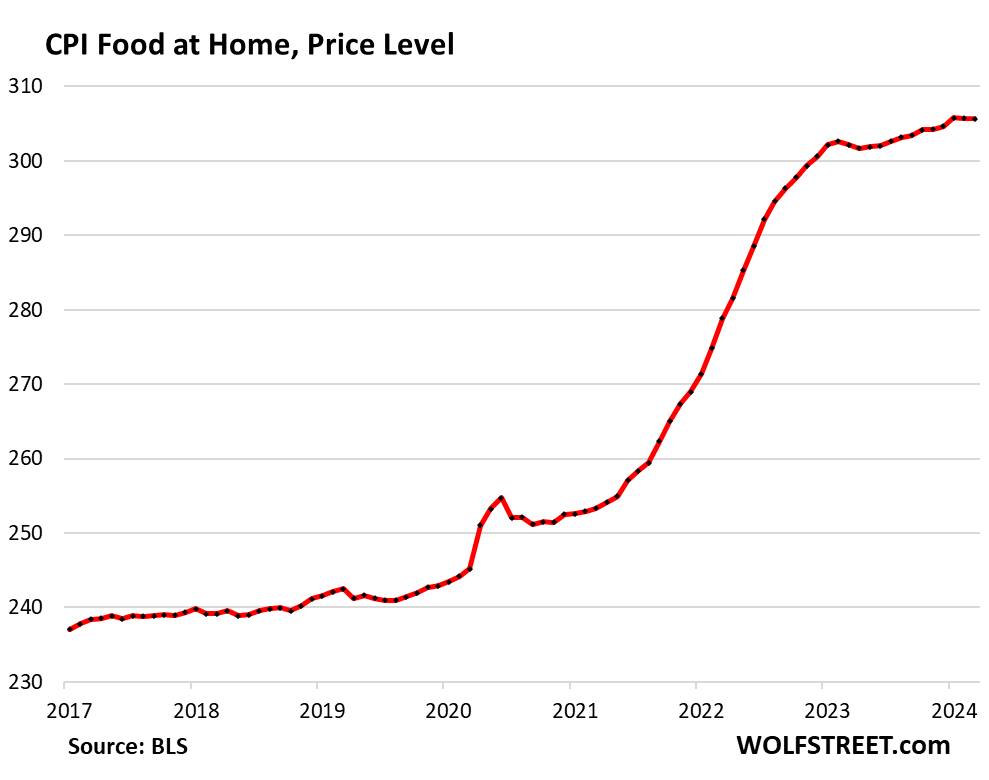
Food Inflation.
Food at home CPI – purchased at stores and markets and eaten off premises – was unchanged in March for the second month in a row, and was up 1.2% from a year ago. But after the pandemic spike, the index is still up 25% from February 2020.
| Food | MoM | YoY |
| Food at home | 0.0% | 1.2% |
| Cereals, breads, bakery products | -0.9% | 0.2% |
| Beef and veal | 0.2% | 7.6% |
| Pork | 1.1% | 0.3% |
| Poultry | 1.5% | 2.1% |
| Fish and seafood | 0.3% | -2.6% |
| Eggs | 4.6% | -6.8% |
| Dairy and related products | -0.1% | -1.9% |
| Fresh fruits | 0.3% | 1.5% |
| Fresh vegetables | -0.2% | 3.0% |
| Juices and nonalcoholic drinks | 0.6% | 3.6% |
| Coffee, tea, etc. | 0.3% | -2.2% |
| Fats and oils | -1.0% | 1.4% |
| Baby food & formula | 0.7% | 9.9% |
| Alcoholic beverages at home | -0.2% | 1.7% |
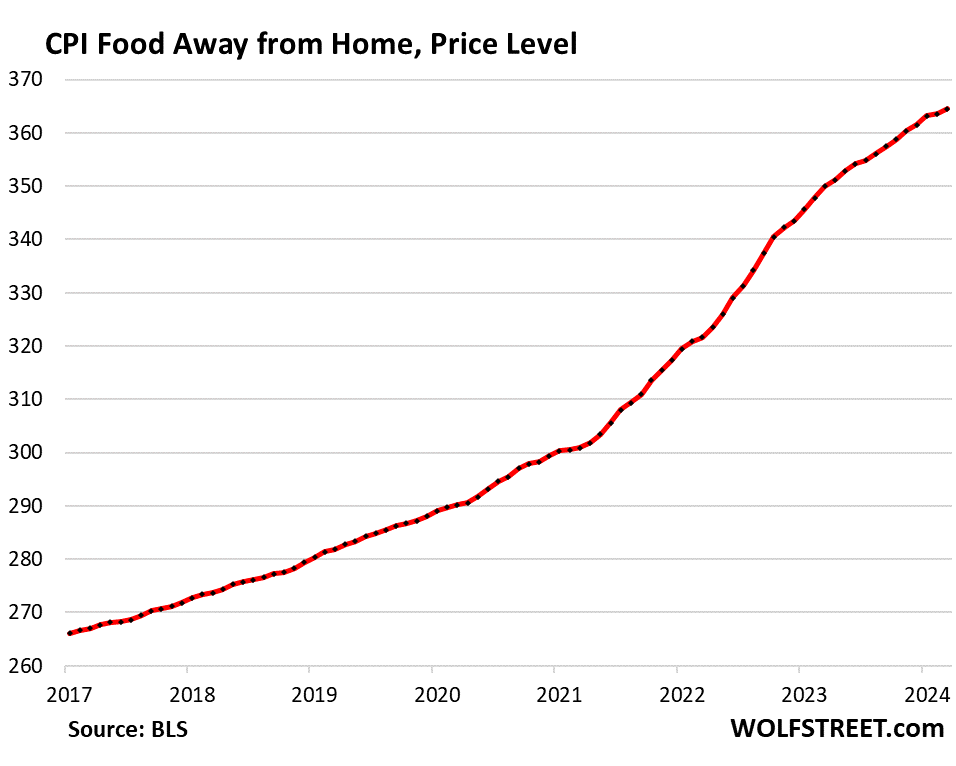
| Food away from home | 0.3% | 4.2% |
Food away from Home CPI rose by 3.2% annualized in March from February and year-over-year by 4.2%, after the massive price spikes in 2022 and 2023. Since February 2020, the index has soared by 26%.
The category includes full-service and limited-service meals and snacks served away from home, food at schools and work sites, food from vending machines and mobile vendors, etc.
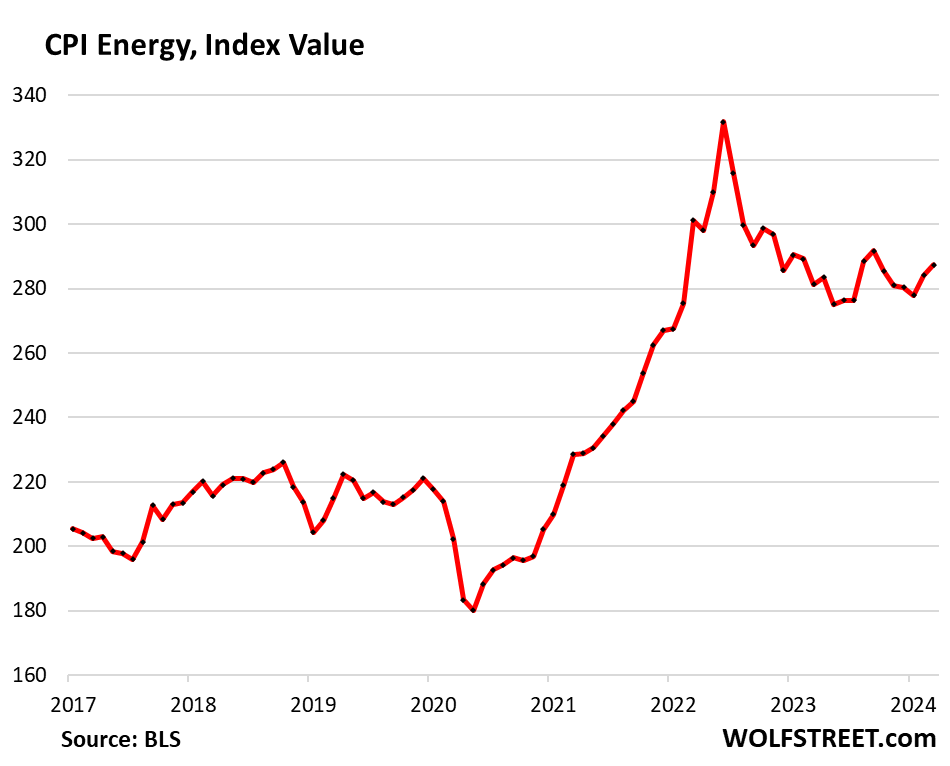
Energy.
The CPI for energy products and services that consumers buy directly rose for the second month in a row and was year-over-year for the first time since February 2023:
| CPI for Energy, by Category | MoM | YoY |
| Overall Energy CPI | 1.1% | 2.1% |
| Gasoline | 1.7% | 1.3% |
| Electricity service | 0.9% | 5.0% |
| Utility natural gas to home | 0.0% | -3.2% |
| Heating oil, propane, kerosene, firewood | -1.1% | -3.1% |
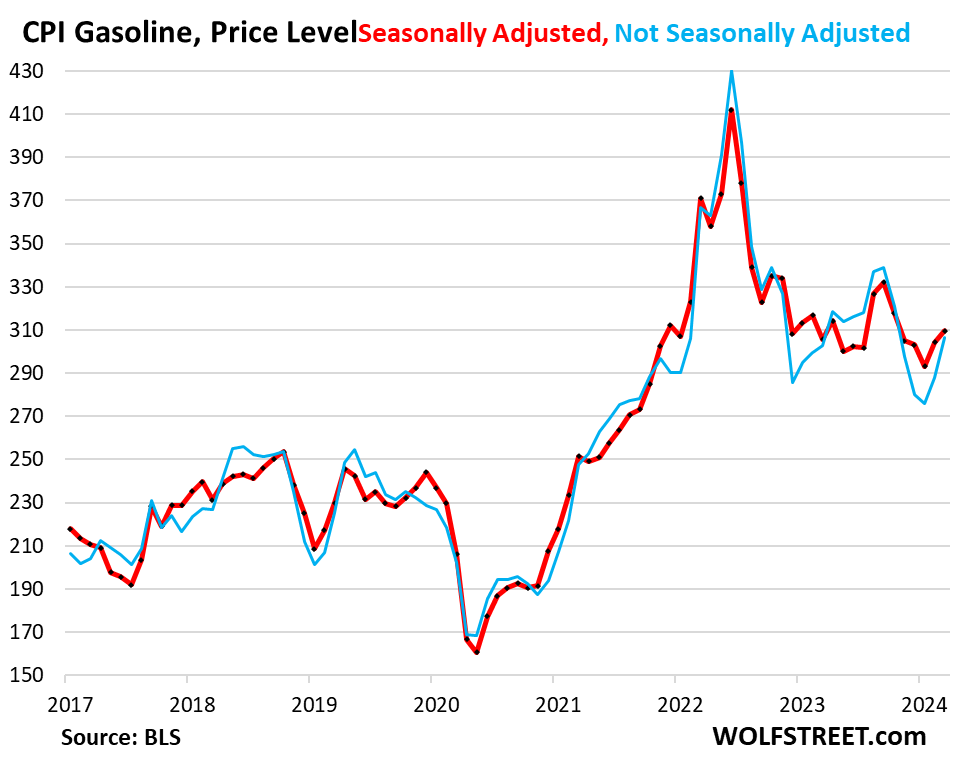
Gasoline, which accounts for about half of the energy price index, is very seasonal, with the lowest prices in December or January and the highest prices during driving-season in the summer. The chart shows the seasonally adjusted price levels (red) and the not seasonally adjusted price levels (blue), and both of them rose over the past two months:


Some might recall that it was the slowness of the decline in inflation in 1969-70 which prompted Nixon’s wages and prices freeze, which was initially very popular: https://www.cambridge.org/core/books/drastic-measures/FEB5BB48D443125FD4FCE4679808023B
My recollection is that popular support fell off sharply when it became clear that, somehow, it was wages that took the greatest hit, and price increases – at least at retail – never seemed to stop.
The beatings will continue till morale improves. The longer higher interest rates continue, the greater the percentage of federal budget dedicated to paying interest will be. Sure the US can always print the money, but the end game is probably still austerity.
Sure the US can always print the money, but the end game is probably still austerity.
The Ministry of Plenty will eventually get around to having the Ministry of Truth expunge that nasty word “austerity.”
But actually, he thought as he re-adjusted the Ministry of Plenty’s figures, it was not even forgery. It was merely the substitution of one piece of nonsense for another. Most of the material that you were dealing with had no connection with anything in the real world, not even the kind of connection that is contained in a direct lie. Statistics were just as much a fantasy in their original version as in their rectified version.
[George Orwell, 1984 page 52]
Do Mr Krugman and also Mr (Noah) Smith really believe now that we are just not trusting in what our wallets are telling us? Once again let them write what they will, as they deem to carry the water for this current administration failure.
I’ve long thought a President gets far too much credit and benefit for the generally good economic periods and a fair amount of grief for the bad periods…but in this instance the Biden / Harris administration can’t explain away what we are experiencing…
Smith and Krugman are rank apologists — I trust them as I would adders fanged.
Yeah, Yves Smith, Steve Keen, Michael Hudson, Richard Wolff and others all have pointed out Krugman’s terrible track record and even ridiculed him. He is a mouthpiece of oligarchy.
Take the interest payment rise out of the pentagon, which is responsible for a major part of the accumulated debt.
US does not need to surround both Russia and China with expensive “systems”.
Certainly the interests of the average American citizen are not well served by 700 odd military installations, especially not those 6000 plus miles away. But since when have the interests of the average American citizen been the concern of the metastasizing US security apparatus? Rice bowls must be filled, and global looting with the connivance of comprador elites all around the world must be enabled on behalf of the donor class it benefits.
https://apps.bea.gov/iTable/?reqid=19&step=2&isuri=1&categories=survey#eyJhcHBpZCI6MTksInN0ZXBzIjpbMSwyLDNdLCJkYXRhIjpbWyJjYXRlZ29yaWVzIiwiU3VydmV5Il0sWyJOSVBBX1RhYmxlX0xpc3QiLCI1Il1dfQ==
March 28, 2024
Defense spending was 56.2% of federal government consumption and investment in October through December 2023 *
$1,022.0 / $1,820.0 = 56.2%
Defense spending was 21.0% of all government consumption and investment in October through December 2023
$1,022.0 / $4,871.8 = 21.0%
Defense spending was 3.7% of Gross Domestic Product in October through December 2023
$1,022.0 / $27,957.0 = 3.7%
* Billions of dollars
Thanks for the breakdown and link CA. The category for “national defense” is particularly interesting. We have to bomb, sanction and fund genocide in order to defend the homeland.
Retired empty nester!
Food out of the home inflation is particularly evident to me, no beer with dinner!
Needed a ‘new for me’ used car last year, ouch!
Cumulative energy inflation was artificially lowered by stripping the war reserve crude oil.
Monetarists’ books have been banned.
2021 stimulus and inflation reduction [not] act…….. too much fiat printing!
yes. besides mortgage-rent, it is food, used cars-auto repairs, and fuel that are the non -deferrable expenses for people. those prices are not in deflation or stablizing at 2%
It is amazing how the op-ed pages can-t grasp that concept.
Let them eat Powerpoint and hedonic adjustments!
The media and the limited econ blogs I visit have done mathematic gyrations to minimize inflation’s bite.
Some have accused inflation realists as anti America or pro Trump.
Too much is done to protect Biden on the economy.
Therefore the next financial crisis will be a stunner for us all.
It seems evident that Washington made a textbook mistake. They overstimulated a supply constrained (post COVID) economy. The result is the inflation we are now experiencing. Supply and demand are undefeated.
Milton Friedman is their Volldamort.
Not really, no
https://fortune.com/2024/01/20/inflation-greedflation-consumer-price-index-producer-price-index-corporate-profit/
Never get involved in a land war in Asia?
Point of sale is where economics are measured, not on government powerpoints. Every single person I talk to in the supermarket, hardware store, medical office and garage at work is furious.
It’s starting to look like a depression for older people who can’t afford medical care, utilities, a car and that other thing, food.
Interestingly, the seasonal adjustment in energy does not seem to make much of a difference to removing seasonality, whereas on used cars it did well pre-covid, but not post covid.
The CPI bounce when not smoothed 3 months suggests very poor data collection strategy.
That said, gasoline for me is up 10% in the last two months in California, and I do not see that reflected in the tables. either the all important energy stats produced by our gov’t panopticon-ers, lag reality by a few months, or gas got cheaper somewhere in the US (doubt it), or there is some monkey business on this electorally sensitive number.
Given that most humans (i.e., voters) prefer to index inflation by their own reality rather than govt declarations, I assume the fiddling (compared to say shadowstats*) is to reassure the donor class that Bidenomics is working, and so its time to pull out that checkbook and reach in deep as the ROI on your political donation investment (!) still has a decent chance of paying off.
* for a decent critique of Shadow Stats, see: https://www.brightworkresearch.com/how-accurate-is-shadowstats-on-the-understatement-of-us-inflation-with-the-new-cpi/
“Used vehicle CPI fell by 1.1% seasonally adjusted in March from February” caught my eye. I’ve since learned what the BLS considers a “used vehicle” which is any vehicle 2-7 years old. I’m sure there are plenty of older cars being driven around.
Meanwhile, Y Charts reports automobile maintenance costs are up 1.74% over last month and up 8.9% over a year ago. https://ycharts.com/indicators/us_consumer_price_index_motor_vehicle_maintenance_and_repair
I’ll assume automobile insurance is not getting cheaper either. Thus, the increasing cost of transportation, especially maintenance for older autos, will hurt.
I would think that Congress and the Fed have much more influence over the economy than the pres. The pres. can try to take credit and spin it to boost popularity, but that’s just empty politics.
Yes, budget deficits can usually provide stimulus, however where is that deficit spending going? Is it being spent domestically? or is it being shipped off to Ukraine, Israel, and the US imperial legions overseas?
How much of the deficit spending makes its way into the hands of ordinary Americans, who will spend that money into the domestic economy and theoretically provide “multiplier effect”?
I haven’t seen any breakdown, but I’m sure someone can comment on this.
Also, regional inflation must be much higher: in price-gouge central here in California: since incomes are higher, the market can bear more price-gouging. Gasoline is on average over $5.40 a gallon
https://gasprices.aaa.com/?state=CA
My latest PG&E bill listed peak time electricity rates of over .52 per kWh, and some plans going as high as over .70 per kWh. again, the highest in the nation. file:///C:/Users/Jon/Downloads/residential-electric-rate-plan-pricing.pdf
Food prices are higher here than anywhere in the country as well, even though most of the food is grown and produced in the state. https://www.statesman.com/story/news/state/2024/01/29/texas-food-prices-expensive-groceries-stores-houston-dallas-austin/72368502007/
Jonny James,
If you could provide a link to a version of the file on the web, that would be very helpful.
Thanks,
ira
Sure, sorry the PG&E file did not open. If you are a customer, you can get your “personal rate plan”, they make it very confusing of course.
https://www.pge.com/tariffs/en/rate-information/electric-rates.html
Michael Hudson talking about US inflation. We think he says it best:
“Well, [there are two kinds] of inflation. I think most people are expecting us to talk about consumer price inflation because that’s what the media talks about. I’m going to give you my punchline first because that’s how we’re going to end up in this discussion.
What has really been inflated, since 2008, has not been consumer prices, but asset prices — [that is,] real estate prices, stocks and bond prices, things that the 1% hold. Wealth has been inflated much more than goods and services. [This is especially true] for real estate.
This debt has been inflated not by government debt, not by government deficits, but by the Federal Reserve creating a $9 trillion subsidy to the banks to support real estate prices, and hence the value of bank-held mortgages and stock and bond prices.
This is not discussed, or even recognized, in the mainstream economic models. Instead, we have a kind of mythology by right-wing anti-labor financial lobbyists.
This mythology is about what I think most of the listeners are expecting us to discuss: the inflation of rising consumer prices. That’s the only kind of inflation that the Federal Reserve talks about. This is all blamed on increasing the money supply, as if somehow money is creating the inflation.
They are not talking about inflation as the result of monopoly pricing. They are not talking about inflation as a result of NATO’s sanctions against Russia. They are just talking about money [as if] somehow, if we [could] just stop money supply, if we could stop the government spending so much money on Social Security and Medicare, and other social spending (not military spending) then everything would be over.”
Here’s the nexus of what the US is facing, via Wall Street on Parade 4/11/24:
“The Black Swan Rears Its Head: The Fed Has Negative Capital Using GAAP Accounting”
*Sigh*
This is why I no longer link to Wall Street on Parade. They do not understand the Fed, witness them trying to claim during the Repo Panic that it meant a bunch of banks were about to fail. It was the result of abject Fed stupidity. They had started managing short term interest rates using reserves (which BTW as they did it was also a subsidy) after the crisis. So they had used this whiz-bang new method ONLY during a time of excess reserves. When they tried draining reserves (w/o using their old approach of intervening in the money markets, including with repo), the two senior members of the money desk left, presumably due to being overruled on warnings. This was all a big Fed created nothingburger that way too many made out to be an imminent crisis.
To this issue: a central bank does not need to have a positive net worth.
https://www.researchgate.net/publication/5126604_Do_Central_Banks_Need_Capital
This makes clear the issue is political and not functional:
https://economistsview.typepad.com/economistsview/2015/05/do-central-banks-need-capital.html
On top of that, this “accounting” ignores that central bank profits are normally swept into the Treasury. The central bank arguably needs to be less generous with that.
Rubicon: Yes, I recall him writing that, but I just forgot which article or transcript – thanks for posting it.
In this vein, I would think that all the (illegal) unilateral “sanctions”, which curtail supply of commodities, contribute to the inflation as well: “Sanctions” against Russia, and also Iran, Venezuela, Syria, Yemen, China, etc
I’m not an economist, but my understanding is that the main target of the Fed’s interest rate increases was to hold down wage increases while little was done by the administration to address the increases in prices which went beyond what was needed to cover the inflation of the costs companies were experiencing. If so, isn’t this a double whammy on wage earners, in spite of Krugman’s message that he is perplexed that so many don’t realize how good the economy is for them?
Based on interviews and testimony Mr. Powell has given, I don’t think even that much thought was put into it.
I think Mr. Powell has said that this is the thing the Fed can do. He’s also said that he knows it won’t help problems like high energy costs, or high food prices, or high rents, or the lack of available workers in critical areas, or the high cost of medicine.
As for Krugman, he’s a waste of time with a podium to speak to a class of people who aren’t affected by most of the inflationary effects we’re discussing here.