Yves here. Wolf Richter unpacks why the revisions on unemployment stats don’t look untoward or suspicious, but how the hyped up reporting is obviously lousy and agenda-driven. Which is not to say that defaulting to having the Fed be the inflation fire brigade is a good idea.
By Wolf Richter, editor at Wolf Street. Originally published at Wolf Street
Our Favorite Recession Indicator shows next recession keeps moving further out.
This is kind of funny. Initial claims for unemployment insurance fell by 8,000 to 215,000 in the current reporting week, after having fallen by 9,000 in the prior week, according to data the Labor Department this morning.
What’s funny is the headline treatment that the jump two weeks ago (May 9) to 232,000 had received: It was hyped as a sign that the labor market is suddenly weakening, and that the Fed would start cutting rates soon (which we obviously pooh-poohed at the time).
So today, initial unemployment claims were back to the historically low levels that had prevailed for much of the past two years, another sign that the labor market is relatively tight. We take this seriously because the data are an ingredient in our Favorite Recession Indicator (more in a moment):
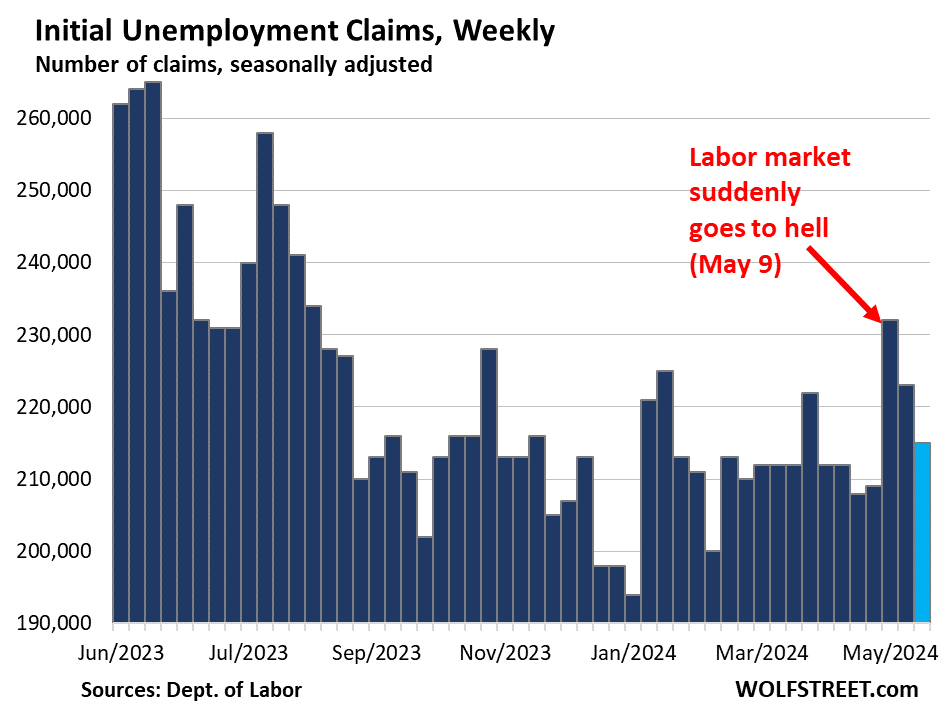 One of the big reasons why these initial unemployment claims data fluctuate from week to week so much is that this is raw data of unemployment insurance claims that newly laid off people filed with state agencies, and that the state agencies then process and submit by the weekly deadline to the Labor Department.
When they miss the deadline, those claims then go into the next week, which lowers the number of claims in the current week and increases the number of claims in the next week. When Rhode Island does it, no one notices the difference. But when one of the big states does it, it leads to big shifts from one week to the next.
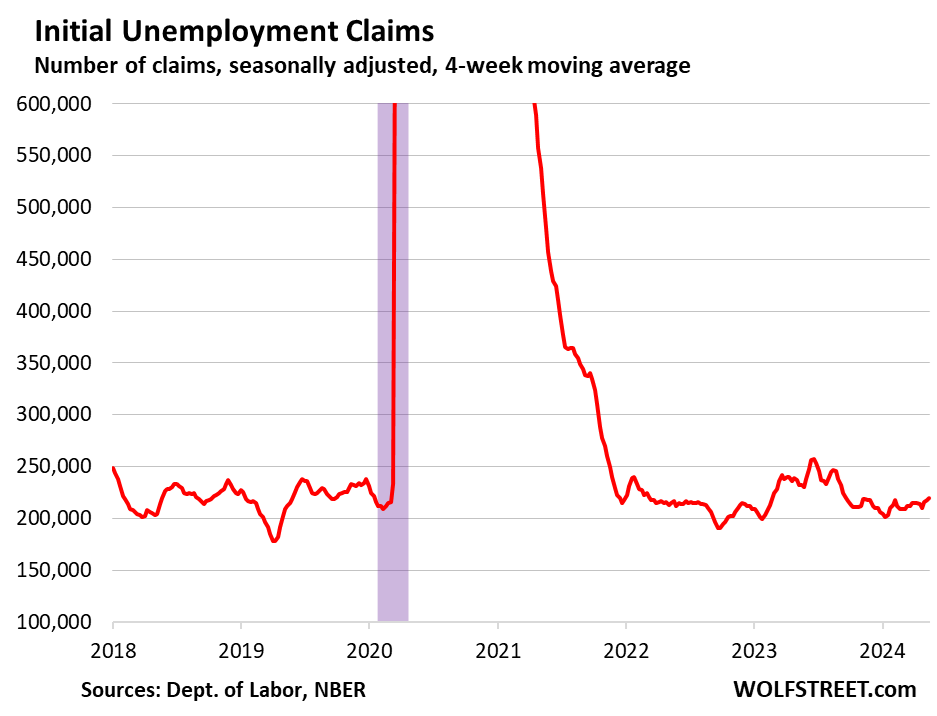
Which is precisely why the Labor Department also releases the four-week moving average, which irons out those shifts between weeks.
On May 9, the four-week moving average of initial claims inched up to 215,000, having been essentially flat at historically low levels, as we pointed out at the time.
Today, the four-week moving average ticked up to 219,750, still at historically low levels. The now vanished little hump between February 2023 and September 2023 was the result of the layoffs in tech and social media:
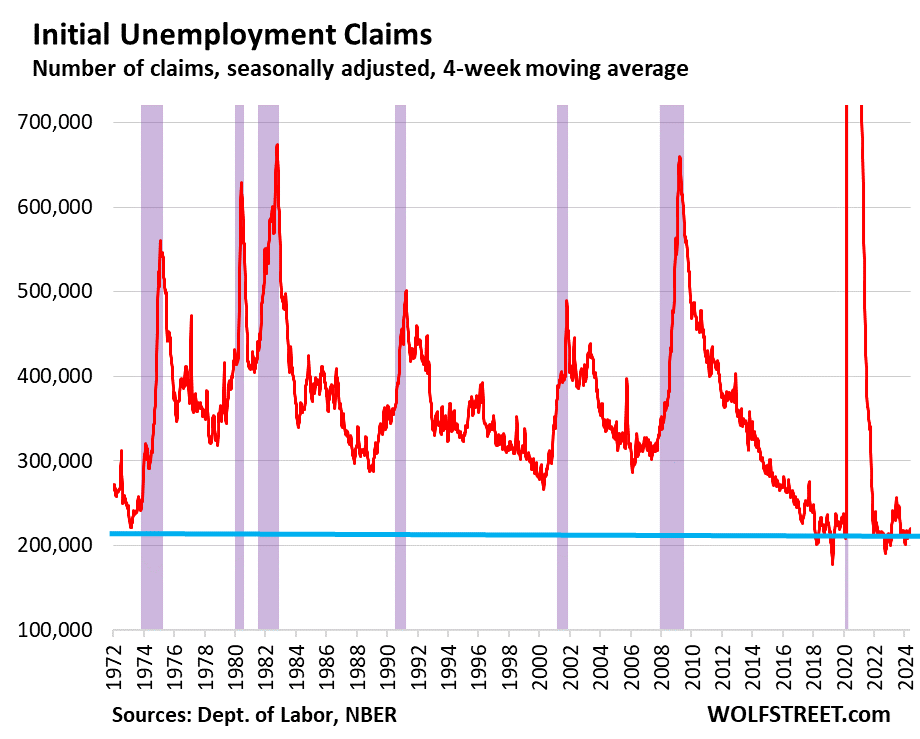
The long-term view (recessions marked in purple) shows just how historically low these initial claims for unemployment insurance are, especially when considering that employment and the labor force have increased over those decades, along with the population:
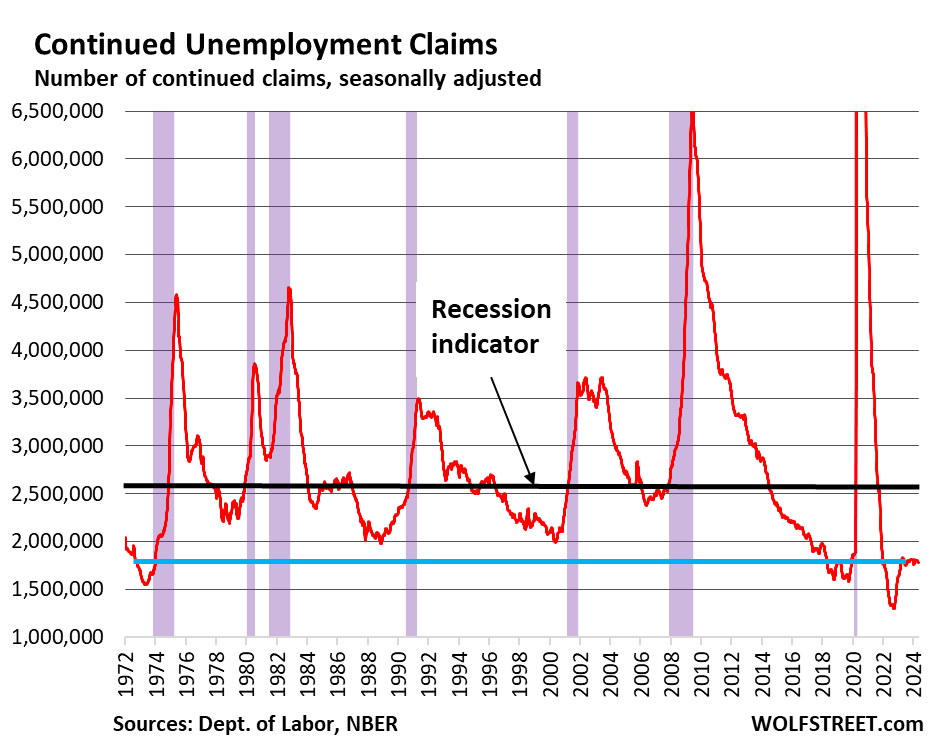
Our Favorite Recession Indicator
We’ve been on recession-watch here since shortly after the Fed kicked off its rate hikes in March 2022. The National Bureau of Economic Research (NBER), which calls out the US recessions, has always defined them as broad economic downturns that include downturns in the labor market.
So we’re looking for sharp increases in weekly claims for unemployment insurance benefits (charts above), and for sharp increases in continued claims for unemployment insurance (charts below).
The number of people who are still claiming unemployment insurance benefits at least one week after the initial application – people who haven’t found a job yet – has been in the same relatively low level since mid-2023.
In the current reporting week, 1.79 million people were still claiming unemployment insurance. The four-week moving average has been roughly steady at around 1.78, and down a tad from the levels in December of 1.81 million.
A higher level of continued claims suggests it takes people who lost their jobs a little longer on average to find a new job.
This “frying pan” pattern, as we’ve come to call it, has been cropping up in a lot of economic data, formed by an undershoot coming out of the pandemic, and then a return to normalization:
Our Indicator (Below) Points at an Oncoming Recession When the Blue Line Gets Close to the Black Line
Recessions from the Great Recession back through the early 1980s began when continued claims for unemployment insurance spiked through the 2.6-million mark (black line in the chart below).
Today’s level of 1.79 million (blue line) is far below recessionary levels (black line). It points at a labor market that is among the tightest of the past 50 years and tells us that there is still no recession in sight yet.


Quits: Total Nonfarm
Quits are usually inverse to Unemployment, but have been dropping for two years. Labor Force Participation Rate has ’bout recovered to the Before Times skid line, and is unlikely to exceed it.
So no more labor coming in, and people holding on to the job they have (less sideways movement).
I-Ching #12: Standstill [Stagnation]: When, owing to the influence of inferior men, mutual mistrust prevails in public life, fruitful activity is rendered impossible, because the fundaments are wrong. Therefore the superior man knows what he must do under such circumstances; he does not allow himself to be tempted by dazzling offers to take part in public activities. This would only expose him to danger, since he cannot assent to the meanness of the others. He therefore hides his worth and withdraws into seclusion.
Fear is powerful. So is faith.
It’s a choice.
Choose this day who you will serve.
:) Be fearless.
Excellent reminder for me. Thank you!
I have for years wondering if united state unemployment stats are fakes. This stat they give of people working how many of them are underemployed, neoliberal government world wide love to manipulate unemployment and underemploy stats. They have being doing this for decades how long will people fall for? Who knows maybe end of time
So we know two things: the labor market is tight, and also the economy sucks and real wages are low. Taken together seems very dark future
Also, gig workers can’t file for unemployment. They can’t file for unemployment, but gig working can take one off the unemployment stats.
If the Fed and govt really eanted to fight inflation…they’d look at where the majority of the money goes to.
If they wanted to fight inflation, they would be doing everything in their power to increase housing supply and decrease education and health care costs. But they won’t do that.
Manufactured scarcity is a key element of rentierism of everything.
There are pressures to drive that from various directions of the political spectrum.
I’ve been in a contract role since March 2022, fully remote desk jockey type of work with wondrously newer software, yet poorly designed for investment monthly reporting…my conclusion is that the ill-suited software solution is a sorta win in that it’s hard to grasp where it goes wrong.
Job security in the short run. But to echo your above points, I don’t accrue paid leave or official US holidays either. Weighing a return to a full time employed status, likely in office 5 days kinda seems unattractive still.
Are traditional indicators of economic shifts (downturns, expansion, etc.) relevant today? It seems the gig economy, along with digital technology allowing for greater globalization of work has disrupted forecasting. Typically economists can’t do much more than extrapolate what has happened recently and assume more of the same or else they simply find some random historical pattern, claim some backtestng and make pronouncements that are forgotten as soon as they are made since they never pan out.
How do we track those who transition from employment to financial independence, for example through reliance on securities or other financial instruments? Also, those who’ve received nice severances after being laid off, so therefore won’t be applying for EI anytime soon? Do these folks just fall off the radar, aren’t represented in the charts? Likely the only way to track this is tax data. A quick IRS search for the number of those who no longer list an employer or government assistance but nevertheless have income? I would guess this number would be in the multi-millions and increasing.
Here’s a graph of Fed Funds rate vs 10Y yield (left axis) overlayed with initial claims (right axis – logarithmic). https://fred.stlouisfed.org/graph/?g=1ociG
It’s interesting to see that at one time, initial claims increasing correlated with the Fed Funds rate eclipsing the 10Y yield (which is when the Fed inverts the yield curve). But this seemed to have broken in mid 2006 and mid 2019 and subsequently when the yield curve inverted, but initial claims held steady. But notice how in those two periods the Fed Reserve started actually lowering their rates before initial claims was doing anything substantial as well. Which suggests the Fed Reserve was seeing something that wasn’t showing up in initial claims. E.g. if it wasn’t for Covid, I think we were on path to recession/crisis in early 2020 regardless and the Fed Reserve knew it.
My guess is our traditional indicators are being eclipsed by what’s happening in the euro dollar markets. Which is pretty difficult to untangle. I like the work that Jeff Snider does on that front.
If Richter is right, that we’re not close to a recession, but most people think we are, suggests that “most people” have jobs that aren’t paying enough to live on. Ergo, increasing household and credit card debt.
Real Median household income has been dropping since its peak in 2019. Yet no one us discussing this at all.
https://fred.stlouisfed.org/series/MEHOINUSA672N/
This year it became apparent that my family was not going to survive on two full time jobs and I picked up a third.
My inexperienced reading of the chart is you won’t get a recession without the dreaded rise towards black, but a recession might not occur when it does, ie the red line might turn down again without recession. I recall Mosler saying a recession was unlikely when gov is injecting 7% of gdp into the economy, so all the war funding seems pretty bullish to me.