Yves here. This post presents estimates of the damage to US, China, and the rest of the world for various tariff war scenarios. The picture is not pretty.
By Francesco Paolo Conteduca, Michele Mancini, and Alessandro Borin. Originally published at VoxEU
Sweeping US tariff increases in 2025 are upending global trade. This column draws on new data and simulations to show that, even with partial suspensions, the measures are set to trigger sharp contractions in trade, significant welfare losses (especially for the US), and major disruptions to global supply chains. Direct trade between the US and China may collapse, while indirect exports of Chinese products to the US will be far less affected. The tariff escalation could also distort production patterns and drive a sharp reconfiguration of global value chains, resulting in a less efficient and more opaque trade system.
On 2 April 2025, following tariff increases in February and March on imports from Canada, Mexico, and China covering steel and aluminium and cars, the US announced sweeping so-called “reciprocal” tariffs affecting most of its trade partners. The structure of these new measures, rather than being driven by actual discrepancies between US tariffs and those imposed by trade partners, is instead guided by the ratio of trade deficits to imports, with a minimum increase of 10 percentage points – far exceeding market expectations (Baldwin and Barba Navaretti 2025, Evenett and Fritz 2025).
Understanding the implications of these measures requires a clear view of the tariff landscape prior to President Trump’s second term. Yet accurately measuring applied tariffs remains a challenge (Caliendo et al. 2023, Teti 2024). To overcome the limitations of the widely used WITS database – particularly its omission of tariffs imposed through trade disputes – we use as a starting point the 2019 CEPII MAcMap-HS6 database (Guimbard et al. 2012) and incorporate detailed data on tariff escalation between the US and China during Trump’s first term from Fajgelbaum et al. (2024), as well as tariff reductions granted under Biden’s term.
Crucially, the 2 April tariffs do not align with the levels that would close the gap between US import tariffs and those faced by US exports abroad, as computed using our dataset. In fact, the new tariffs are consistently higher than what would be required to achieve genuine reciprocity (Figure 1).
Figure 1 Tariff increases based on reciprocity versus the 2 April tariff increases
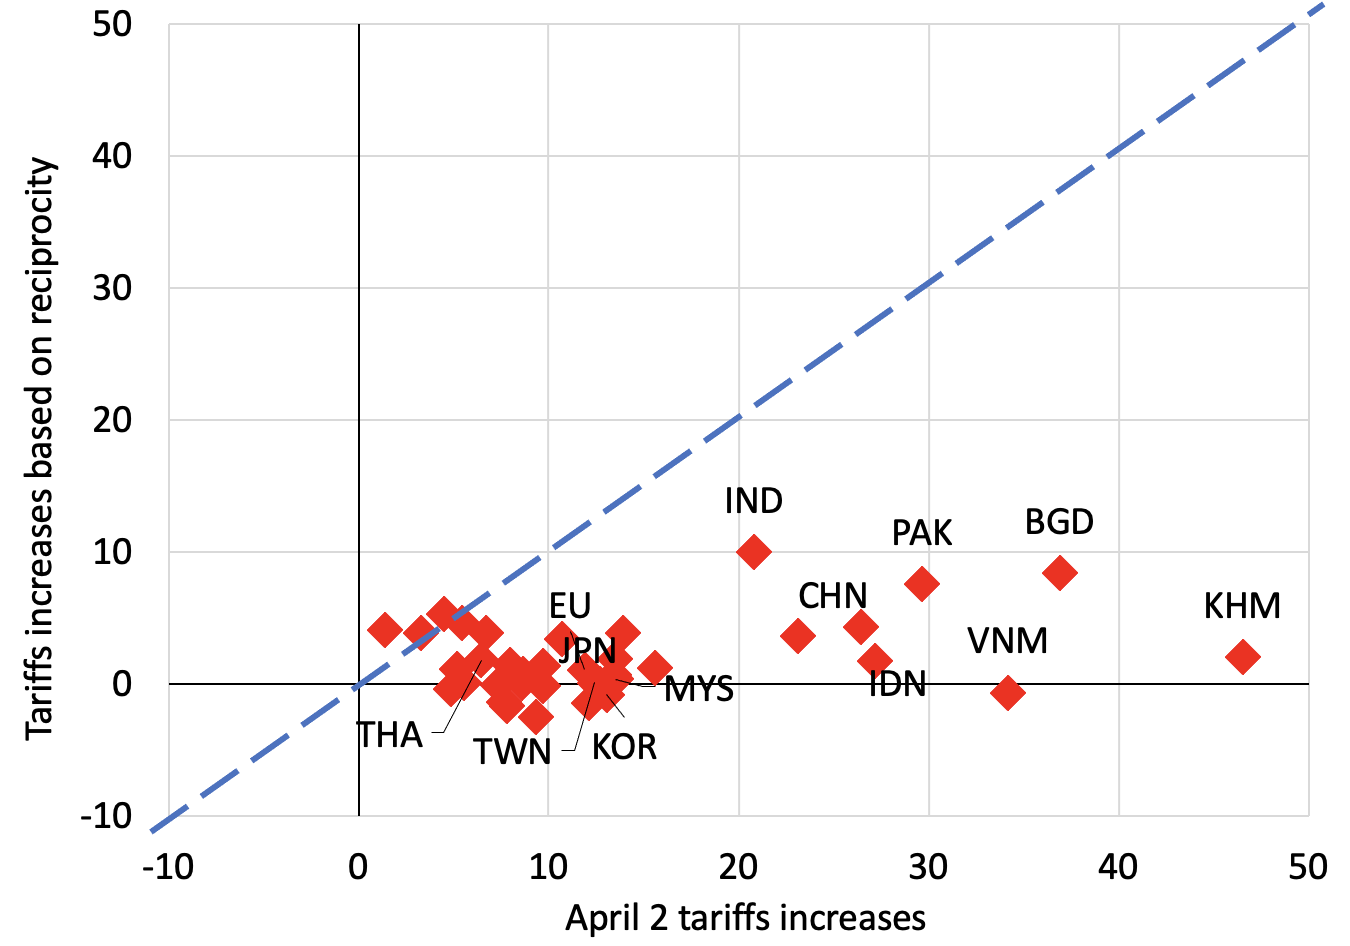
Source: own elaboration based on data from CEPII MAcMap-HS6, WITS, Fajgelbaum et al. (2024), CEPII BACI, and official US documents.
Notes: tariff increases based on reciprocity are obtained by taking the difference between the sector-level effective tariff rate faced by the US in foreign markets and the sector-level effective tariff rate on US imports.
Southeast Asian economies such as Vietnam, Indonesia, and Malaysia would be among the most heavily affected. For the EU, the 2 April tariffs would raise the effective tariff rate to around 17%, up from below 2% before the beginning of Trump’s second term. China’s initial retaliation to the US’ announcement triggered a tit-for-tat escalation of symmetric tariff hikes, which led the two countries to reach a bilateral tariff rate of around 125%.
On 9 April, Trump’s “reciprocal” tariffs were partially suspended for a 90-day grace period. During this window, a flat 10 percentage point increase will nevertheless apply to all trading partners – excluding Mexico, Canada, and China, which are the targets of country-specific measures. Imports of pharmaceutical goods and electronics – including semiconductors and a range of consumer products – were temporarily exempted, but sector-specific measures have already been announced and are expected to be implemented in the coming months. The exemptions also extend to many refined and raw mineral products, for which no additional tariffs have been proposed so far.
Given their magnitude – exceptionally high even by historical standards – the new tariffs are likely to have significant effects on macroeconomic aggregates, trade patterns, and the structure of global value chains (GVCs). Drawing on our own database, we construct baseline tariff levels reflecting the period before Trump’s second term. From this baseline, we design three scenarios to assess the potential impact of the 2025 measures.
The first is a milder scenario involving the February and March measures, the observed tariff escalation with China, and the suspension of the reciprocal tariffs announced on 2 April. In this ‘status quo’ scenario, we also include the retaliation implemented by China and Canada. This reflects the situation as of the time of writing (20 April).
The ‘full’ scenario, instead, assumes no suspension of the 2 April tariffs, combined with the extension of tariffs to pharmaceuticals and electronics, as already announced. We assume that these products will face tariff increases in line with those previously imposed on steel, aluminoum, and cars – i.e. a 25 percentage point hike.
Lastly, we also evaluate the possibility that affected countries retaliate by matching US tariff increases at the sector level (‘full + retaliation’).
Under the ‘status quo’ scenario, the effective tariff rate on US imports would reach almost 30%, up from 3% before the new administration came into power (Figure 2). The tit-for-tat escalation with China alone accounts for about 17 percentage points of the total tariff increase. Under the ‘full’ scenario, the effective tariff rate on US imports rises to nearly 38%. Measures on pharmaceuticals and electronics account for almost 4 percentage points, and the 2 April measures fully implemented for 8 percentage points. In the ‘full + retaliation’ scenario, US trade partners retaliate by raising their own sector-level tariffs to match the US increases seen under the ‘full’ scenario. As a result, the effective tariff rate faced by US exports in foreign markets climbs to 32%.
Figure 2 US effective tariff rates under the ‘status quo’ and ‘full’ scenarios
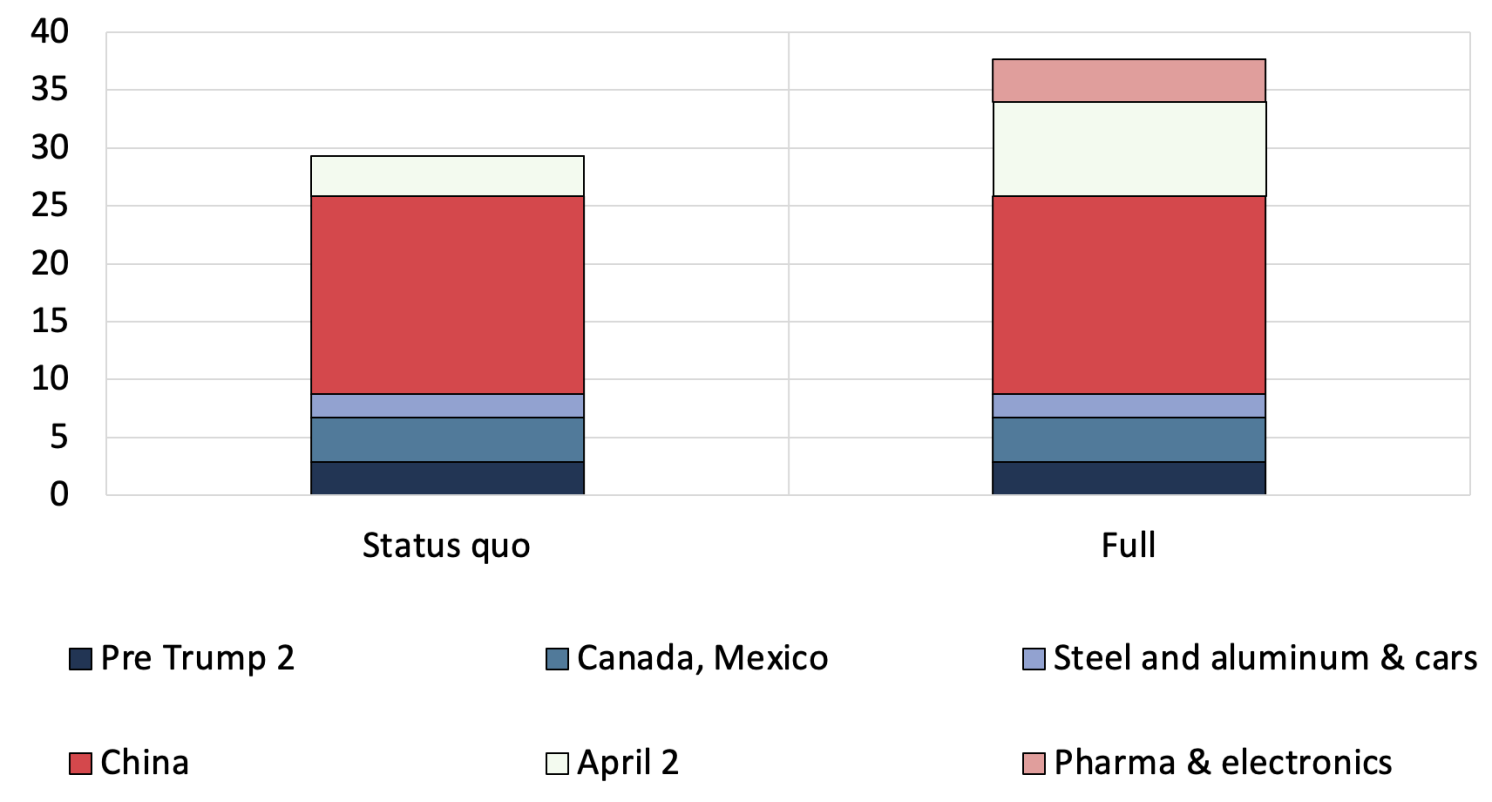
Source: own elaboration based on data from CEPII MAcMap-HS6, WITS, Fajgelbaum et al. (2024), CEPII BACI, and official US documents.
To quantify the economic impact of the tariff shock under the three scenarios – ‘status quo’, ‘full’, and ‘full + retaliation’ – we simulate outcomes using the multi-country, multi-sector model developed by Baqaee and Farhi (2024). This model captures how trade shocks propagate through global production networks, accounting for input complementarities and nominal wage rigidities. We calibrate the model to 33 countries or regions and 18 sectors, using the most recent 2023 inter-country input-output tables from the Asian Development Bank, complemented by our detailed tariff data. 1 Further methodological details are available in Conteduca et al. (2025) and Attinasi and Mancini (2025), where a similar approach is used to assess the effects of trade decoupling between geopolitical blocs.
Welfare declines significantly in the US – by around 2% under the ‘status quo’ scenario, and by nearly double that under the ‘full + retaliation’ scenario (Figure 3). 2 In the euro area the impact is more contained, remaining below 1%. In China, welfare losses hover around 1.5% across all scenarios. This reflects the country’s exposure to significantly higher tariffs, coupled with the fact that China implements retaliatory measures in each scenario. At the global level, welfare losses reach up to 2% under the ‘full + retaliation’ scenario.
Figure 3 Change in welfare (percent)
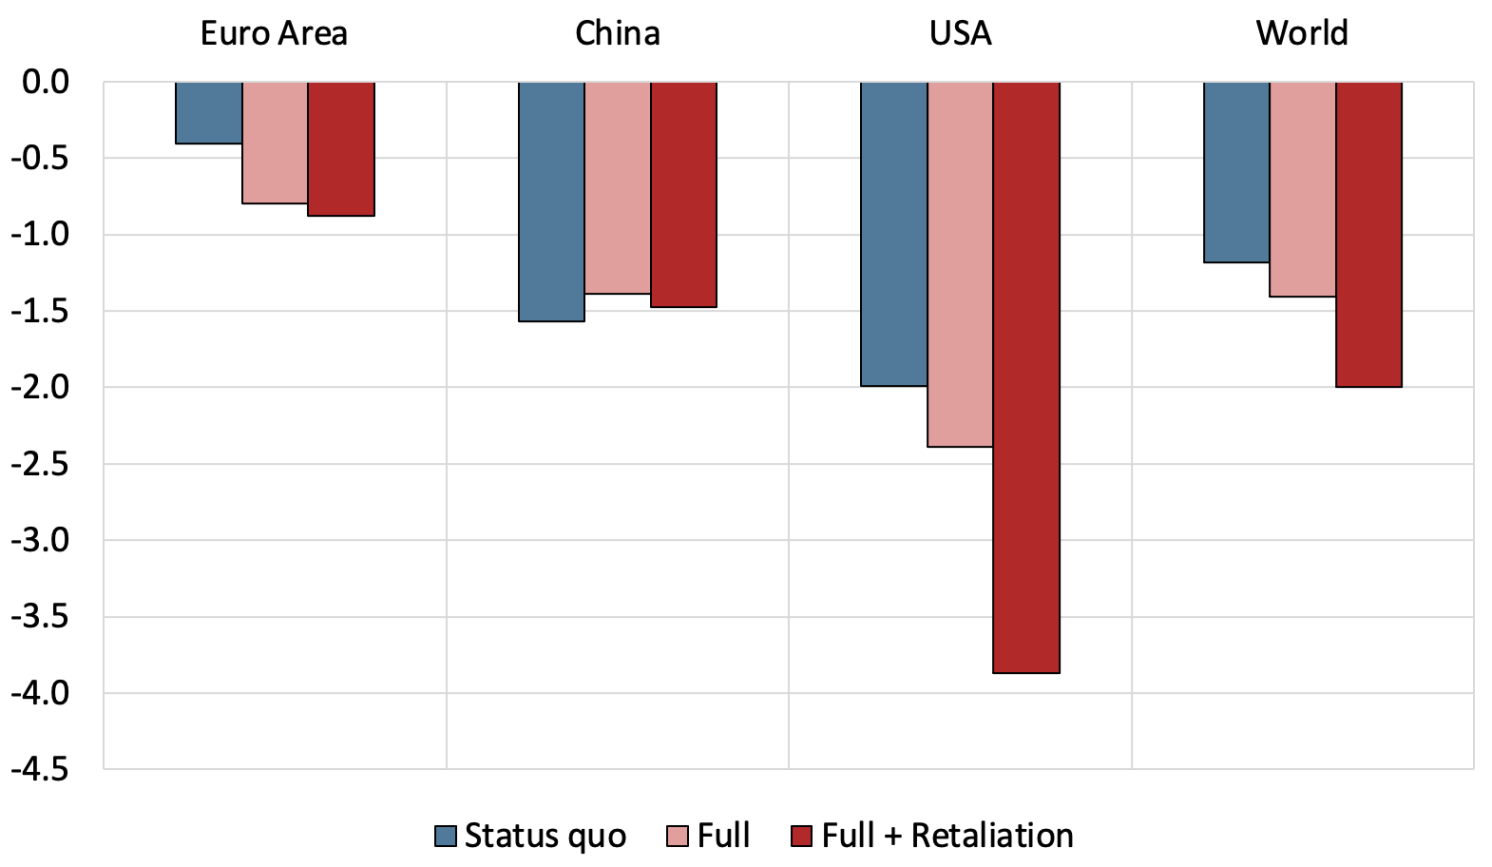
Notes: The figure plots the change in welfare across different scenarios.
Tariffs increase purely domestic output in the US (i.e. production that neither relies on foreign inputs nor serves foreign markets). However, across all scenarios this increase is not nearly enough to offset the decline in production that depends on international trade – either because it relies on imported inputs or because it serves foreign markets (Figure 4).
Figure 4 Change in US gross output, by category of gross output (percent)
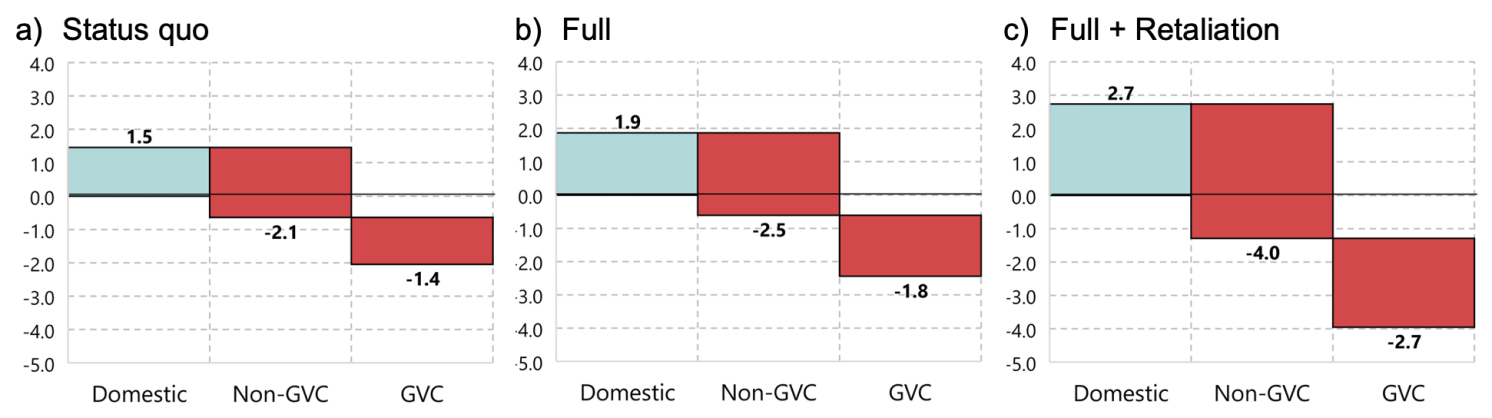
Notes: The figure shows changes in gross output, broken down into three components: Domestic output refers to production that never crosses a border; Non‑GVC output covers production involved in traditional trade that crosses a single border; and GVC output captures production linked to global value‑chain trade, crossing more than one border. These definitions follow Borin et al. (2021).
The shock leads to widespread disruption of global supply chains. Across all scenarios, output falls most sharply in sectors that are highly integrated into GVCs, notably “electrical equipment and electronics”, and “transport equipment”, where around 30% of output depends on GVCs. In contrast, sectors that are less integrated in international supply chains, such as “agriculture” and “rubber and plastics”, experience smaller declines (Figure 5).
Figure 5 Change in sector-level global gross output, by GVC intensity under the ‘status quo’ scenario (percent)
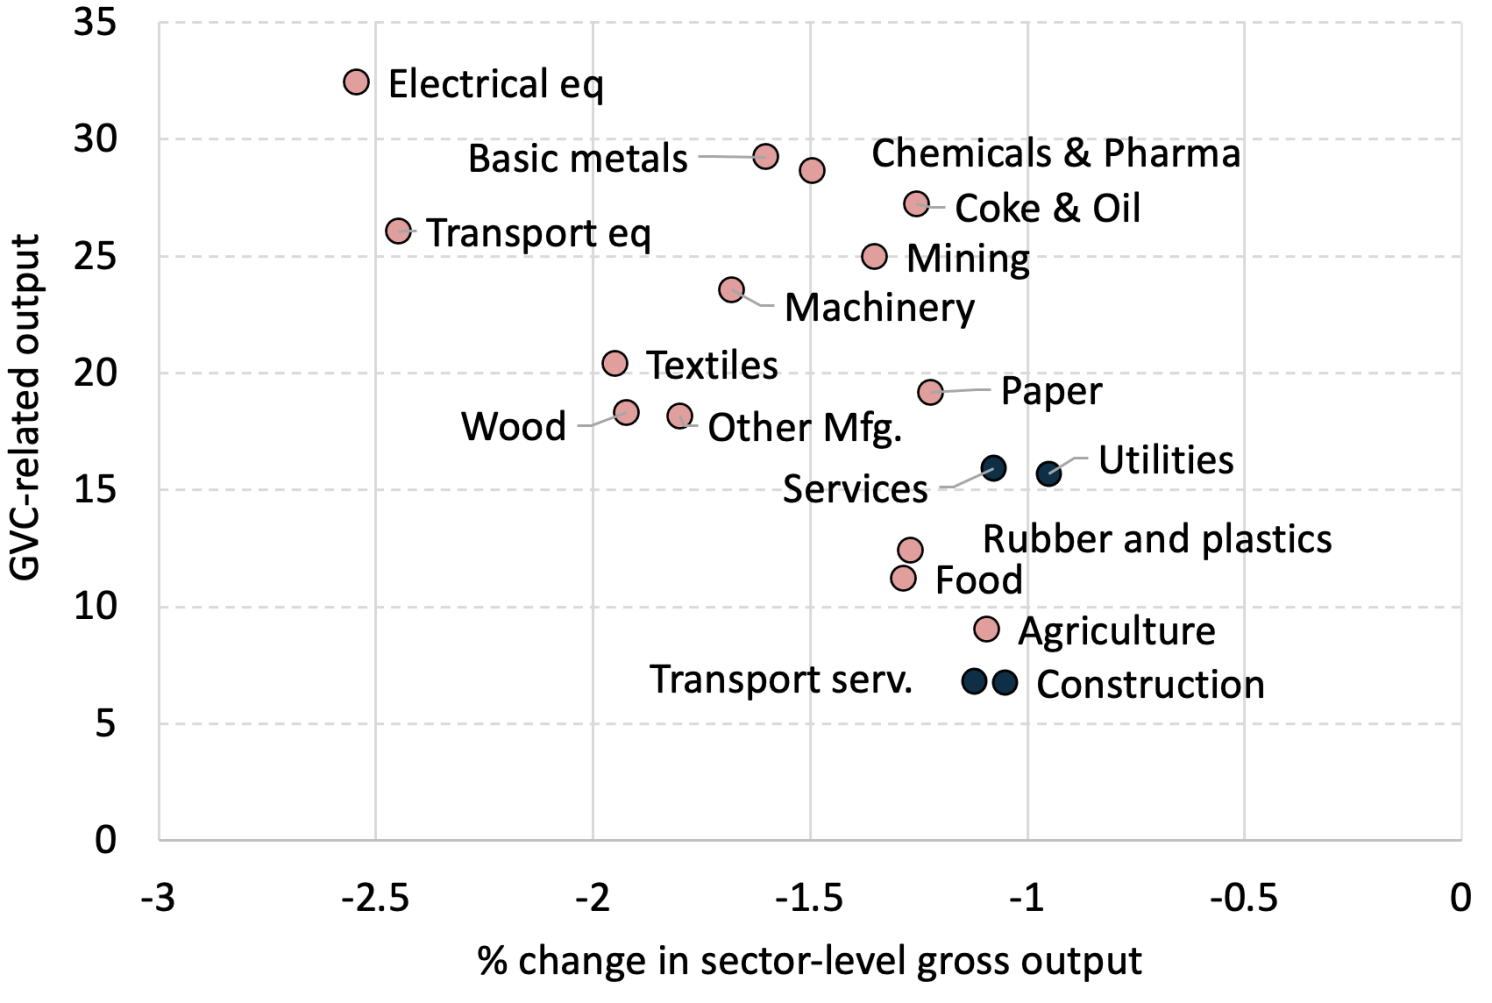
Notes: The figure plots the change in sector-level gross output. GVC-related output is the share of total gross-output crossing at least two borders, from Borin et al. (2021). The results reported are for the “Status quo” scenario. Red dots are for sectors targeted by tariffs, while blue dots are for sectors that do not see any tariff increase.
Global trade is severely affected by the tariffs, with trade flows contracting by between 5.5% and 8.5% relative to the pre-shock economy, depending on the scenario. Trade flowing through GVCs – i.e. shipments that cross several borders before reaching consumers – shrinks by roughly 2 percentage points more than direct bilateral trade. The decline is especially steep in sectors such as “transport equipment” and “electrical equipment and electronics”, which contract by 16% and 12%, respectively, in the ‘full + retaliation’ scenario.
Trade reallocation patterns are striking. US imports of goods and services from China collapse across all scenarios, falling by about 90%, as nearly all Chinese goods are subjected to prohibitive tariffs (Figure 6a). Imports from Canada and Mexico also decline significantly (by roughly 30%), while imports from the UK – largely spared by the tariff regime – experience a modest increase.
In response to the loss of access to the US market, Chinese exports will likely be redirected towards other destinations (Figure 6b). In the ‘full + retaliation’ scenario, exports to the euro area and the UK increase by around 9%. The most pronounced shifts, however, are seen in Latin America and, even more so, in Canada and Mexico – countries that are geographically closer to the US and more deeply integrated into its trade networks.
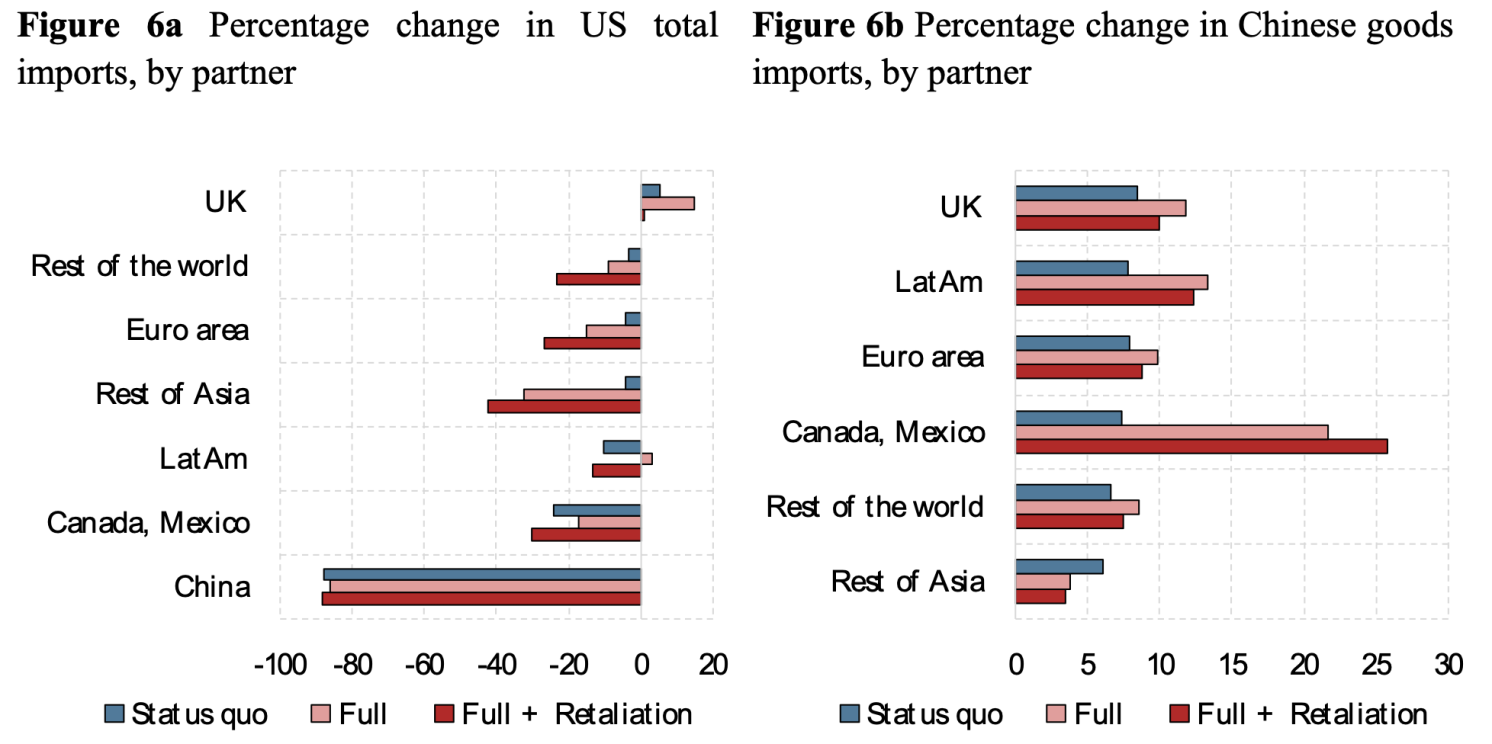
Note: The figure plots the percentage change in trade flows.
While direct exports of Chinese value added to the US plummet from $410 billion to just $2 billion, indirect exports prove far more resilient, falling only from $124 billion to $84 billion. How do these products still reach the US market? Before the shock, about 23% of Chinese goods entered the US indirectly. Under the ‘full + retaliation’ scenario, more than half of the Chinese value added reaches the US via Mexico, with significant shares also flowing through Asian countries (21%), particularly Korea and Vietnam (Figure 7). These detours reflect both the structure of GVCs and the tariff gradients imposed by the Trump administration. The re-routing of Chinese products could potentially be curbed through the implementation of stricter rules of origin in the US. Such regulations could, for instance, prevent the import of any product containing a specified minimum level of Chinese value added. However, these measures would likely introduce considerable inefficiencies, leading to substantially higher transaction costs and potential disruptions to well-established supply chains.
Figure 7 Share of Chinese value-added imported by the US before the shock and under the ‘full + retaliation’ scenario, by exporting country
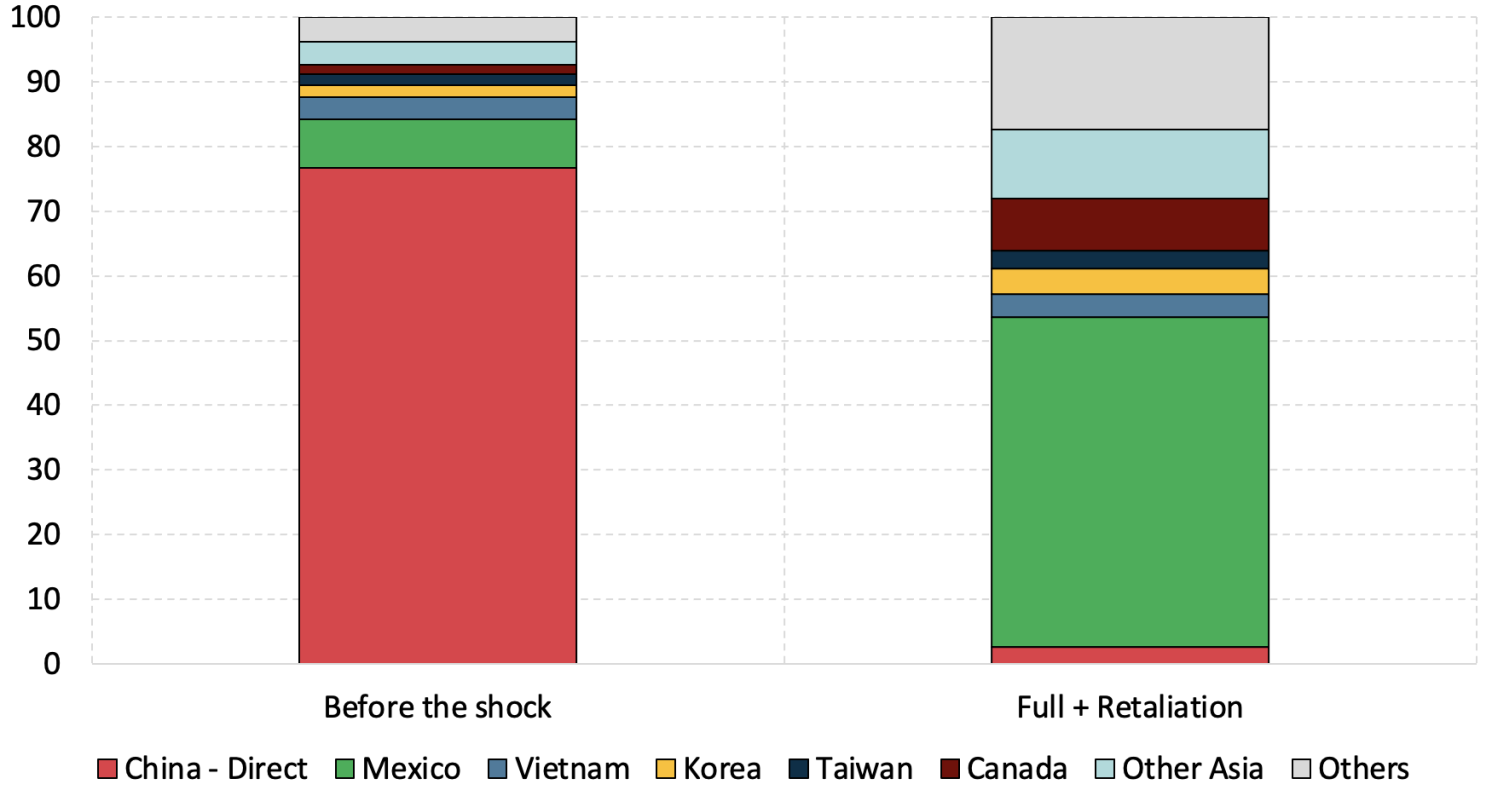
Notes: The figure plots the share of Chinese value-added imported by the US by exporting country or region, over total Chinese value-added imported by the US.
In conclusion, across all scenarios considered, the new tariffs introduced as of 2 April 2 – even assuming that the grace period results in a permanent suspension of “reciprocal” tariffs – lead to a net global welfare loss of (-1.2%), a stronger loss for the US (-2%), and a sharp fall in trade (-5% overall), especially between the US and China (-90%). Supply chains tilt sharply away from their current geography, sacrificing efficiency and transparency while driving up the cost of designing and policing rules of origin.
Authors’ note: The views expressed here are those of the author and do not necessarily represent the views of the Bank of Italy.
See original post for references


Thank you for this. My distinct impression is that DJT doesn’t know what he is doing. Unless it is: You never want a serious crisis to go to waste. We’ll see how that goes from under the rubble.
DJT is destroying the economy in desperate efforts to disprove doubts that he is mentally incompetent. There will be no end without intervention.
From under the rubble, intervention must rise.
The collapse of international trade that started in August 1914 and didn’t fully recover until about 2000 came about because of war. I wonder if we will get a collapse that will trigger a war. It is funny how the industry that I joined was just about finished recovering eighty years later. We we have another cycle?
In 1914 the war triggered the collapse of international trade, not the other way around.
I don’t believe Jbird was ascribing causation; just indicating sequence.
JBird ascribed the collapse of trade to the war. Easier to see when commas are added.
The collapse of international trade, that started in August 1914 and didn’t fully recover until about 2000, came about because of war.
Karoline Leavitt spins it as a prelude to another golden age of American manufacturing.
https://x.com/PressSec/status/1919754346356498788
Can someone define welfare loss? My first thought was GDP contraction…
I keep telling myself there is a master plan at work but I’m not smart enough to see it.
Then I remember this quote: some people want to watch the world burn.
Regardless, back to eliminating all discretionary spending.
I get the impression that this entire sturm und drang over tariffs is a gigantic distraction away from the real crime that was committed against American working people over the course of the past 50 years — a bipartisan malpractice of domestic policy which simultaneously destroyed vast swathes of US industrial capacity while immiserating the bulk of its citizenry to the material and political advantage of a tiny minority.
Instead of getting down to the difficult work of repairing the damage via a robust industrial and redistributive policy suite, the Trump administration engages instead in noisy distractions against “furriners” … 🤦♂️
The silver lining is that by force US will become less consumerist and there will be less overall pollution and CO2 released in the air, fewer forests cut down, less fish scooped from the sea, more terrain left fallow.
…but all those burning tire barricades in the barrio and elsewhere are sure to add to the pollution account.
That’s not actually silver, it’s burnished tin.
I think many Americans rely on retail therapy as a palliative self-care; a means for distraction from the soft horrors of day-to-day being. It may not be ideal, but if you too suddenly take away the dopamine drive-thru — what then?