Yves here. Among this post’s important findings are that the Trump trade escalation will lower real wages in the US. Quelle surprise! It also contains an informative chart that shows the estimated impact by state.
By Andres Rodríguez -Clare Mauricio Ulate, and Jose P. Vasquez. Originally published at VoxEU
In 2025, the US government announced a series of tariff increases targeting major trading partners, including Canada, China, and Mexico. This column estimates the economic consequences of these proposed tariffs to the US and globally. According to this model, real wages in the US decline by 1.4% in 2028 and GDP falls by approximately 1%, with differences across states. Manufacturing in the US may enjoy a temporary surge in employment but employment in services and agriculture declines. Globally, countries that trade more with the US suffer greater losses.
Since early 2025, the US government has announced a series of tariff increases targeting major trading partners, including Canada, China, and Mexico, alongside a broad package of so-called reciprocal tariffs unveiled on what was labelled ‘Liberation Day’. As noted by Baldwin and Barba Navaretti (2025) and Evenett and Fritz (2025), these measures potentially contradict WTO rules. Although the implementation of most tariffs was postponed within days of the announcement, those targeting China went into effect as scheduled. In response to Chinese retaliation against the initial US tariffs, the US further raised tariffs on Chinese imports to over 145%, though they have since been scaled back to 30%.
The immediate market reaction to the Liberation Day announcement underscored its significance, as the US dollar depreciated upon impact (Hartley and Rebucci 2025). While significant uncertainty remains regarding the definitive tariffs to be imposed, enacting even a portion of the announced tariffs could drive the average implied US tariff to levels not seen in decades. Given the crucial role of international trade in today’s global economy and the retaliatory actions taken, especially by China, this series of tariffs has the potential to ignite the largest trade war in history, with significant short- and medium-term economic impacts in both high- and low-income countries.
In our paper (Rodríguez-Clare et al. 2025), we use a state-of-the-art dynamic quantitative trade model to evaluate the economic consequences of the proposed 2025 tariff increases. Our framework incorporates several crucial features for a comprehensive analysis: workers who cannot instantly and costlessly switch jobs between industries, involuntary unemployment, trade connections among industries and regions, and a disaggregation of the US into its 50 states with flexible redistribution of tariff revenues across states.
Key Findings for the US: Aggregate Impacts
Our baseline scenario considers a four-year period of elevated tariffs, assuming full retaliation from trading partners and no other concurrent shocks. Under these conditions, real wages decline by 1.4% in 2028, the final year the tariffs remain in effect. Although higher tariff revenues partially offset this loss, GDP still falls by approximately 1% by 2028.
Labour force participation and employment also fall, reaching a level 0.65% and 1.1% below baseline in 2028, respectively. As lower real wages reduce the attractiveness of market work relative to home production, some individuals exit the labour force entirely.
The presence of downward nominal wage rigidity (meaning nominal wages do not fall easily) implies that when the tariff shock ends, wages cannot immediately adjust downward in previously protected sectors. This generates unemployment that peaks at 0.5% in 2029, the year we assume tariffs revert to normal levels.
Figure 1 Paths of relevant variables for the US on aggregate
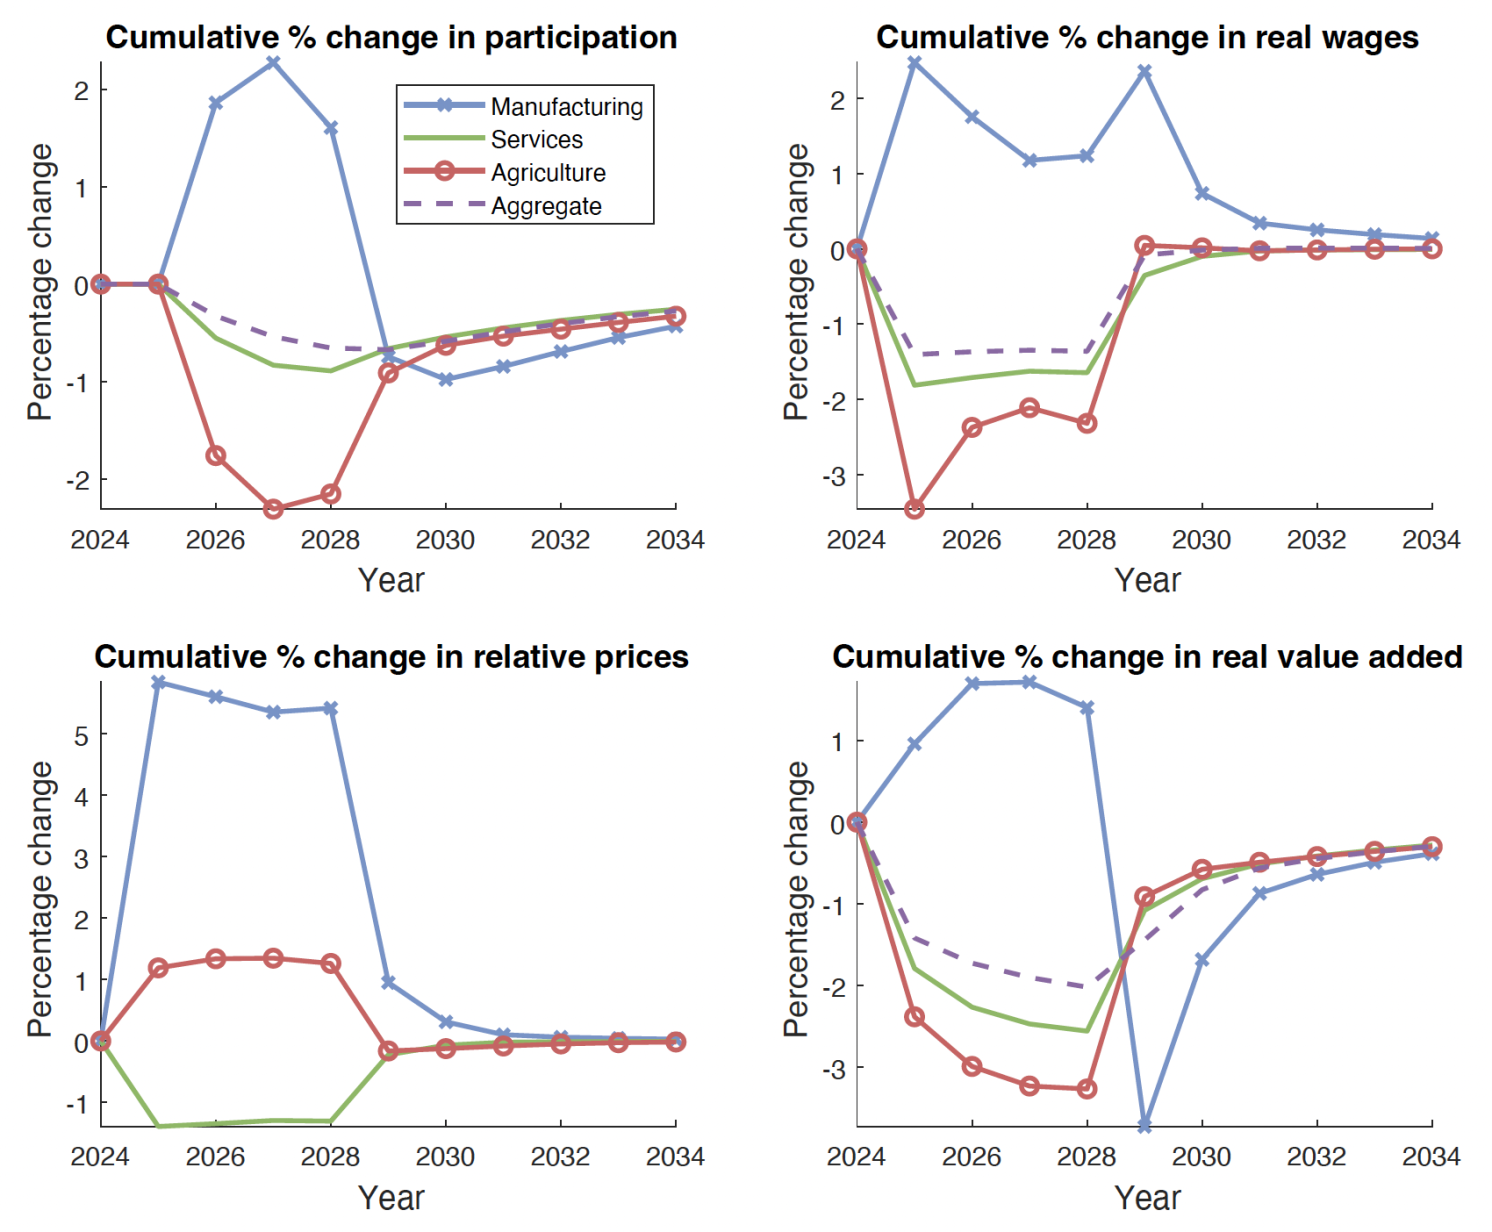
Notes: The cumulative percentage change in (labour supply) since 2024 is in the top left, the cumulative percentage change in real wages is in the top right, the cumulative change in relative prices is in the bottom left, and the cumulative change in real value added is in the bottom right. Manufacturing is the crossed blue line, services is the solid green line, agriculture is the red line with circular markers, and the dashed purple line, the aggregate across sectors.
Figure 2 Paths of relevant variables for the US on aggregate
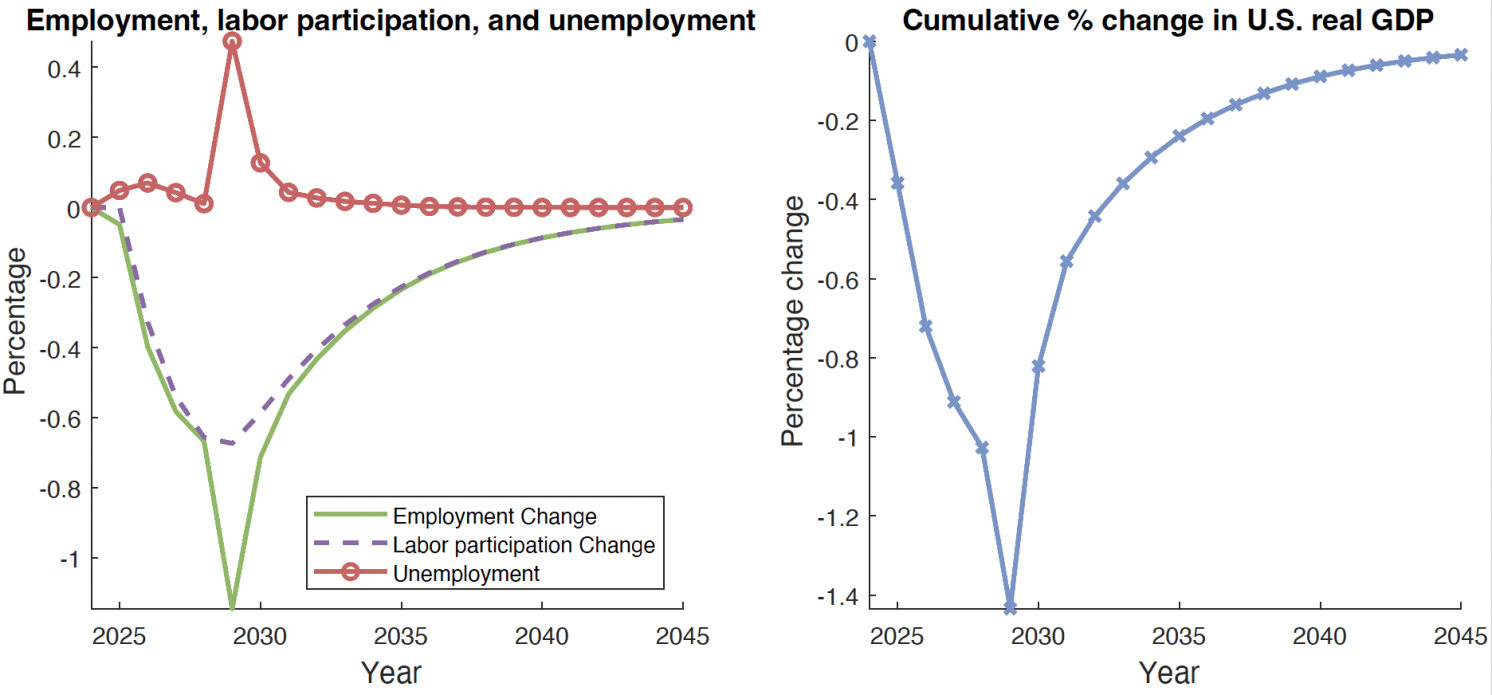
Notes: The left panel displays the cumulative percentage change in employment since 2024 (solid green line), the cumulative percentage change in labour supply since 2024 (dashed purple line), and the level of unemployment in per cent (red line with circular markers). The right panel displays the cumulative percentage change in real GDP (which coincides with real income) for the US on aggregate since 2024. Notice that real GDP is inclusive of tariff revenues. The years in the x-axis go from 2024 until 2045.
Sectoral Reallocation: Manufacturing’s Pyrrhic Victory
The tariffs trigger substantial reallocation across sectors, resulting in markedly different effects on manufacturing, services, and agriculture. In manufacturing, where the US runs substantial trade deficits, there is a temporary surge in employment. At its peak, manufacturing participation increases by over 2% as import protection shifts demand toward domestic producers.
However, employment in the service sector declines as the US – a net exporter of services – faces retaliatory tariffs that lessen foreign demand. Agricultural employment also decreases as farmers deal with increased input costs from tariffs on imported machinery and chemicals, along with reduced export demand from countries retaliating against the US. Falling employment in services and agriculture explains the 1.1% overall employment loss relative to the pre-shock baseline.
The transitional dynamics reveal another insight: when tariffs eventually revert to normal levels, the manufacturing sector faces a painful adjustment. Workers who moved into manufacturing during the protection period suddenly face collapsing demand. As mentioned above, with downward nominal wage rigidity preventing large wage adjustments, manufacturing unemployment increases. Consequently, states that benefited most from manufacturing protection during the tariff period experience the highest unemployment levels when that protection ends.
The Uneven Burden: State-Level Disparities
The overall 1% decline in US real GDP masks significant state-level differences. Our quantification indicates that roughly half of US states experience real income losses, with some exceeding 3%. States with the largest losses – including California, Michigan, and Texas – exhibit common traits: significant exposure to trade with the most impacted countries (particularly Canada, China, and Mexico), due to strong reliance on imported intermediate inputs, and considerable export industries at risk of retaliation.
By contrast, states with lower trade exposure and economies that are more oriented toward domestic markets – including Colorado and Oklahoma – perform relatively better. Some agricultural states that compete with imports (e.g. Nebraska) even see modest gains, although these are more than offset by losses in other regions.
Figure 3 The cumulative change in real income between 2024 and 2028, in per cent, across US states
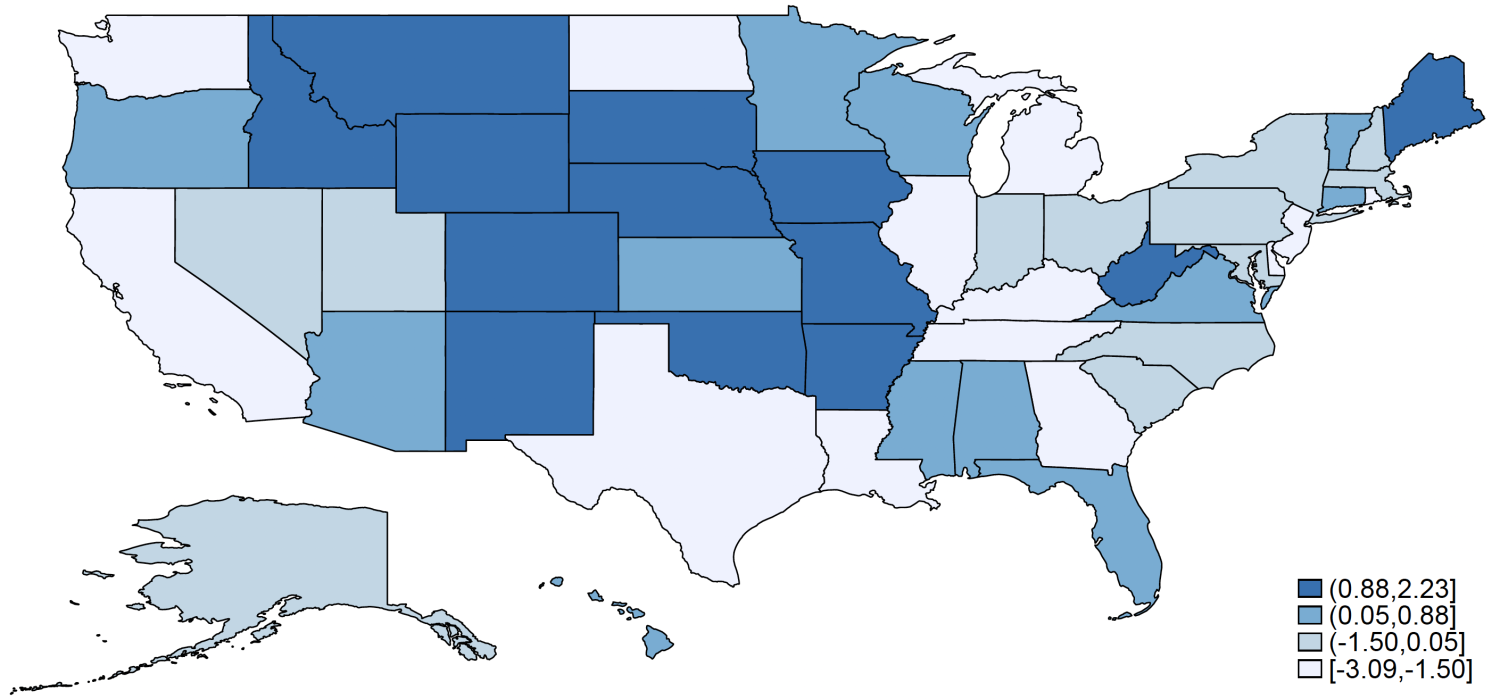
Notes: The darker the shade of blue, the smaller the fall in real income (or the bigger the gain).
Global Repercussions
We also quantify the effect of the trade war on other countries. Not surprisingly, countries that trade more with the US tend to suffer greater losses. For instance, Canada sees a 2% decrease in real income, Mexico faces a 2.7% loss, and Ireland experiences a 3% reduction. These countries endure even more severe impacts than China, which has a 0.5% loss, and the US itself, as they are countries largely exposed to trade with the US and possess a more limited ability to use tariffs to influence the price of their goods and exert market power over their trading partners.
A few countries such as Great Britain and Turkey actually benefit from the trade war. Since they only face the minimum 10% tariff in the US, these countries experience an improvement in their foreign market access, leading to an increase in their terms of trade.
Figure 4 Real income fall by 2028 across countries
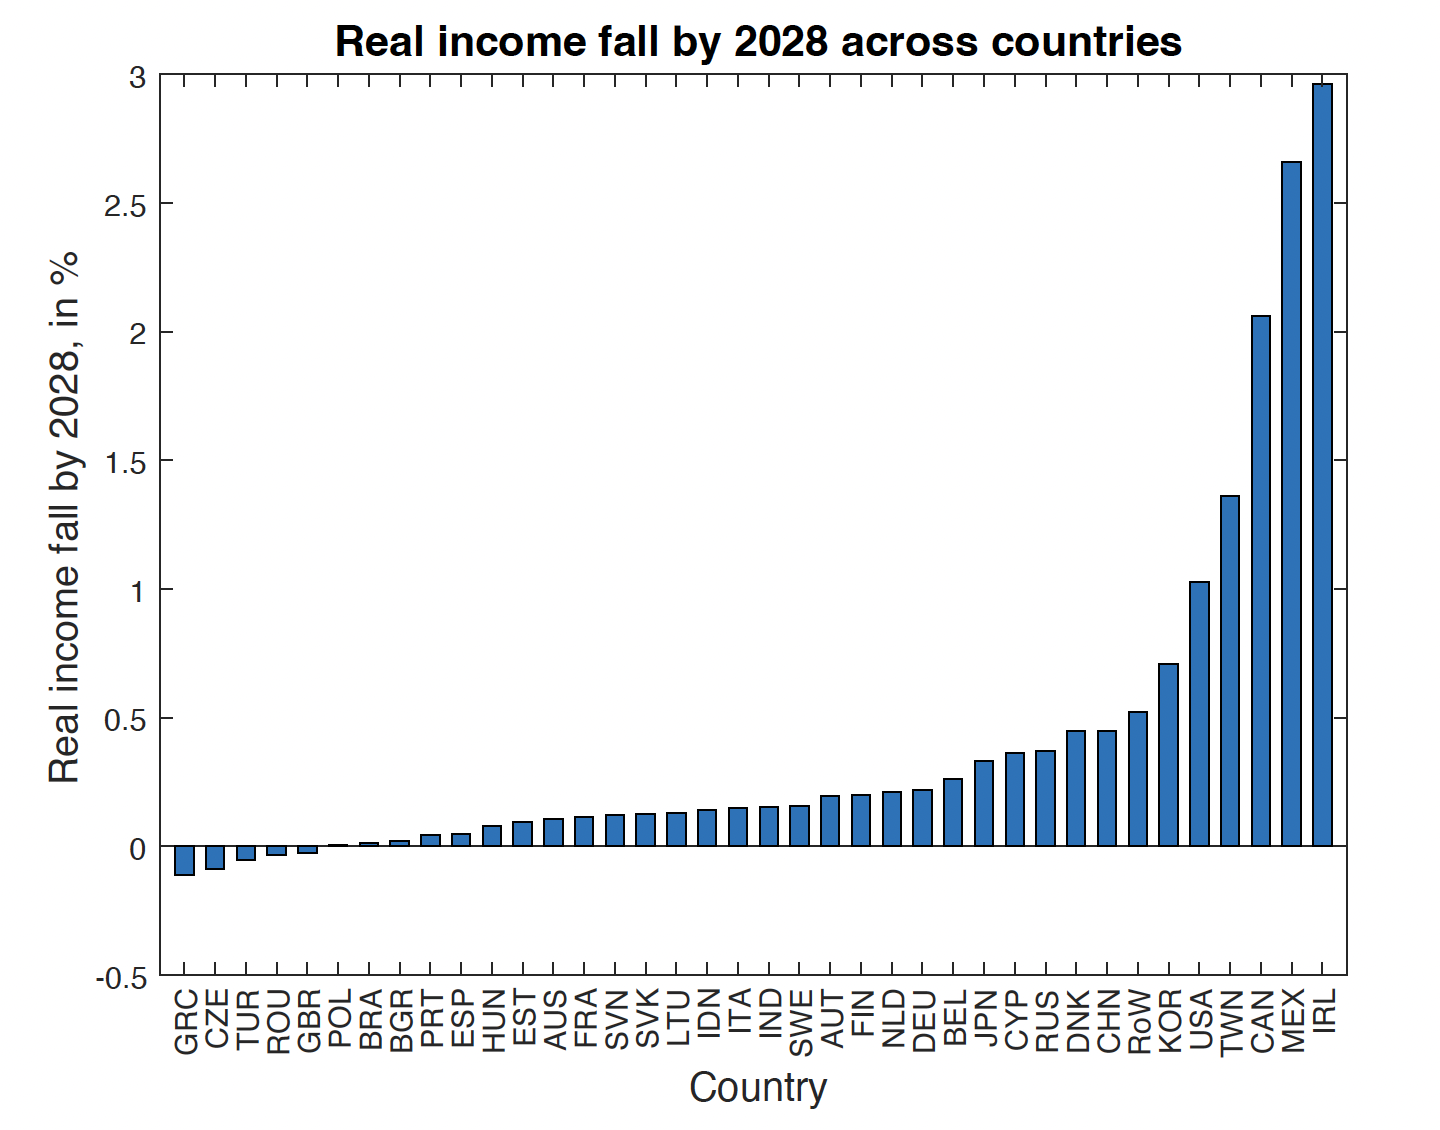
Notes: This figure displays the cumulative real income (which coincides with real GDP) fall by 2028, in per cent, across countries. For country abbreviation codes, see Rodríguez-Clare et al. 2025, Appendix B.1.
Sensitivity to Key Assumptions
Our baseline quantification relies on several key parameters. The most important is the trade elasticity, which governs how easily buyers can substitute between goods. Our baseline assumes a standard elasticity of 5, but there is some disagreement in the literature about the right value to use for this parameter. For example, Boehm et al. (2023) estimate a value closer to 1 for trade elasticity.
The lower the value of trade elasticity, the more relative market power the US has against its smaller trading partners, and the less it suffers from the tariff shock (even if the other countries retaliate). In fact, if the value of this elasticity is low enough (e.g. 0.76), the US as a whole experiences a small aggregate gain of 0.4% in real income from the imposition of tariffs.
The extent of retaliation by trading partners also influences the magnitude of US losses. Our baseline quantification assumes 100% retaliation (where other countries mirror US tariff increases). However, if trading partners do not retaliate at all, US real GDP losses decrease to 0.5%. Interestingly, foreign retaliation has the unexpected benefit of mitigating the boom-bust cycle in manufacturing employment. Without retaliation, manufacturing employment increases more sharply during the protection period, leading to a more severe spike in unemployment when tariffs end – reaching over 1% compared to 0.5% under full retaliation. This occurs because the larger manufacturing boom under no retaliation requires a larger nominal wage adjustment when protection ends, triggering involuntary unemployment due to downward nominal wage rigidity.
Finally, the duration of the trade war also matters in the expected way. Extending the tariffs to 16 years, from 4, increases the cumulative real income losses from 2024 to the last year that the high tariffs are active to 1.8%, from 1%. With more time to adjust and respond to tariff-induced distortions, overall welfare losses become higher.
Limitations and Policy Considerations
We underline three main policy takeaways. First, the employment gains in protected sectors like manufacturing are more than offset by losses in other parts of the economy. Second, there is geographic dispersion in exposure to the shocks and, thus, in the losses that result from them. Third, the unemployment generated when protection ends suggests that temporary tariffs create adjustment costs in both directions. Workers drawn into protected sectors during the tariff period face displacement when protection ends, creating pressure for protection to become permanent.
We also highlight several limitations of our analysis that may lead it to underestimate the short-term negative consequences of the shocks. First, our framework does not capture any effects that may arise from increased uncertainty or heightened geopolitical tensions. Second, the aggregate nature of the model smooths the effects across agents. A more granular model could imply larger and more heterogeneous effects across regions and sectors. Despite these caveats, our quantitative analysis provides valuable insights into how the 2025 tariff shocks could propagate through US states and the global economy.
See original post for references


I would like to know more about the effects across the income and wealth distributions. I wonder, though, whether or not the kinds of models used by the authors are even capable of addressing such a question?
Useful, thank you.i appreciated their discussion of their model and assumptions.
And then drifted off into wondering if the current US administration is using these sorts of analyses or if they are guessing. I believe the story is that there will be massive, widespread economic growth.
It’s still so crazy to me that they’re doing all this to try and return to some imagined era where men all worked in factories and just hit a big girder with a sledgehammer for eight hours a day or something. Pure masculine fantasy nonsense.
Even more insane, the expertise and buildings that housed the factories here in my little town are long gone. Gone are are machine shops that helped keep the factories working. Gone are the factories that made auto harness, and tin cans (for the canneries). Gone are the ship builders, and the other heavy industry. The people with the skills to staff the factories retired long ago. Even the canneries are gone (there might be one left).
It took 100 years to build the industries that were here. A tariff isn’t going to bring it all back over night.
Interesting study of the impact of tariffs on the US economy and states individually.
Here’s some observations on the potential economic impact of ICE raids in SoCal:
https://www.latimes.com/business/story/2025-06-10/how-the-federal-immigration-raids-could-disrupt-californias-economy
That map was very interesting. The deep blue seemed to represent states which are most particularly Republican, whereas the white (the losers in the trade war) seemed to represent states which are most particularly Democrat, like California — although I see that Texas is in for trouble.