Many readers will probably say they don’t trust US economic statistics very much as it is, and as we’ll discuss, there are sound reasons to hold that view. But we’ll soon turn to economist Menzie Chinn explaining how their quality is in the process of taking a further leg down thanks to DOGE spending-whacking and why that matters.
Even in the old days, one could see heavy-handed signs of manipulation. I recall, early in the dot-bomb era, an initial GDP release that depicted growth in the last quarter as 2.2% annualized. I was so offended that I called over a dozen well-networked people to ask if they saw any signs of any growth at all. None did and most had some contractionary sightings.
The final print for that quarter was 0.4%.
Similarly, in the runup to the financial crisis, there were considerable efforts to sell the “Goldilocks” economy (not too hot nor too cold but just right), followed by the “soft landing” thesis. Members of the then-vibrant econoblogosphere would debate the integrity of various new official releases in trying to judge underlying conditions. For instance, from a September 2007 post:
Those who have been following the job creation story weren’t surprised at the weak BLS employment (the so-called “non-farm payroll”) report today, or by the fact that it revised the results for the last three months downward by 81,000. Various commentators (see here, here, and here) have observed that the rises reported in recent months have been due almost entirely to a “voodoo calculation, the “birth/death model” a plug to allow for business creation and failure (one we’ve commented on before). Note this feature was added in 2001.
And where had these jobs supposedly been created? In construction. Need we say more?
Barry Ritholtz offered his latest observation about the birth/death model before the BLS report was released:
Considering how much softer the economy has been much in 2007 than last year, it is simply unconscionable that the B/D model has actually created more jobs in 2007 than it created at this point in 2006.
Year Jan Feb Mar Apr May Jun Jul
2006 -193 116 135 271 211 175 -57
2007 -175 118 128 317 203 156 26
Another favorite topic back then was the rate of inflation. John Williams of ShadowStats has done an admirable job of tracking over time the changes in how various official figures are calculated. Sadly, he does not have an independent data-gathering apparatus, so he has undermined the credibility of his fine historical work by attempting to produce his own alternative measures.
The twiddling with inflation figures has been in no small measure to reduce reported CPI to lower price of living adjustments, such as for Social Security. For instance, in the 1990s, Janet Yellen, then chair of the Council of Economic Advisers, pressed the Bureau of Labor Statistics to implement an inflation measure called chained CPI, which was widely understood to reduce reported inflation and hence Social Security inflation adjustments. The BLS did not implement it with respect to Social Security.
Another hot inflation data topic is hedonic adjustments. The notion is not entirely illegitimate; the question is how it is implemented. The notion is that when things like eggs get expensive, consumers will shift their purchases away from the newly-pricey good to other items. But there is a welfare loss in no longer being able to buy things like affordable eggs which critics contend that the hedonic adjustments don’t adequately reflect.
But there is another hedonic adjustment, not to prices but to output, which bizarrely has and continues to go under the radar. A recap in a 2012 post:
But the most important tidbit is later in the article, and it touches on hedonic adjustments to GDP, a topic that is not often discussed in polite company. We’ve covered this in greater depth before, for instance, in this 2007 post:
Let’s look at GDP. That’s a fundamental figure, surely beyond question or compromise. Really? Our GDP stats include something called a “hedonic price index” basically to allow for the fact that computers are becoming more powerful at lower costs. In essence, the US grosses up the price of computers in its GDP reports to adjust for the fact that computer prices are dropping.
These adjustments are significant. The US is the only country that uses hedonic indexing. The Bundesbank complained that if they calculated GDP the way we did, their GDP growth would be 0.5% higher. And the cumulative distortion is massive. In 2005, Michael Shedlock contacted the Bureau of Economic Advisers and they supplied some dated information on hedonics (including a spreadsheet). Even so, he found that hedonic adjustment to GDP was 2.257 TRILLION dollars, or 22% of then-current GDP.
With that as prelude, you might be tempted to view all economic-related figures as worthless. But that (at least up to now) is as naive as blindly trusting. Many are based on hard transactional data, like the ADP report on payrolls, or large-scale sampling. Others are imputed or derived, which is manipulation or just plain drift from reality can set in.
We’ll turn now to Chinn’s warning and then explain what we are likely to see even more of, which is news reports that rely on anecdata and hype as opposed to reasonably substantiated information. Mind you, we already have too much of that due to corporations and financial touts wanting to stoke optimism and with that, buying. We are entering an era of even fewer reality checks than before.
From Menzie Chinn:
The Commerce Department eliminated two advisory committees on economic statistics gathering (see Marketplace). BLS received some additional funds in March as part of a continuing resolution; however the Trump budget proposal includes an 8% reduction in budget in nominal terms.
The BLS, tasked with compiling the CPI as well as other labor market indicators (employment, wages) has been already stretched by stagnant funding colliding with escalating costs.
Recently, this has affected compilation of the CPI. More and more prices are imputed.
Source: Economist.
Of course, none of this should come as a surprise. A lot of this was prefigured in the Project 2025 (as I documented here).
There’s hardly any money to be saved by slashing in real terms funding for the statistical agencies, so one has to wonder what the underlying philosophy of the Trump administration is.
Perhaps, it’s the philosophy of “if a recession occurs, and it’s not measured, will anybody notice?” Perhaps, given Trump’s assault on the Fed’s independence, my guess is that it’s more likely “if inflation accelerates and inflation is not measured, will anybody notice?”.
In any event, June’s FT-Booth survey of macroeconomists was interesting insofar as no one thought that the Administration’s measures would improve data quality.
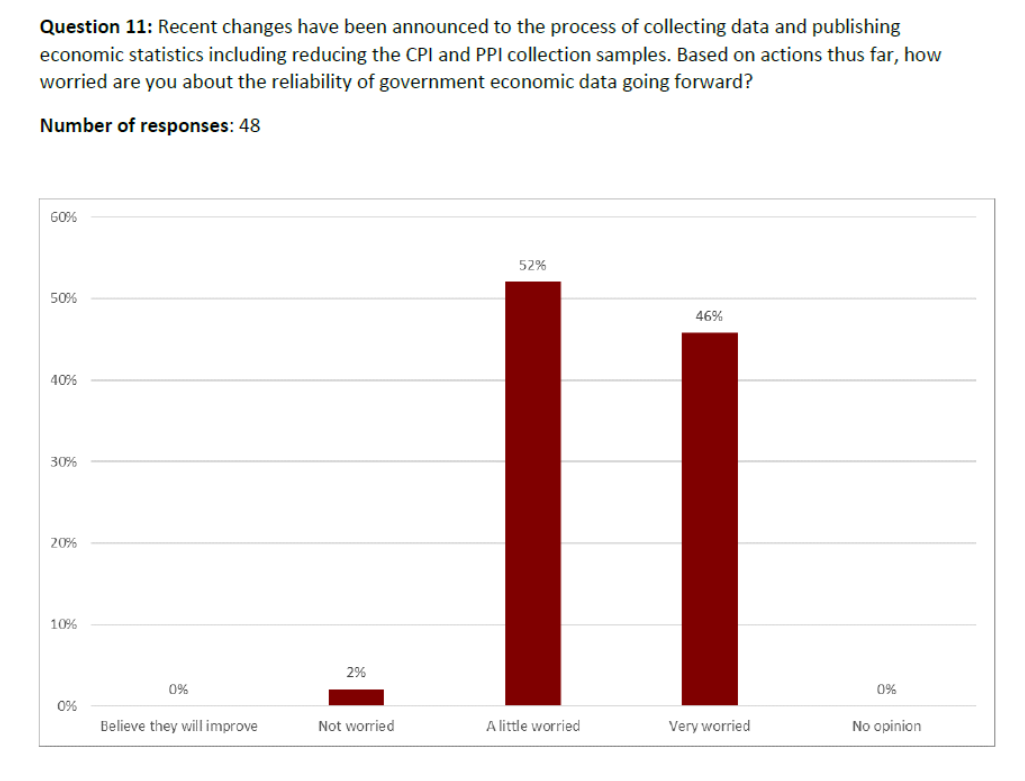
Source: FT-Booth June Survey of Macroeconomists.
I was in the “very worried” category. Apparently, one macroeconomist would not be worried. I think he/she is in denial.

Some examples of why this type of crapification matters.
In the early 1980s, as a wee young thing at McKinsey, I was asked to value a US client’s possible acquisition of a stake in Mexican manufacturer. There was a massive gap between what the buyer and seller thought was a reasonable price.
I went to the Mexico City office to obtain information that would help with a valuation, such as help calibrate the buyer’s assumptions about growth and margins.
Within a couple of days of a week-long visit, I was storming around the office, complaining that there was no data in the entire Mexican economy.1
The consultants in the office agreed. One said, “We do a lot based on feelings.”
In a bit of serendipity, the Wall Street Journal is giving a big dose of what supposed economic stories based on feelings look like. Two days ago, its lead item was The U.S. Economy Is Regaining Its Swagger. The argument at the top of the piece:
Consumer sentiment collapsed. The S&P 500 stock index fell by 19% between February and April. The world held its breath and waited for the bottom to drop out.
But that didn’t happen. Now businesses and consumers are regaining their swagger, and evidence is mounting that those who held back are starting to splurge again.
The stock market is reaching record highs. The University of Michigan’s consumer sentiment index, which tumbled in April to its lowest reading in almost three years, has begun climbing again. Retail sales are up more than economists had forecast, and sky-high inflation hasn’t materialized—at least not yet.
First, given that Trump was elected to a significant degree on a tide of voter upset about high inflation versus lackluster growth does not even remotely amount to “swagger” that can is allegedly being regained.
Second, placing a lot of stock in this stock market is also misguided. Admittedly, as Keynes warned, it can and will stay irrational longer than shorts might remain solvent. For a short form debunking, let us turn the mike over to Ed Zitron, from a wonderful piece we recommended:
The Magnificent 7 stocks — NVIDIA, Microsoft, Alphabet (Google), Apple, Meta, Tesla and Amazon — make up around 35% of the value of the US stock market, and of that, NVIDIA’s market value makes up about 19% of the Magnificent 7. This dominance is also why ordinary people ought to be deeply concerned about the AI bubble. The Magnificent 7 is almost certainly a big part of their retirement plans, even if they’re not directly invested.
Back in May, Yahoo Finance’s Laura Bratton reported that Microsoft (18.9%), Amazon (7.5%), Meta (9.3%), Alphabet (5.6%), and Tesla (0.9%) alone make up 42.4% of NVIDIA’s revenue. The breakdown makes things worse. Meta spends 25% — and Microsoft an alarming 47% — of its capital expenditures on NVIDIA chips, and as Bratton notes, Microsoft also spends money renting servers from CoreWeave, which analyst Gil Luria of D.A.Davidson estimates accounted for $8 billion (more than 6%) of NVIDIA’s revenue in 2024. Luria also estimates that neocloud companies like CoreWeave and Crusoe — that exist only to prove AI compute services — account for as much as 10% of NVIDIA’s revenue.
NVIDIA’s climbing stock value comes from its continued revenue growth. In the last four quarters, NVIDIA has seen year-over-year growth of 101%, 94%, 78% and 69%, and, in the last quarter, a little statistic was carefully brushed under the rug: that NVIDIA missed, though narrowly, on data center revenue. This is exactly what it sounds like — GPUs that are used in servers, rather than gaming consoles and PCs…
NVIDIA’s quarter-over-quarter growth has also become aggressively normal — from 69%, to 59%, to 12%, to 12% again each quarter, which, again, isn’t bad (it’s pretty great!), but when 88% of your revenue is based on one particular line in your earnings, it’s a pretty big concern, at least for me. Look, I’m not a stock analyst, nor am I pretending to be one, so I am keeping this simple:
- NVIDIA relies not only on selling lots of GPUs each quarter, but it must always, always sell more GPUs the next quarter.
- 42% of NVIDIA’s revenue comes from Microsoft, Amazon, Meta, Alphabet and Tesla continuing to buy more GPUs.
- NVIDIA’s value and continued growth is heavily reliant on hyperscaler purchases and continued interest in generative AI.
- The US stock market’s continued health relies, on some level, on five or six companies (it’s unclear how much Apple buys GPU-wise) spending billions of dollars on GPUs from NVIDIA.
- An analysis from portfolio manager Danke Wang from January found that the Magnificent 7 stocks accounted for 47.87% of the Russell 1000 Index’s returns in 2024 (an index fund of the 1000 highest-ranked stocks on FTSE Russell’s index).
In simpler terms, 35% of the US stock market is held up by five or six companies buying GPUs. If NVIDIA’s growth story stumbles, it will reverberate through the rest of the Magnificent 7, making them rely on their own AI trade stories.
And Zitron soon gets to the punch line (in enormous font size:
The Magnificent 7’s AI Story Is Flawed, With $560 Billion of Capex between 2024 and 2025 Leading to $35 billion of Revenue, And No Profit
To put this more simply, the sort of bounce the US is seeing is a reversal of a Trump-induced panic. A colleague who has contacts in many industries dismissed the Journal’s cheery take as “Anecdotes and animal spirits.” And contra the Journal, we’ve had many reports from readers via e-mails and in comments of US businesses seeing big drops in activity, not reversed much of late, and considering or engaging in cutbacks. So which version of the feelings about where things stand to believe?
The very next day, the lead Journal story was more flagrant boosterism. From The Global Economy Is Powering Through a Historic Increase in Tariffs:
The global economy is sailing through this year’s historic increase in tariffs, displaying an unexpected trait: resilience.
Faced with extreme uncertainty, businesses and households have surprised economists with their ability to hedge, finding a short-term path through as they await clarity on where tariffs will end up.
Global producers brought forward purchases and rerouted goods destined for the U.S. through third-party countries that are subject to lower tariffs. For the most part, households and businesses have continued to spend and invest despite the uncertainty, analysts say.
The world economy grew at a 2.4% annual rate in the first half of this year, around its longer-term trend, according to JPMorgan.
Trade volumes are buoyant, stock markets on both sides of the Atlantic have rebounded to record highs and growth forecasts from Europe to Asia are being raised.
Lordie. In January, the IMF predicted global growth for 2025 and 2026 to come in at 3.3%. A mere 2.4% is a big miss, not something to brag about unless you are a market tout serving easily manipulate clients (as in most equity investors).
And the IMF revised its forecasts in April based on Trump’s tariff announcements….and had its new 2025 global forecast at 2.8%! In other words, the world economy is doing worse in the face of the Trump tariff shock, with his high and arbitrary Liberation Day levels, than experts expected. And let us further consider that the IMF had deemed its initial global growth estimate of 3.3% to be lackluster.
Let’s hope this is just a weird episode of the Journal falling in with Trump flattery. But if this sort of thing continues, we’ll know that even the normally somewhat sane financial press (because investors want good information in order to make decisions) has gone all in with late USSR propaganda mode.
____
1 There was actually a smidge. Public companies traded at either two or four times earnings.


“Perhaps, it’s the philosophy of “if a recession occurs, and it’s not measured, will anybody notice?”
Oh, those are just “vibes”…
For another week, my wife is a Principal Economist / researcher at Census. She and way too many of her colleagues are being trumpt. They have always been suspicious of “macro” data – but now even the granular micro data, if used at all on the federal level, will have the same astrology flavor.
Intuitively, since statistics about the economy (and the society) are used to inform decisions by firms and consumers, I presume we could envision the following impacts:
1) If statistics are of poorer quality (less frequent, less accurate, less comprehensive, less detailed), this will enlarge the confidence intervals in economic calculations, hence raise the risk margins, and lead to a retrenchment in investment and spending decisions. In other words, a recessive or even depressive push.
2) If statistics start missing altogether, then this will generate uncertainty — we have no idea about what is happening, vs. risk where we can compute probabilities about events — and this will increase instability, as decisions will be based on personal gut feelings, social moods, or rumours. Probable consequences are more turbulent boom and bust cycles and speculative bubbles.
Has anybody experience (beyond the anecdote by Yves above) working in countries with either really poor stats, or altogether missing stats who could jibe in about the effect of such a situation compared with countries with properly working statistical agencies?
And what do the DOGE / MAGA / Trump / Musk blokes think they are achieving with such moves? Ever since Trump took the helm (again), I have been getting increasingly baffled: if there is a plan, it is totally unscrutable to me.
About that #2:
“If statistics start missing altogether, then this will generate uncertainty — we have no idea about what is happening, vs. risk where we can compute probabilities about events — and this will increase instability, as decisions will be based on personal gut feelings, social moods, or rumours. Probable consequences are more turbulent boom and bust cycles and speculative bubbles.”
There’s bailout after bailout (though they get rebranded at times) and already the there has been discussion of the “everything bubble”.
What if there is no “if” to it?
We had a mild version of #1 in the 1970s due to inflation being high enough that it made it difficult to make sense of financial statements, particularly since it was a manufacturing economy and so the capital base was at historical rates and depreciation almost certainly understated the level of reinvestment needed just to stay in place. Whether you chose LIFO or FIFO for inventories made a difference in profit levels.
So since no one had much confidence that the financial statements reflected underlying economics and as a result, that reported profit were accurate, stock prices and capital investment level levels fell. Admittedly, discounting future cash flows at high rates arguably played an even bigger role, but it was hard to have much confidence in projections since you didn’t have much faith in the historical results.
The core of the lies has always been and remains the inflation rate, in a financialised economy depending on new credit creation to survive. I am a big fan of Tim Morgan and his Realised Rate of Comprehensive Inflation, this is tracking just below 6 % for the 2020’s in the US, which puts real growth just above zero. So running as fast as possible on the credit wheel to keep heads above water, which matches a lot of peoples lived experience. Financial repression is a thing and the returns on your financial assets are not what you think.
My sincere thanks for the reference to Morgan, who I hadn’t seen before. I just read his most recent post, #307: Robert’s paradigm THE POLITICS OF ECONOMIC CONTRACTION. As a macroeconomic newbie ever-struggling to wrap my aging brain around these concepts, I found it highly readable and illuminating.
When I woke up and realized things like , ‘volatile food and energy ‘ were stripped from the data, I started to look for alternative data and behaviors I could observe in the first-person. Who needs food and energy?
To mangle Reagan, I distrust, and verify…
Things like oil rig count, or the composition and volume of ‘orders’ at local title insurance companies, are telling. Grocery prices – staples — are useless– provoking eye-watering and seeing red…
And I want access to the gas station where Trump fills his Helicopters, golf carts and Limo’s.
He must get a ‘pro-deal’? Or, as one wag in the rag trade put it, “Only a Gentile Pays Full Retail” **
**I am not an anti-Semite- don’t play one on TV. I’m not nuts about Israel, but let’s not conflate the two…
Merely repeating a funny line from a dirt-bag Jewish rag trader…
Potemkin statistics, part 1984, the labor market.
When there has been a pattern over the past several years of so many downward revisions, maybe that is another signal to rethink the processes.
Hundreds of thousands of prior reported jobs just vanishing upon revision?
Or their ugly cousin, the eventual growth coming predominantly from government hiring?
As with other stories, those disappear
down the memory holefrom the news cycle when the next crisis or panic or whatever happens to appear.SQUIRREL!!!!
As a big holder of NVDA, the meteoric rise of the stock has been quite a spectacle. A couple of times when I thought it was going to pull back, I sold off a bit, but I have been wrong to do so thus far.
My day job is as a stock analyst (though I’m trained as a scientist) but I’m forbidden to trade in my sector (biotech/healthcare). Most of my single-name investments are in semiconductors. I sat next to the semiconductor analyst in my old shop and we talked about NVDA a lot.
What is interesting about NVDA is that the stock is actually not super overvalued based on conventional valuation. Our internal model put the price of NVDA at around $150 in early Feb when the stock was trading at $100-ish. Even if we were to give NVDA a 50% recenue haircut in 4-5 years assuming a major slowdown in growth, the stock was still valued at soemthing like $130. Its trading around $160-$170 now which puts it much closer to reality than many stocks.
The concentration risk is definitely a concern, but for now, NVDA is so far ahead of the competition that there aren’t any real alternatives. The capital expenditures required to design and manufacture chips is enormous. Investors are far more interested in doubling down on NVDA dominance than trying to finance an upstart that would require billions of capital just to enter the market, and with the rapid pace of development in semis, by the time they build out and get to market, the tech is already outdated.
Semis are a cyclical industry and there is no doubt that NVDA will pull back a bit when there is a downturn, but I fail to see how they do not remain the dominant semi company going into the future and despite my increasing nervousness as it becomes a larger and larger portion of my portfolio, I see nothing on the horizon that would make we want to sell.
Nvidia will go the way of Nokia. A few billion to invest in semiconductors is nothing to a state like China and they will certainly blow the competition out of the water in the next decade or two. They have massive amounts of resources and are steadily advancing in all tech areas. If they decide to end Nvidia, Nvidia will end. In more than a decade of reading this blog all I see is the inexorable rise of the East and the mirroring decline of the West. We are looking at a reversal of the roles of China and the West in the 19th Century. The only question now is, how low are we going to fall?
A few billion as you say, will be woefully insufficient to challenge NVDA. Hundreds of billions (perhaps over a trillion) would be needed just to take a shot at them, and the chances of success, for reasons I outlined above, are no where near assured even after spending that money.
Are not these valuations predicated on continuing purchases of GPUs in ever greater quantities?
There are no profitable LLM-based products or services, and none on the horizon. The technology is a mirage.
What happens when buyers of Nvidia GPUs no longer have reason to purchase GPUs?
A trillion dollars equivalent worth of resources is trivial for a state the size of China.
Absolutely. I agree.
Nvidia’s moat, in addition to the enormous resources to create those chips, is CUDA. CUDA is the programming interface to harness the full power of NVIDIA’s processors. Switching to another interface has a lot of friction, nor are the alternatives as mature. Possibly Apple and their proprietary processors, but those are for a different market.
I feel Nvidia is closer to Qualcomm than Nokia (either handset or infrastructure). For the record, I worked at Nokia’s infrastructure side, after it acquired Alcatel-Lucent. In wireless telecom, Chinese competitors were able to hire large numbers of experienced people to bootstrap their industry, most famously with Nortel.
As far as I understand, Nvidia’s success lies in the immense building out of data centers for LLMs. When the AI bubble bursts..and it will burst at some point, Nvidia will crash and burn, since the bulk of their GPU market is based on the construction of these AI data centers.
I agree, eventually people will wake up to the AI Bubble. It’s a bigger bubble than most realize right now.
I just finished reading a book recommended by Ed Zitron a few months ago called The Myth of Artificial Intelligence by Erik Larson. As people come to realize that the hype doesn’t match the known science things will change for The Magnificent Seven, and not good changes.
Assuming a 50% haircut in 4-5 years? That’s in effect also assuming business as normal. From the Zitron article, something like 88% of their revenue is now high end GPUs for AI (“datacenter” in their financials). If and when the bubble pops, “AI” companies will be kryptonite, all that CapEx goes to zero, and all that installed CapEx will sit around in dark datacenters, waiting for someone to come along and buy compute at fire sale prices, so who is going to be purchasing *more* datacenter GPUs? Remember SUN? What happened after the dot com crash, when all those servers were sitting around dark? What happens to your NVDA model when revenue goes from $45B to $5B?
Where are NVIDIA factories located?
Do NVIDIA has a vertically integrated product process, from design to materials, to production?
What could go wrong?
Google is primarily using custom designed TPUs (reflected in them being a relatively small share of Nvidia revenue).
Amazon and Tesla/Musk also have some custom chips but not to such a large extent.
Also China but that’s more complicated.
Doesn’t exactly mean that Nvidia is in trouble, but their ability to extract 80%+ margins in the long term is doubtful.
Given how they’ve been reducing funding at the NOAA and slashing anything climate related, it seems more to be “There is no problem (that affects us and who we care about significantly) to begin with, so why are we even measuring it?” For Trump’s administration and his base, the stock market and GDP numbers are a sufficient barometer of economic performance and “winning,” so why even bother with pesky things like tracking Giffen good prices and consumption levels to broaden an understanding of inflation and its effects for larger consumer demographers?
Much like the national debt/deficit, now that team Trump is in charge, inflation isn’t actually a problem anymore for the people they care about. Even if collected statistics were beneficial/flattering to Trump, such facts wouldn’t matter because his base’s focus isn’t on those statistics but on other indicators and vibes/feelings.
“There lies, damn lies and statistics”
I don’t recall who to attribute this to, but I 1st heard it in Econ. 101.
Mark Twain, IIRC.
Mark Twain used it, attributed to Disraeli
But true origin is not clear…
I’ll add one more…assume on an island there live two farmers. # 1 grows pineapples and # 2 grows coconuts…and voila a trade economy is birthed from nothingness! My business professor in college often used a simple business example for Cost Accounting, a theoretical widget maker.
I think it was either Truman, or possibly Eisenhower, who often chimed up to request a real one armed economist. Given the typical or rational thought of most trained economists to suggest…” yet on the other hand…”
I thought this growth of average retail spending chart was interesting.
Figure 3. Growth of average retail spending overall and decomposed by household income (seasonally-adjusted and inflation-adjusted)
Middle and high were 13.3% and 16.7% respectively, with low at 7.9%.
But what I was looking for is this, from Marketplace.
I think until the top 10% slow their spending, this train keeps running on time. Or perhaps a substantial number of the bottom 90% need to get seriously whacked financially. What kind of shock would cause that? The jury is still out on what becomes of tariffs and their effects.
Assuming that the Trump administration won’t simply generate bogus numbers, (Big assumption) there is another issue, seasonal adjustments.
I think that there have been significant changes to the economy, society, and workforce as a result of various Covid related issues, and I do not think that adjustments have been made for this.