Reader Carl about ten days ago had sent me a link to a Federal Reserve data series “Aggregate Reserves of Depositary Institutions Adjusted for Reserve Requirements.” The series goes back to 1975.
What caught Carl’s attention was that the “”non-borrowed reserves” column, under the “not seasonally adjusted” heading, to the right, shows negative values for the last two weeks in January. While the seasonally adjusted non borrowed reserves figures posted are positive, they are so weakly positive as to also be troubling.
This table is cumbersome to read because it contains over 30 years of data and the headings are only at the very top, so I am providing the headers and the most recent data (as of Jan. 24) for December and January to date. Click on them to enlarge. However, you might find it easier to view them at the source.


I would have made noise about it at the time, but I don’t normally look at this series, and although the lack of apparent reserves looks quite alarming, it appears to be the result of the operation of the Term Action Facility, which allows banks to post collateral with the Fed and borrow funds for a month (the rate is determined via auction, hence the name). Although some readers quibble with my characterization, I view it as a discount window without the stigma (the participants remain anonymous).
There might have been some technical reason for the numbers looking as bad as they did (and still do) so I was (contrary to usual form) reluctant to stick my neck out. However, if you take the data at face value. the implication is that banks are leaning heavily on the Fed, and if this isn’t opportunistic, this would appear to be a very bad sign.
For a frame of reference, just go to the data series and quickly scroll back. There is nothing like this result anywhere in history, not during the Volcker credit crunch, the 1987 crash, the emerging markets and later LTCM crisis, or 9/11. The negative reserves have no historical parallel, nor do the adjusted reserves dropping so close to zero.
Note also there was a very big ratchet down the two weeks before the big fall in the last two weeks. The seasonally adjusted reserves fell to less than a quarter of their former level, and again, the absolute value being that low in unprecedented.
Michael Shedlock (hat tip reader Owen) jumped on this today, via a chart from the St. Louis Fed:
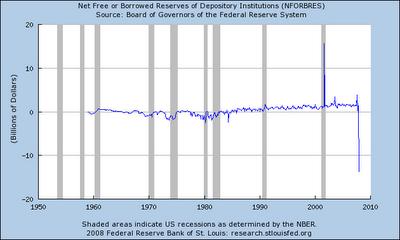
The problem is I am not certain how much of this is due to real stress as opposed to banks taking advantage of a free lunch, since the TAF is giving out one-month loans at 3.123%. at the Jan. 29 auction. That’s less than interbank rates, and you get to post terrible collateral too. Everyone with an operating brain cell should be taking as much of this dough as they can, and they clearly are.
But having now created dependence on unduly cheap money, and getting an unprecedented and (at least to me, Shedlock, and concerned readers) scary chart, how is the Fed going to wean the banks off the TAF? And if we have another credit seize up despite the TAF, one can only expect the Fed will crank up the level of funding on offer.
The non-borrowed reserves dropping in the last two weeks seems inconsistent with the pace of the credit crisis. Recall that the the TED spread, the gap between short-term bank borrowing rates and Treasuries rose sharply and by November had hit levels that were troubling, indicative of banks’ reluctance to lend to each other. An initial joint operation by central bankers did not break the logjam; a big liquidity operation by the ECB, plus the TAF, did.
The factor making the tightness in bank funding markets worse was that liquidity routinely goes way down at year end (banks cut down on trading to tidy up their books). That pattern was kicking in even earlier than usual in an already-tight credit market. So you would have expected to see the negative reserves pattern (if ever) prior to year end, when the funding needs would be acute and the TAF would be a particularly important source of funding. Why are we seeing this change now, in later January?
For those who want to ponder this matter further, Shedlock was also good enough to provide a backgrounder on borrowed reserves from the book Investing Public Funds by Girard Miller:
Another useful indicator of the Federal Reserve’s relative monetary policies can be found weekly in the Federal Reserve data. A key statistic is the net free reserves or net borrowed reserves line item. This statistic measures the degree to which depository institutions have found it necessary to obtain funds in the Fed Funds market and through the Fed discount window in order to obtain required reserves.
During periods of central bank credit-tightening operations, the depository sector might find it necessary to borrow funds to meet reserve requirements. This practice results in net borrowed reserves, which shows as a negative number. Conversely, if ample funds are available through the banking system to meet reserve requirements, banks can become net lenders of reserves through the Fed Funds markets.
Rational agents respond to incentives, and the incentive is to take all the TAF dough you can. But the fact that total reserves also dropped during this period also lends credence to the idea that this dramatic drop in non-borrowed reserves is decidely Not a Good Thing.


Yves:
Live Search cached this page on 1/11/2008. Hope this helps.
Will,
Thanks for trying to help, but even though it ought to be similar data, it isn’t the same table. The pointer came from someone who had seen it in the comments to a post at Calculated Risk, and the e-mail to me was Jan 20, which means it was using Jan 10 data. It showed negative values, which even your cached version doesn’t and I am certain it showed negative valued in the column for reserves as well unadjusted reserves. What I recall less clearly is when the negative values started, but I also recall it being for more than one week, which means it also would have started earlier.
I not at all sure what importance to give to this. Banks have to hold reserves for sure – at the local Fed reserve bank or as vault cash.
http://www.frbsf.org/education/activities/drecon/answerxml.cfm?selectedurl=/2001/0111.html
This is just showing the source of the reserves – all it seems to show is that the banks found it profitable to borrow via the TAF and put it straight back at the local Fed to satisfy the reserves requirement and, I suppose, put the money they used to keep there (the non-borrowed reserves )to good use elsewhere.
Why would they do that ? The TAF is only 30 day money so I suppose you can’t do much with it anyway; the interest charged for it would be problematic but presumably they make more than the Fed interest charged on the TAF money by lending out the previous non-borrowed reserves that are now freed up. That supposes of course there is a demand for that money. Seeing how the interest in and interest on TAF is declining looks like it is dwindling !
At least this is how I’m seeing this – unless of course somebody corrects me.
-K
Yves,
Thanks for the post, I did write down the amounts for the adjusted reserves that I had originally observed on the Federal Reserves’ site as human memory is stubbornly unreliable. Actually the adjusted reserves have been altered downward from an even 200m to 199m, so I don’t actually think there has been an attempt to hide the figures. It was the negative number in the unadjusted reserves that shocked me and prompted me to write you.
Since I sent you that email I have learned somewhat more about what has occurred but I want to stress that my understanding of the workings of the Fed are rather rudimentary. It does appear that the TAF was used to lend the reserves (about 40Bn) to banks in need (and maybe somewhat to banks that took advantage of the low rate) in an effort to break the credit crunch. That effort was at least partly successful in restoring some of the commercial paper trade between the banks. It was also successful in avoiding serious liquidity problems in individual banks that took advantage of the TAF system. I’m pretty amazed that the Fed managed this in the space of a couple of weeks. Quite a feat in my opinion and worthy of a well done to the Governors and employees of that fine institution. In essence, I think that the action of the Fed has averted a number of bank failures. I could, of course, be wrong about all of this, as I said my understanding of the Fed’s inner workings is incomplete.
The banks of course are still in trouble whether they know it or not as they have gone into capital preservation mode and that is going to seriously reduce future earnings due to great reductions in lending activity. The Fed has it’s work cut out for it, again in my humble opinion.
Thanks for looking into this and I will continue to try to make sense of this peculiar point in the economic history of the United States as I am sure you will and will keep in touch.
Is it possible this is just a mechanism to dump bad collateral as a short term window dressing opportunity? Its almost like a money laundering operation that is absorbing toxic waste.
Yves,
Found this link on Mish’s site:
http://www.federalreserve.gov/releases/h3/Current/
Here you will find that negative number you were looking for in the nonborrowed reserves.
Re :What caught Carl’s attention was that the “”non-borrowed reserves” column, under the “not seasonally adjusted” heading, to the right, shows negative values for the last two weeks in January. While the seasonally adjusted non borrowed reserves figures posted are positive, they are so weakly positive as to also be troubling.
Note also there was a very big ratchet down the two weeks before the big fall in the last two weeks. The seasonally adjusted reserves fell to less than a quarter of their former level, and again, the absolute value being that low in unprecedented.
>>>Have any of you looked at The Slosh report in regard to this?
http://www.gmtfo.com/reporeader/OMOps.aspx
You can run reports to look at slosh, which is entertaining, like watching witch doctors toss chicken bones into pots of boiling goo. The MBS sloshing is always interesting!
Just a few reactions, which are probably dumb, but there is an interesting change from 1 year ago in regard to Treasury sloshing, agency sloshing and MBS sloshing;
1. Treasury sloshing has dropped from 18.8 to 3.5, Agency slosh has increased from 2.3 to 8.75 and MBS slosh a year ago was 0.2 and now around 20.69.
Now, why would that be, perhaps because rates are going down and maybe something to do with too many MBS chasing too few Treasuries?
Help Im lost, we need more vodka
Here is a link that may offer more on slosh: http://markets.studentofthetao.com/2007/12/why-fed-auctions-are-not-inflationary.html
Friday, December 21, 2007
Why Fed auctions are not inflationary
Independent accountant has argued in comments that the Fed’s auctions are inflationary. I don’t agree.
Even as the Fed injects liquidity via the auction it has used open market operations to remove a countervailing amount from the money supply. The Slosh report is the easiest way to see what is going on with open market operations. (Alternatively you can go to the NY Fed website and construct the numbers yourself.) As you can see on December 20, the same day that the first auction amount was injected more than $23 billion was removed by failing to replace maturing open market transactions.
Furthermore, the Fed has announced that on December 27, when the second auction enters the system, it will allow $14 billion in Treasuries to mature without replacement. Presumably this means that the Fed will not have to effect a $20 billion open market withdrawal on the same day.
We can all agree that lowering the Federal Funds Rate dramatically is an inflationary action. But as long as the Fed is providing liquidity to the banking system without allowing the FFR to drop significantly, the Fed’s liquidity provision is not inflationary.
This whole thing is of very little importance.
We know that the TAF is designed to target reserves toward those who need it. It’s an extension of the discount window. We also know that the collateral is the same as acceptable discount window collateral.
The amounts involved here are tiny in comparison to the balance sheet size of the banking system.
The reserve setting is a discipline that facilitates the Fed’s targeting of the fed effective rate. The amounts involved normally are tiny anyway.
TAF is genius. Remember that most banks no longer face binding statutory reserve requirements — increasing amounts of vault cash (including ATM networks) plus retail deposit sweep programs have wiped aside such binding requirements.
A further advantage of the auction facility is the liberal rules regarding the types of assets that the discount window folks will accept as collateral — including certain CDOs.
Such securities are not purchased by the Open Market Desk as it supplies non-borrowed reserves.
The difference in the type of securities that the Fed will accept at the Window and at the Desk perhaps answers which choice banks make.
As of August 2008 the Non-Borrowed Reserves are now -150 Billions.
Patrick
http://www.InvestorKnowledgebase.org
Has anyone seen the numbers lately? It was down to -80b last week. Is this due to the bailout?