Yves here. We pointed out the unprecedentedly low share of GDP growth going to labor in 2005.
By Pavlina R. Tcherneva, Associate Professor of Economics, Bard College. Originally published at New Economic Perspectives
Growth in the US increasingly brings income inequality. A striking deterioration in this trend has occurred since the 80s, when economic recoveries delivered the vast majority of income growth to the wealthiest US households. This note updates my original inequality chart (reproduced below) with the latest data. For earlier discussions, see e.g., here, here, and here.
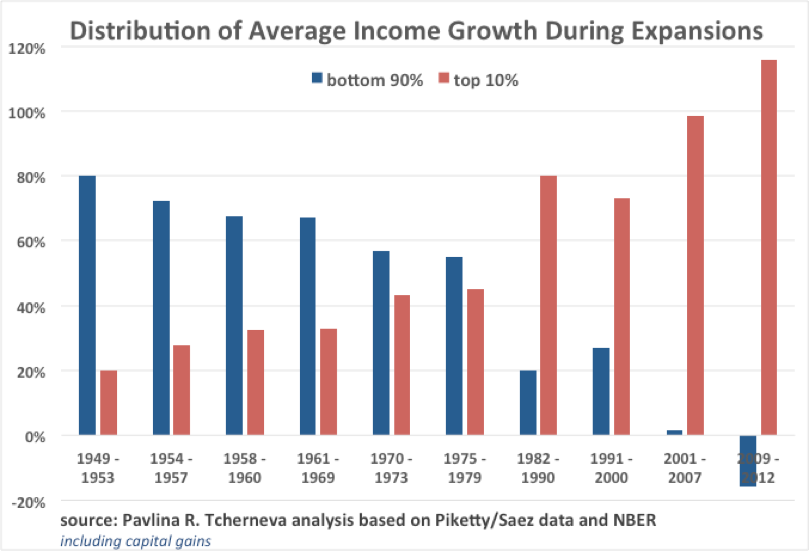
Figure 1: bottom 90% vs. top 10%, 1949-2012 expansions (incl. capital gains)
The chart illustrates that with every postwar expansion, as the economy grew, the bottom 90% of households received a smaller and smaller share of that growth. Even though their share was falling, the majority of families still captured the majority of the income growth until the 70s. Starting in the 80s, the trend reverses sharply: as the economy recovers from recessions, the lion’s share of income growth goes to the wealthiest 10% of families. Notably, the entire 2001-2007 recovery produced almost no income growth for the bottom 90% of households and, in the first years of recovery since the 2008 Great Financial Crisis, their incomes kept falling during the expansion, delivering all benefits from growth to the wealthiest 10%. A similar trend is observed when one considers the bottom 99% and top 1% percent of households (for details, as well as complete business cycle data, see here).
The following figures update this analysis with the latest data (up to 2015) by looking at the distribution of average income growth (with and without capital gains) between the bottom 90% and top 10% of households, and between the bottom 99% and top 1% of households.[1]
We find that little has changed when considering the distribution of average income growth between the bottom 90% and top 10% of families, with or without capital gains (figures 2 and 3, respectively).
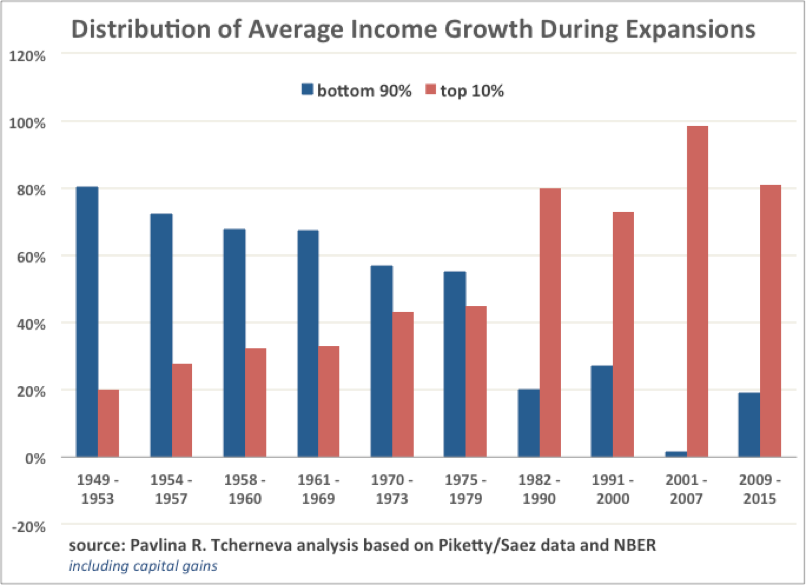
Figure 2: bottom 90% vs. top 10%, 1949-2015 expansions (incl. capital gains)
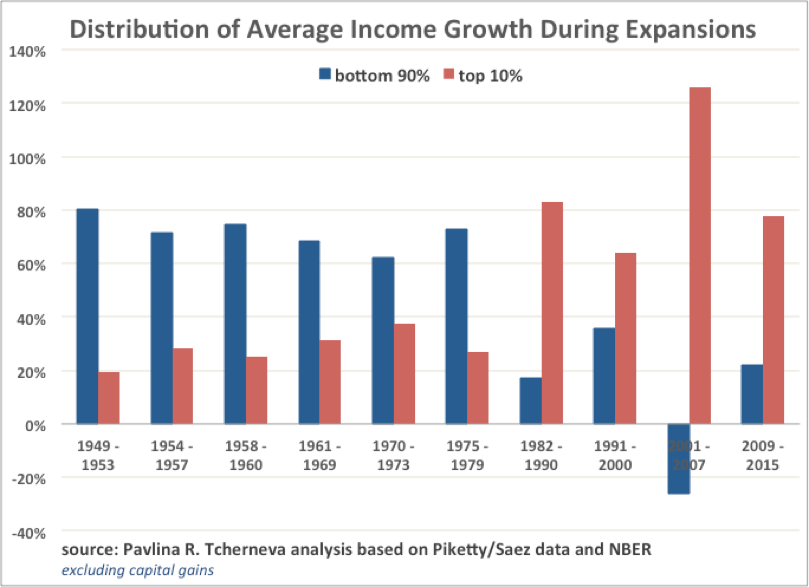
Figure 3: bottom 90% vs. top 10%, 1949-2015 expansions (excl. capital gains)
One difference is that average real income for the bottom 90% of households is no longer shrinking. In 2014 and 2015 it finally began to recover. Nevertheless, these families still capture a historically small proportion of that growth—only between 18%-22%. The growing economy continues to deliver most benefits to the wealthiest families.
Since the top 10% of households is a rather heterogeneous group (see table 1), we consider the distribution of average income growth between the bottom 99% and top 1% (Figures 4 and 5).
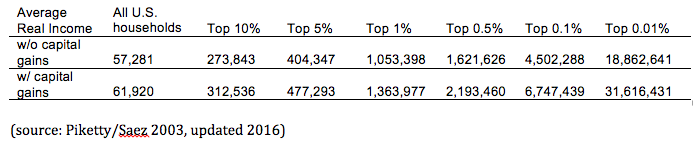
Table 1
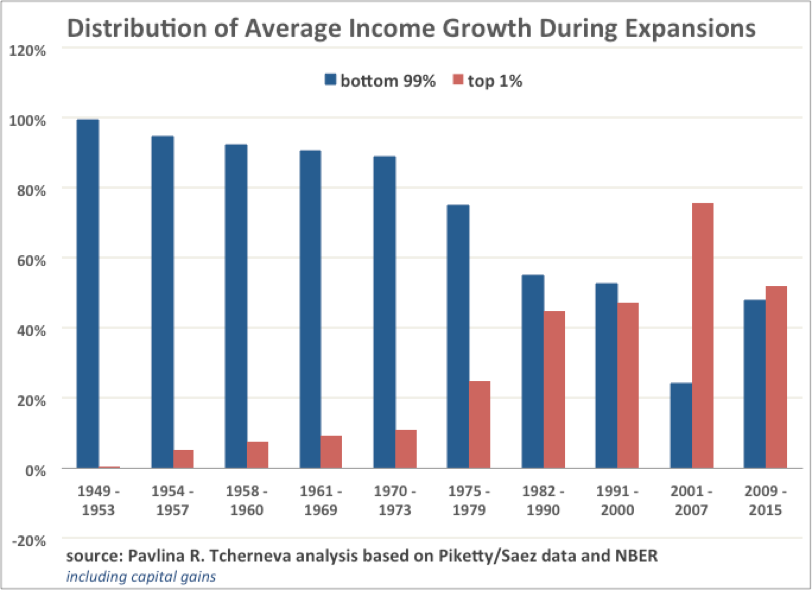
Figure 4: bottom 99% vs. top 1%, 1949-2015 expansions (incl. capital gains)
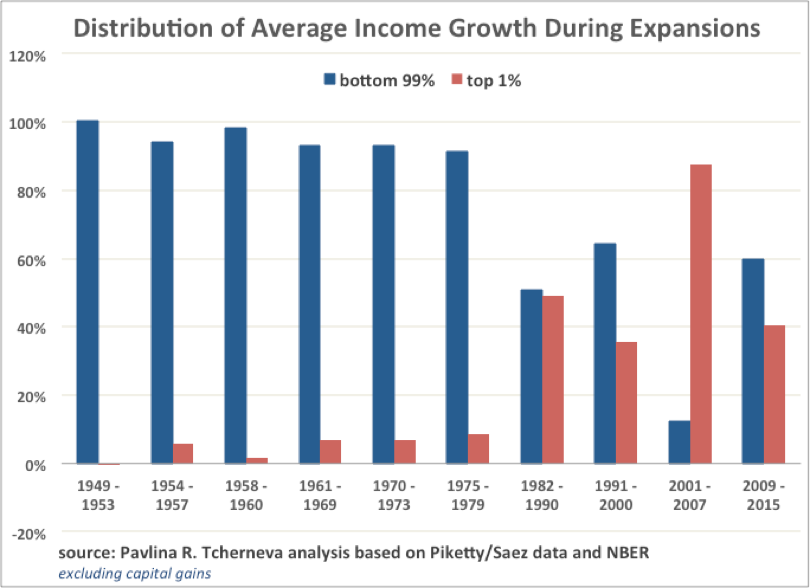
Figure 5: bottom 99% vs. top 1%, 1949-2015 expansions (excl. capital gains)
Figures 4 and 5 show that incomes of the bottom 99% (with or without capital gains) have recovered more robustly than those of the bottom 90% (Figures 2 and 3), meaning that the improvements are primarily concentrated in the next richest 9% of families. Their share of income growth is either 30% or 38%, depending on whether or not one includes capital gains, respectively.
Finally, Figure 6 shows how income growth has been distributed over the different business cycles (peak to peak, i.e., including both contractions and expansions). The data for the latest cycle is incomplete, as we are still in it. The graph indicates that in the current cycle, incomes for all groups are still lower than their previous peak in 2007, however the loss is disproportionately borne by the bottom 90% of households.
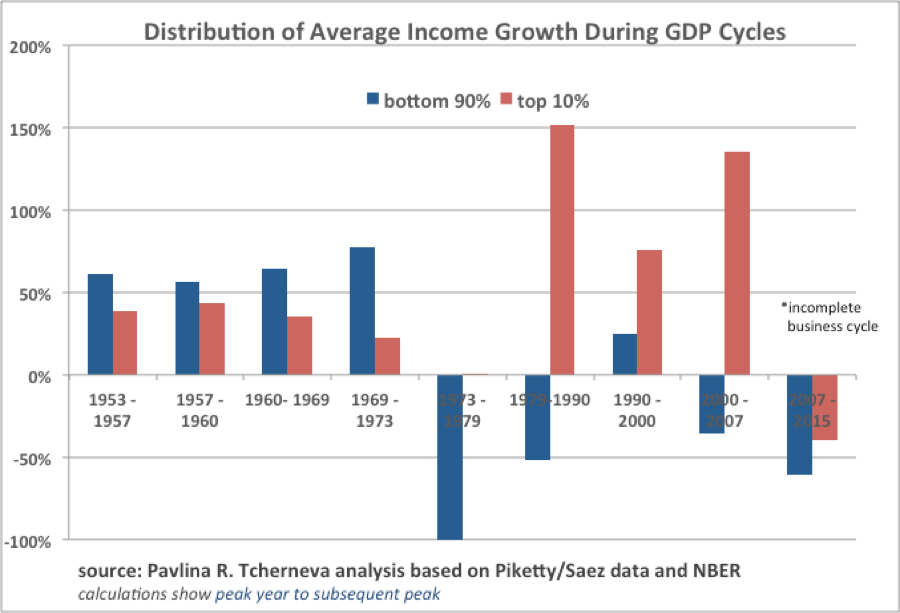
Figure 6: bottom 90% vs. top 10%, 1953-2015 business cycles, (incl. capital gains)
In sum, the growth pattern that emerged in the 80s and delivered increasing income inequality is alive and well. The rising tide no longer lifts most boats. Instead the majority of gains go to a very small segment of the population.
As I have discussed elsewhere, this growth pattern is neither accidental nor unavoidable. It is largely a bi-product of policy design, specifically the shift in macroeconomic methods used to stabilize an unstable economy and stimulate economic growth.
__________
[1] The analysis is based on Piketty and Saez data (2003, updated 2016), which report real average market income before taxes and transfers. Market income includes wages and salaries, entrepreneurial income, dividends, interest income and capital gains.


“A striking deterioration in this trend has occurred since the 80s, when economic recoveries delivered the vast majority of income growth to the wealthiest US households. ”
And yet, the solution to our economic problem is said to be “growth.” – can policy makers truly be that stupid, or is it viewed not as a bug but as a feature? Rhetorical question – the professional yammerers job is to deflect attention from inequality and the rich getting richer.
Growth only counts when it goes to “makers”, which is why Republicans are about to give them a huge tax cut. See also Reagan, Ronald and trickle down (yes, but what’s trickling).
It’s brown and sticky and it ain’t a stick sadly.
Very interesting data, and nice to see different cutoffs being used.
But it would be great if each chart was organized by
the bottom 90%, next 9%, next .9%, next .09% and then the top .01%,
normalized per capita in each band.
That might both help convince the haters of the “top 10% credentialed class”
that (many of) the 10% are not the villains of this story,
and be useful in trying to convince some of the 10% that their class interests point downward, not upward.
Nope.
The top 10% are still driving asset prices for things like housing and health care out of the reach of the 90% below them.
Count me as one of the “top 10% credentialed class” haters. :)
“driving asset prices for things like housing and health care”
Links?
Links?
Showing my age here, but in the words of John McEnroe,
‘YOU CAN NOT BE SERIOUS!?!’
healthcare takes some unpacking but housing, oh you only need to see many of the houses in various places being bought up by Chinese squillionaires to think it might have some effect on the housing market.
Squiillionaires =/= the 10%.
I understand the attractiveness of the 10% meme,
but the 90-98% percentile of the income distribution (at least in the U.S.) are
(i) Heterogeneous in time, as was pointed out by another commenter
here several days ago. If you weren’t in the 10% two years ago, and won’t be again next year, what is your responsibility for the existing power structure?
(ii) Heterogeneous in power. Yes, some of them can facilitate the .01% in their
tax avoidance and other crimes, but the lawyers, accountants and lobbyists who do that are far more likely to be in the top 1% or higher.
(iii) Not so wealthy that they can buy justice. As Peter Thiel said during the Gawker trial, mere single digit millionaires like Hulk Hogan don’t really have access to the legal system.
(iv) Being only in the 90th percentile nationally means you’re locked out of many local markets.
A broad stroke like “the 10%” is a convenient human shield for the .1% to hide behind.
If the WWC is worth reaching out to, so is at least the lower half of the 10%.
One point:
It’s a deliberate attempt to transfer income upwards by the current very rich, who own the political system.
There is a very real class war going on here.
But, with the willing participation of the majority who keep voting between two carefully curated political candidates (who may appear to have surfaced from nowhere – sorry, Trump is no outsider either) bubbled up by TPTB and media. So, the end result is not surprising.
And what other choices are available to voters?
Personally, I have voted Green (for whatever offices possible) since 2009, but I have no delusion that the Greens are a functioning political party. Nor are the so-called Democrats or Republicans. But this focus on two individuals who are expected to change the trajectory of the country is ridiculous.
Change will have to come from below. It won’t be pretty, but the top one-tenths of one percent flogging all the rest ain’t either, actually.
Inevitable, since much of the economy seems to be dedicated to casino gambling, spreadsheet diddling, and extraction by vampire squids from the fragile remnants of real economic growth.
Trump will enable the giant sucking sound to increase, with no environmental or labor policy limitations on the extraction. Why do the vampire squids care, they can hide away in gated enclaves where they don’t have to breathe the bad air or deal with restive poors.
Hey, there’s always the microbes! They don’t respect gated enclaves or bubbles or large bank accounts. The problem is they don’t respect anybody.
Interesting, the last chart. The decade of the 90’s, the only one with positive income growth for the 90% since the 60’s.
That was the one decade that was “good” to me (1980-present) from an earned income perspective. I think more credit to Bush Sr’s tax increase than anything the Clintons did.
Does anyone know why income keeps declining from 1949 till 1970? It’s quite peculiar. I thought it was supposed to be the golden age for the bottom90%
My guess? It’s a sliding scale with complete mafia/drug gang takeover of unions on the one end* and union capture by corporate management on the other.* As far as I can tell, they started figuring out these mechanisms of control after WWII, but didn’t perfect them until Reagan came into office in the 80s.
(*What do you think the whole Jimmy Hoffa/Teamsters thing was all about? Or why half of the JFK conspiracy theories involve the mob working hand in glove with unions? Or why so many former union rank and file — myself included — are virulently anti-union but pro-professionalization for their children?)
The charts document “income growth” not “income” so declining growth is still growth in income.
The argument has been made that increasing class separation historically has always ended in either disastrous times or violence. There is no reason to expect anything different this time.
I encourage everyone to read the “elsewhere” link. I think he somewhat downplays the role of financialization and the FIRE segment of the economy’s effects on income inequality in general, but his solution focuses on:
Very few have argued that expansion of our social safety net (wealth transfers) is an important element to combat inequality. This augers for single payer, expanded social security, and other means-tested approaches to deal with inequality.
“I think he somewhat downplays the role of financialization and the FIRE segment of the economy’s effects on income inequality in general, but his solution focuses on:”
That is “she” and “her.” If you want to see some interesting videos, go to you-tube and paste in “Pavlina Tcherneva.” I have seen several, and doubt she will disappoint.
There was a radio discussion yesterday on ‘Charlotte Talks’ about a related subject, economic mobility. A report ranking fifty cities put Charlotte last in economic mobility. Utah, on the other hand, has nearly as much economic mobility as Denmark. The discussion on Charlotte talks is in part 2 of the program.
http://wfae.org/post/late-night-hb2-agreement-reached-task-forces-poverty-report-now-awaits-action
https://www.bloomberg.com/view/articles/2017-03-28/how-utah-keeps-the-american-dream-alive
I think a large portion the rebound in the proportions of income growth captured by the bottom 90 percent of income earners is a relic of Obama raising the capital gains rate 66% (from 15% to 23.8%) in 2013. That is to say, I think that many in the 1% had lower incomes, because they decided that was too much to pay in capital gains so they didn’t sell assets they would otherwise have sold. Ultimately that means capital does not flow to highest and best uses. I would love to see a study that focuses on capital gains by the 1%.
Oops! Didn’t make the point I’d started out to make:
In Charlotte, we probably have a greater proportion of people of Scots-Irish descent than in most other places. Also a greater proportion of African Americans than in many other American cities. We know that people who count themselves as being of Scots-Irish descent are five times more likely than people who consider themselves to be of English descent to have a net worth of a million dollars or more, even though they earn about fifteen percent less than people of English descent on average. (This is in ‘The Millionaire Next Door.’) African Americans, on the other hand, tend to have only about ten percent the wealth of white Americans, and the discrepancy has been worsening since 1983, according to Pew Research. (The likelihood that an African American lives in poverty has declined by half since the seventies, however.)
My point is that ethnicity has a lot to do with wealth aggregation, but it is kind of a forbidden subject in public policy circles. Charlotte would rather create a commission to improve economic mobility than it would recognize that the economic immobility is because all these Scots-Irish people are hanging on to their wealth because of their ancestors’ experience of poverty four hundred years ago, and African Americans, even when they’ve gotten an education and have decent incomes, have not, for historical reasons also, yet developed the habits of thrift, savings, and investment that fuels the wealth gap on the upper end.
You forgot the /sarc tag for your last paragraph. Your blame the victim for being poor and not the perpetrator for making them poor is either a racist point of view or sarcasm. I prefer the latter with my morning coffee.
And while ethnicity does have a lot to do with wealth creation, it is a tool of the haves against the have nots, not as a reason for the Scots-Irish being rich.
No sarc tag needed. No racist tag either. Please read more closely.
Neither spending money nor saving money is a crime, and different ethnicities have different aptitudes for each.
There are exceptions: the African American Peanut Man of Charleston, SC, drove his little bike with a front rack full of peanuts all round the city yelling, ‘Here comes the peanut man!’ He must have sold a few, because when he died he had $200,000 in the bank.
There must be an explanation for the descendants of Scots being five times more likely to be millionaires than those of the English. And the Scots weren’t at the top of the list. Russians were. (See ‘The Millionaire Next Door’.)
I don’t in any way deny that historic and present racism is behind a lot of the disparities between ethnic groups. But the fact that incomes have become less unequal while wealth has not tells you that other factors are at play: I think the most important factor, and I think ‘TMND’ would support this, is the propensity to save.
i think it’s the propensity of very wealthy people to game the system, and the propensity of politicians to take bribes to help them do this. abolish or cut the estate tax, cut the marginal tax rates at the top, sell off public property to wealthy “investors” at pennies on the dollar, and wealth inequality grows.