By rjs, a rural swamp denizen from Northeast Ohio, and a long-time commenter at Naked Capitalism. Originally published at MarketWatch 666.
This week saw the 14th major revision to our national income and product accounts since 1929; we’ve taken a brief look at what that means… Then, in reviewing the major revision to first quarter GDP, we find that what we felt was an aberrant build in farm inventories was not only left in place, but became larger; and the contribution of larger farm inventories has now increased to 80% of the first quarter GDP growth… And then, in reviewing the first estimate of 2nd quarter GDP, we find that the new BEA method of adjusting nominal GDP using chained 2009 dollars resulted in some unrealistic changes to consumer spending contributions…. Finally, we review the June personal incomes and outlays report and find that real incomes fell in but real spending rose nonetheless..
Second Quarter GDP and Revisions
The major story in the release of the 2nd quarter GDP was not that the 2nd quarter growth beat expectations by rising at a 1.7% rate, but that the estimates released on Wednesday reflected both a change in the components of GDP, and an annual as well as a comprehensive (or benchmark) revision of the national income and product accounts going back to 1929, from the beginning of that measure of our economic history. That overhaul also inflicted major changes on the first quarter GDP, which a month ago surprised us when we saw it revised from the earlier reported 2.5% to 2.4% growth to an annual rate of 1.8%. With this release, the growth rate in the 1st quarter of this year has taken another hit and is now seen as having grown only at an annual rate of just 1.1%. Furthermore, with growth in the 4th quarter of 2012 also having been revised to a 0.1% rate from the 0.4% last reported, we’ve now seen 3 quarters of a year pass where the average economic growth has slumped below 1.0% annualized…

The most important change to GDP with this comprehensive revision is to include creation of intellectual property in the investment component of GDP, which ultimately increased our GDP by $559.8 billion, or 3.6% larger than it was before this week. This includes capitalization of research and development, which had previously been treated as an expense, and capitalization of entertainment, literary, and artistic works judged to have a long-lasting value to the businesses or institutions that own them (Seinfeld is one example). If you accept the premise of judging our national net worth by its dollar value, then these changes were a long time in coming, as our national products accounts already recognized capital investments in other intangible assets such as software…
Other changes include an expanded recognition of ownership transfer costs for residential real estate investment, a change in accounting for transactions of defined benefit pension plans to an accrual basis, recognizing the costs of unfunded liabilities, and a change in the benchmark year for real variables in national accounts from 2005 to 2009; the effect of which will be to increase the inflation adjusted basis of GDP and its components, as chained 2009 dollars are used instead of the previously used chained 2005 dollars. Further details on these and other changes, which received little coverage by the blogs or the media, are here (pdf)
The net effect of all the benchmark revisions exacted this week is illustrated by the above chart from the report, which shows the additions to GDP over the span from 2002 to 2012 in billions of dollars by the upper dashed line vis a vis what it was previously. The net effect of the statistical changes over the same period is shown by the lower dashed line, which you’ll note had tended to be neutral or a subtraction until 2012 . The combination of the two yields the dark line, which represents the total revision to GDP in billions over this period. The larger point to be made here is that these changes to GDP are to the gross amount and they’ve already been applied over time, and subsequent quarter over quarter GDP reports will still represent the annualized percentage growth rate from one quarter to the next under the same expanded definitions. Thus if new R&D or the value of capitalized entertainment now falls from one quarter to the next, it will be a drag on GDP, just as a decrease in homebuilding would lower the investment component of GDP for that quarter…
As we just covered first quarter GDP last month and it has now been significantly revised, we’ll take a quick look at what the revisions were that reduced first quarter growth from an annual rate of 1.8% to a 1.1% rate. Personal consumption expenditures were thought to be up at a seasonally adjusted 2.6% annual rate in the 1st quarter, and the annual rate of change has now been revised to a 2.3% increase; and thus the contribution from consumers to the change in first quarter GDP was reduced from 1.83% to 1.54%. Similarly, gross private investment was originally thought to have grown at a 7.4% rate in the 1st quarter, and that’s now been revised to a 4.7% growth rate; and the effect of this revision was to subtract .25% off top line first quarter GDP, leaving the contribution to the GDP change from investment at .71%. Fixed investment, which had been thought to be up 3.0%, actually fell 1.5%, mostly due to a 25.7% rate of contraction in non-residential construction. The change in private inventories, on the other hand, were found to be 63% greater than originally thought, and instead of just adding .57% to the first quarter growth rate, they now have added .93%. But another big hit to 1st quarter GDP came from a worse than first published balance of trade; exports, originally thought to be off a seasonally adjusted 1.1% annual rate in the first quarter, were found to be off 1.3% instead, and took .18% off the final GDP figure. And imports, which were thought to have been down 0.4%, were actually up at a 0.6% rate, and as increasing imports subtracts from GDP, that switch turned imports from a 0.6% addition to GDP to a subtraction of .10%. Finally, government was slightly less a drag than originally estimated; federal government spending and investment was off .84 instead of the .87 in last month’s print, while state and local governments only shrunk 1.3%, not the 2.1% originally reported. So instead of subtracting .93% from the GDP change, shrinking government spending only subtracted 82% from the first quarter GDP…
One footnote to first quarter GDP we should include is of that large contribution from growing inventories, the lions share was an increase in winter farm inventories, some of which appears a seasonally adjusted statistical rebound from the drought suppressed inventory levels in the summer and fall of last year. Instead of the original record .83% addition to the first quarter growth rate from farm inventories, the contribution has been increased to .88%, more than four times larger than any previous annual contribution from farm inventories over the decade.. In other words, since the economy only grew at a 1.1% rate in first quarter, and growth in farm inventories added .88% to GDP, 1st quarter GDP growth would have printed just +0.2% without them…
In the 2nd quarter, real gross domestic product (the output of all goods and services produced by labor or property in the US) rose at a seasonally adjusted 1.67% annual rate to $15,648.7 billion from the first quarter figure of $15,583.9 billion, based on the chained 2009 dollars on which all comparisons are now made. In current dollars, US GDP now stands at $16,633.4 billion, up from the $16,535.3 billion and the $16,420.3 billion at year end 2012. The BEA emphasized that this 2nd quarter advance estimate is based on incomplete source data and is subject to revision at the end of each of the next two months, a process we’ve seen time and again and just noted in the first quarter which originally was reported to have grown at a 2.5% rate and is now in the books at 1.1%. But even with BEA’s leading rejoinder, that wont stop the media from treating these numbers as gospel.
We should point out that all dollar amounts and percentages in each GDP report are given at a seasonally adjusted annual rate, which means that the real dollar increase or decrease for any quarter is extrapolated out to an annual amount based on normal seasonally factors; what that means in practical terms, for example, is that if consumer spending in the first three months of the year normally only amounts to one-fifth the annual total, the real dollar amount of consumer spending in the first quarter will be quintupled in the reported numbers. A similar annualization is applied to the percentages; ie, for the widely reported second quarter GDP growth of at 1.67%, that’s at an annual rate and really means that the the national output of goods and services really only rose a bit more than 0.4% over the April through June period. And since that’s the way they’re reported, it’s those annualized figures that well be looking at..
Real personal consumption expenditures in the second quarter were at a seasonally adjusted annual rate of $11,430.3 billion, increasing at an annual rate of 1.8% from the revised first quarter’s $11,379.2 billion rate, and contributed 1.22% to the 1.67% annualized growth rate in the GDP. Consumer spending on durable goods increased at a 6.5% annual rate to $1,258.3 billion annualized and contributed .48% to the quarter’s growth rate; spending on nondurable goods increased at a 2.0% rate to $2,593.2 billion and contributed .31%, while personal outlays for services increased at a 0.9% annual rate to $7,578.7 billion and contributed 0.43% to the increase in 2nd quarter GDP…
We should also note that the amounts here are given in current dollars, but the BEA computes the quarter over quarter annualized percentage changes based on chained 2009 dollars, which seems an odd year to benchmark one’s inflation adjustment on, since it represents the deflationary depth of the recession. This has the potential to result in some apparent distortions in current data. For instance, the seasonally adjusted annual rate of consumer spending for non-durable goods actually dropped 2.1% from $2,607.0 billion in the 1st quarter in seasonally adjusted current dollars to $2,593.2 billion in second quarter, but the adjustment of that from nominal dollars to chained 2009 dollars resulted in a 2.0% annualized rate of increase, ie (2,333.7/2,322.2)^4 = 1.0199564, or a 2.0% increase rounded. Please see GDP full release with tables (pdf), table 3B, page 44, line 9, for 2009 chained dollars; table 3A, page 38, line 9 for current dollars)
Continuing with our report, overall gross private investment increased from a seasonally adjusted $2,555.1 billion annualized in the 1st quarter to $2,620.0 billion in the 2nd quarter and added 1.34% to the quarterly rate of change. Non-residential investment increased to $2,028.3 billion, a 4.6% annualized rate above the first quarter and added 0.93% to GDP; of that, investment in non-residential structures increased 6.8% annualized to $441.4 billion and added .17%, investment in equipment increased at a rate of 4.1% to $936.2 billion and added .23%, while the value of intellectual property increased 3.8% to $650.6 billion and added .15%. in addition, real residential fixed investment increased 13.4% to $513.0 billion and added .38% to the change in GDP. Private inventories increased by a seasonally adjusted $78.7 billion in the 2nd quarter and added 0.41% to the second-quarter GDP rate of change. Another seasonally adjusted increase in farm inventories accounted for $42.1 billion of that and accounted for .13% of that change.
As always, our negative balance of trade subtracted from GDP, at a $505.3 billion annualized rate in the 2nd quarter, but it is the change in exports and imports from quarter to quarter that affects the change in GDP which we’re looking at here. Inflation adjusted exports of goods and services increased at a seasonally adjusted rate of 5.4% to $2,227.2 billion in the second quarter and added .71% to the annual rate of GDP increase, while net real imports increased 9.5% to $2,765.7 billion and subtracted 1.51% from 2nd quarter growth rate. Thus with imports increasing more than exports, net exports were a .81% drag on the 2nd quarter GDP growth rate…
Net government spending and investment, which shrank to an annualized $3,121.6 billion in the 2nd quarter, was again a drag on growth, but not as much as the preceding two quarters. Real federal outlays and investment shrunk by 1.5% to $1,252.5 billion and subtracted from second quarter growth at a .12% annual rate. Defense spending, which had been down at a 12.0% rate in the first quarter and 22.1% in the last quarter of 2012, shrank another 0.5% to $776.1 billion, while non-defense spending and investment fell 3.2% to $476.4 billion (note that government transfer payments, such as social security and medicare, are included in personal consumption expenditures). Meanwhile, state and local government expenditures and gross investment rose for only the 2nd time since the 3rd quarter of 2009, by 0.3% to $1,869.1 billion in the quarter. and made a tiny contribution of 0.4% to the 2nd quarter rate of change.
Our FRED graph below shows the change, in billions of chained 2009 dollars, in each of the major components of GDP, over each quarter, for the last two years. Those components that contracted in a given quarter are shown below the zero line and subtract from GDP, those that are above the line grew during that quarter and added to GDP. The exception is imports in green, which subtract from GDP, and which are shown on this chart as a negative, so when imports shrink, they will appear above the line as an addition to GDP, and when they increase, as they have in the recent quarter, they’ll appear below the zero line. Otherwise, real personal consumption expenditures are shown in blue, gross private investment, including structures, equipment and intangibles, is shown in red, exports are shown in purple, and the change in private inventories is in yellow. Lastly, the change in state and local government spending and investment is shown in pink, while the change in Federal government spending and investment is shown in grey…

June Income and Outlays
Another important release from the BEA this week that completely slipped under the radar was the report on June Personal Income and Outlays, which tended to be ignored by the blogs and the media because it crossed the wires the same time Friday morning as the July unemployment report. But this report is arguably one of the more important of the regular monthly economic releases, as it not only gives us gross national figures on personal income and disposable income after taxes, but also gives us the monthly aggregate amount of personal consumption expenditures (PCE), which accounts for roughly 70% of the economy, total personal savings and the national savings rate, as well as the price index for PCE, which the Fed uses as it’s inflation gauge when setting monetary policy…
Like the GDP report we’ve just reviewed, earlier releases of this report underwent a major revision as of this report of data back to 1929 associated with the 14th comprehensive revision of the national income and product accounts Included were major definitional changes to personal income, including using an accrual approach for measuring defined benefit pension plans, which resulted in upward revisions to personal income receipts on assets for the entire period and upward revisions to income supplements for employer contributions for employee pension and insurance funds for most years. The estimates of proprietors’ income were also changed to more accurately account for capital gains and losses attributable to corporate partners. The cumulative effect of these and other changes on each of the categories of personal income over the past four years is shown in the chart below from the BEA and discussed in more detail in the latter half of the press release…

For June, seasonally adjusted personal income increased at an annual rate of $45.4 billion to an annualized $14,102.9 billion, 0.3% higher than May’s annualized $14,057.5 billion; this was still $362.7 billion, or 2.5% below the gross income level of December of 2012, when special dividend payments, bonuses, and other fiscal cliff related tax avoidance schemes boosted incomes to an annualized $14,420.2 billion. June disposable personal income (DPI), which is income after taxes, rose at a $33.6 billion rate to $12,428.2 billion, also 0.3% higher than May, and also below the $12,829.2 billion annualized DPI of December…
Wages and salaries, which account for roughly half of income, did unusually well in June, rising at a $38.0 billion clip, with only government wages and salaries falling at a $0.5 billion rate; other sources of income in June included income receipts on assets (ie, interest and dividend income), which increased at a $22.7 billion rate, rental income, which was $1.5 billion higher, and business proprietors income, which rose at a $2.3 billion clip. In addition, transfer payments were $6.0 billion higher at an annual rate, led by a $4.2 billion increase in social security payments. Meanwhile, contributions to government social insurance, which subtract from income, rose at a $4.9 billion rate, and farm owner’s incomes fell at a $24.0 billion annual rate.
Spending increases outpaced incomes in June, as personal consumption expenditures (PCE) rose $59.4 billion, or 0.5%, to an annualized $11,476.3. Spending for durable goods rose $10.7 billion to $1,267.8 billion, while spending for non durables rose $33.5 billion to $2,619.4 billion and spending for services rose $15.2 billion to $7,589.1 billion, all at a seasonally adjusted annualized rate..
Total personal outlays, which includes personal interest payments and personal transfer payments in addition to PCE, increased $55.3 billion to an annualized $11,881.5 billion in June. Personal savings, which is disposable personal income minus total outlays, was thus at $546.6 billion in June, down a bit from the $568.3 billion of savings in May. This left the personal saving rate, which is savings as a percentage of disposable personal income, at 4.4% in June, compared with the 4.6% year to date high savings rate in May. This and the track of other major metrics from this report can be seen on our FRED graph below, which shows the personal savings rate in green, real disposable personal income in blue, and real PCE in red since January 2000.
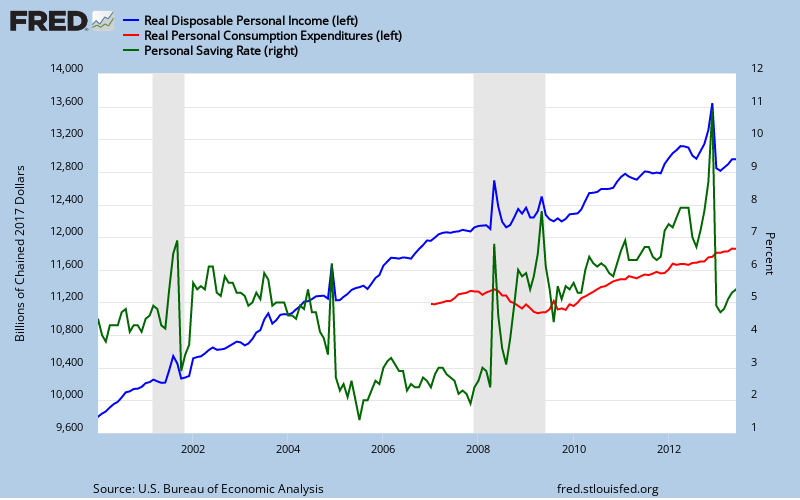
The metrics for real disposable personal income (DPI) and real personal consumption expenditures (PCE) shown above are arrived at by adjusting DPI and PCE for inflation using the PCE price index, which is also generated with this report, and which we’ve noted, is the Fed’s preferred inflation gauge. The price index for PCE increased 0.4% in June, in contrast to an increase of 0.1% in May and a negative 0.3% in April. The result of applying this deflator was to change real disposable personal income into a 0.1% decline, and to reduce real personal consumption expenditures to a 0.1% increase. The June core PCE price index, which excludes food and energy, was up 0.2 percent, up from 0.1% in May. The year over year rate on the headline PCE price index has now risen from last month’s 1.07% to 1.31%, while the year over year Core PCE price index is unchanged at 1.22%, both well below the Fed’s target of 2.5%…


So ultimately the economy continues to stumble around on the edge of the trash can and there is only a meager possibility of retrieval until sometime next year perhaps?
Well, there could be ponies. I love ponies!!!!!!! And it’s probably better to have the economy stumbling about than collapsing, screaming, in pain (for some, very much for some). All that said, er, yes.
Fair enough.
ps. I love stallions!
there is a footnote on the GDP press release which reads:
Quarterly estimates are expressed at seasonally adjusted annual rates, unless otherwise specified. Quarter-to-quarter dollar changes are differences between these published estimates. Percent changes are calculated from unrounded data and are annualized. “Real” estimates are in chained (2009) dollars. Price indexes are chain-type measures.
of all those who reported on GDP this quarter, i did not see one who explained that the percentage changes in real GDP & its components were based on chained 2009 dollars..
rjs, I venture to say that the sparse commentary is not an indicator of the great interest of many of your readers.
It’s the stench of a decaying economy that is not willingily absorbed by most readers..
Im assuming most of the readers are lost for words.
I know I am. I dont know what to say.
Silent Affirmation…
skippy… virtual economics… wa’d you expect[???].
i’ve worked around this horror show with rj since 08/09 and Emma & Massinissa are both correct…i would add it takes days to sink in. i start with his sunday a.m links and its tuesday or later before ive got it near filtered (and this datadive ain’t nothin compared to his sunday links).
im not alone in appreciating this one stop historical Real data and id pay him for it but he’s taken a vow of poverty
also the dude put vers in versatility ‘ )
http://www.verdantpress.com/rjs.html
Is is just me, or do these revisions improve the performance of the economy on a GDP basis during the Obama Presidency? Just saying.
jim, yes, slightly…
the net of the revisions is that great recession wasnt so great (in part because the years leading up to it werent so great) amd the recovery, especially 2012, looks better than it first printed…
i would seriously doubt that there was any manipulation; this has been a long time coming and the definitional changes are logical..remember, those who do this work for the BEA are career nerds & not particularly partisan…more than likely more than half of them were hired before obama was even president…